This article presents a method for power factor correction and power compensation taking into account the injection of distributed generators in the distribution networks. Distribution networks are most often exposed to problems of harmonic disturbance. This work proposes a method that combines active filters and perturb and observe algorithms to reduce the rate of harmonic distortion in a photovoltaic system that is to be fed into power grids. A THD of 2.14% is achieved in compliance with the IEEE 519-2014 standard. Voltage and current profiles have good waveforms. The voltage level is regulated by the PI regulator. The perturb and observe algorithms associated with the filter developed in this work have shown their superiority in terms of voltage stability and power demand management for a grid-connected photovoltaic system.
| Published in | International Journal of Energy and Power Engineering (Volume 14, Issue 2) |
| DOI | 10.11648/j.ijepe.20251402.13 |
| Page(s) | 50-62 |
| Creative Commons |
This is an Open Access article, distributed under the terms of the Creative Commons Attribution 4.0 International License (http://creativecommons.org/licenses/by/4.0/), which permits unrestricted use, distribution and reproduction in any medium or format, provided the original work is properly cited. |
| Copyright |
Copyright © The Author(s), 2025. Published by Science Publishing Group |
Harmonics Mitigation, Sustainable System, Optimal Power Generation, Power Quality Improvement, Photovoltaic Power Plant, On Grid
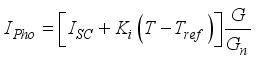
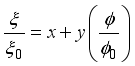 (1)
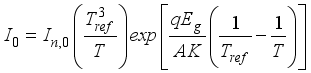
(1) 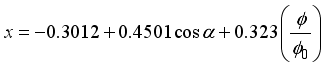 (2)
(2) 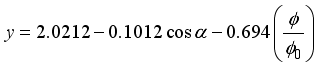 (3)
(3) 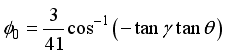 (4)
(4)  is monthly average day length (h);
  monthly average daily hours of bright sunshine (h) and x, y regression coefficients.
 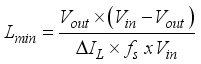 (5)
(5)  is the PV array voltage,
  is the output voltage, ΔIL is the desired peak-to-peak inductor current ripple (set to approximately 25% of the average input current), and fs is the switching frequency.
 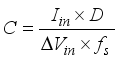 (6)
(6)  is the output current, D is the duty cycle, and
  is the allowable voltage ripple.
  (7)
(7)  (8)
(8) 
 (9)
(9)  (10)
(10) Parameters | Monocrystalline | Polycrystalline |
|---|---|---|
Maximum power (W) | 50 | 50 |
Maximum power voltage (V) | 18 | 18 |
Maximum power current (A) | 2.78 | 2.77 |
Open circuit voltage (V) | 21.6 | 19.2 |
Short circuit current (A) | 2.9 | 3 |
Number of cells | 36 | 36 |
Tolerance | ± 3% | / |
THD | Total Harmonic Distortion |
MPPT | Maximum Power Point Tracking |
PVG | Photovoltaic Generators |
IEEE | Institute of Electrical and Electronics Engineers |
P&O | Perturb and Observe |
PWM | Pulse Width Modulation |
PLL | Phase-locked Loop |
| [1] | N. Premkumar, M. R. Madhavi, K. Kitmo, and S. Shanmugan, “Utilizing the lignocellulosic fibers from Pineapple Crown Leaves extract for enhancing TiO2 interfacial bonding in dye-sensitized solar cell photoanodes,” Mater. Renew. Sustain. Energy, vol. 13, no. 1, pp. 13–25, Apr. 2024, |
| [2] | B.-P. Ngoussandou et al., “Optimal Placement and Sizing of Distributed Generations for Power Losses Minimization Using PSO-Based Deep Learning Techniques,” Smart Grid Renew. Energy, vol. 14, no. 9, pp. 169–181, Oct. 2023, |
| [3] | S. Alphonse et al., “Optimization PV/Batteries System: Application in Wouro Kessoum Village Ngaoundere Cameroon,” J. Power Energy Eng., vol. 9, no. 11, pp. 50–59, Nov. 2021, |
| [4] | B.-P. Ngoussandou et al., “Optimal energy scheduling method for the North Cameroonian interconnected grid in response to load shedding,” Sustain. Energy Res. 2023 101, vol. 10, no. 1, pp. 1–25, Sep. 2023, |
| [5] | K., G. B. TCHAYA, N. Djongyang, S. Alphonse, and D. K. KAOGA, “Optimization of the smart grids connected using an improved P&O MPPT algorithm and parallel active filters,” J. Sol. Energy Res., vol. 6, no. 3, pp. 814–828, Jul. 2021, |
| [6] | M. F. Elnaggar et al., “Optimal sizing and power losses reduction of photovoltaic systems using PSO and LCL filters,” PLoS One, vol. 19, no. 4, p. e0301516, Apr. 2024, |
| [7] | R. Palanisamy, M. Singh, R. Ramkumar, S. Usha, T. M. T. Thentral, and Kitmo, “Capacitor voltage unbalance minimization for three-phase five-level diode-clamped inverter using hexagonal hysteresis space vector modulation,” Multiscale Multidiscip. Model. Exp. Des., pp. 1–11, Sep. 2023, |
| [8] | S. Usha, T. M. ThamizhThentral, R. Palanisamy, A. Geetha, P. Geetha, and Kitmo, “Mitigation of circulating current and common mode voltage in grid-connected induction motor drive using modified PID-fuzzy controller,” Multiscale Multidiscip. Model. Exp. Des., pp. 1–15, Jul. 2023, |
| [9] | Kitmo, R. Djidimbélé, D. K. Kidmo, G. B. Tchaya, and N. Djongyang, “Optimization of the power flow of photovoltaic generators in electrical networks by MPPT algorithm and parallel active filters,” Energy Reports, vol. 7, pp. 491–505, Nov. 2021, |
| [10] | Kitmo and M. M. Rahman, “Investments in Energy Complexes: Evidence from Tajikistan,” pp. 209–219, 2024, |
| [11] | Yaouba et al., “An Experimental and Case Study on the Evaluation of the Partial Shading Impact on PV Module Performance Operating Under the Sudano-Sahelian Climate of Cameroon,” Front. Energy Res., vol. 10, p. 924285, Aug. 2022, |
| [12] | Kitmo, G. B. Tchaya, and N. Djongyang, “Optimization of hybrid grid-tie wind solar power system for large-scale energy supply in Cameroon,” Int. J. Energy Environ. Eng., pp. 1–13, Nov. 2022, |
| [13] | M. Jaszczur and Q. Hassan, “An optimisation and sizing of photovoltaic system with supercapacitor for improving self-consumption,” Appl. Energy, vol. 279, p. 115776, Dec. 2020, |
| [14] | M. Ali, H. Kotb, K. M. Aboras, and N. H. Abbasy, “Design of cascaded pi-fractional order PID controller for improving the frequency response of hybrid microgrid system using gorilla troops optimizer,” IEEE Access, vol. 9, pp. 150715–150732, 2021, |
| [15] | S. N. A. Latif et al., “The Trend and Status of Energy Resources and Greenhouse Gas Emissions in the Malaysia Power Generation Mix,” Energies 2021, Vol. 14, Page 2200, vol. 14, no. 8, p. 2200, Apr. 2021, |
| [16] | Kitmo, G. B. Tchaya, and N. Djongyang, “Optimization of the photovoltaic systems on the North Cameroon interconnected electrical grid,” Int. J. Energy Environ. Eng. 2021 131, vol. 13, no. 1, pp. 305–317, Oct. 2021, |
| [17] | M. Awad, M. M. Mahmoud, Z. M. S. Elbarbary, L. M. Ali, S. N. Fahmy, and A. I. Omar, “Design and analysis of photovoltaic/wind operations at MPPT for hydrogen production using a PEM electrolyzer: Towards innovations in green technology,” PLoS One, vol. 18, no. 7, p. e0287772, Jul. 2023, |
| [18] | M. Haris et al., “Genetic algorithm optimization of heliostat field layout for the design of a central receiver solar thermal power plant,” Heliyon, vol. 9, no. 11, Nov. 2023, |
| [19] | B. Andre, S. Alphonse, N. N. Stephane, D. Goron, P. A. Duvalier, and. K., “Modeling of a photovoltaic drip irrigation system for an offseason crop: case of onion cultivation in PITOA (North Cameroon),” Int. J. Eng. Technol., vol. 13, no. 1, pp. 1–12, Jan. 2024, |
| [20] | B. Jyothi, P. Bhavana, B. T. Rao, M. Pushkarna, Kitmo, and R. Djidimbele, “Implementation of Modified SEPIC Converter for Renewable Energy Built DC Microgrids,” Int. J. Photoenergy, vol. 2023, 2023, |
| [21] | S. Liu et al., “Integration method of large-scale photovoltaic system in distribution network based on improved multi-objective TLBO algorithm,” Front. Energy Res., vol. 11, p. 1322111, Jan. 2023, |
| [22] | K. K. Dieudonne, M. Bajaj, Kitmo, O. Rubanenko, F. Jurado, and S. Kamel, “Hydropower Potential Assessment of Four Selected Sites in the North Interconnected Network of Cameroon,” 2022 IEEE Int. Conf. Autom. Congr. Chil. Assoc. Autom. Control Dev. Sustain. Agric. Syst. ICA-ACCA 2022, 2022, |
| [23] | Kitmo, N. B. Pierre, M. Bajaj, K. M. Aboras, and I. Hossain, “New Approach to Fast and Hyperstable State Observers for Stochastic and Complex Systems,” Int. J. Photoenergy, vol. 2022, 2022, |
| [24] | A. Boussaibo, A. D. Pene, K. , A. Boussaibo, A. D. Pene, and K. , “Optimal Sizing and Power Losses Reduction of Photovoltaic Systems Using PVsyst Software,” J. Power Energy Eng., vol. 12, no. 7, pp. 23–38, Jul. 2024, |
| [25] | Y. Meng, Y. Yang, H. Chung, P. H. Lee, and C. Shao, “Enhancing Sustainability and Energy Efficiency in Smart Factories: A Review,” Sustain. 2018, Vol. 10, Page 4779, vol. 10, no. 12, p. 4779, Dec. 2018, |
| [26] | Y. Wang, J. Xu, L. Feng, and C. Wang, “A Novel Hybrid Modular Three-Level Shunt Active Power Filter,” IEEE Trans. Power Electron., vol. 33, no. 9, pp. 7591–7600, 2018, |
| [27] | on F. C. IEEE Standards Coordinating Committee 21, Institute of Electrical and Electronics Engineers., and IEEE-SA Standards Board., “IEEE recommended practice for utility interface of photovoltaic (PV) systems,” p. 25, 2000. |
| [28] | Institute of Electrical and Electronics Engineers, IEEE Std 1547-2018 (Revision of IEEE Std 1547-2003) - IEEE Standard for Interconnection and Interoperability of Distributed Energy Resources with Associated Electric Power Systems Interfaces. 2018. |
| [29] | H. Xu, K. P. Seng, L. M. Ang, and J. Smith, “Decentralized and Distributed Learning for AIoT: A Comprehensive Review, Emerging Challenges, and Opportunities,” IEEE Access, vol. 12, pp. 101016–101052, 2024, |
| [30] | Q. N. Trinh and H. H. Lee, “An enhanced grid current compensator for grid-connected distributed generation under nonlinear loads and grid voltage distortions,” IEEE Trans. Ind. Electron., vol. 61, no. 12, pp. 6528–6537, 2014, |
| [31] | M. H. Yabalar and E. Ercelebi, “Hybrid Optimization Based Harmonic Minimization in Three Phase Multilevel Inverter with Reduced Switch Topology,” IEEE Access, pp. 1–1, May 2024, |
| [32] | M. Dashtdar et al., “Improving the Power Quality of Island Microgrid with Voltage and Frequency Control Based on a Hybrid Genetic Algorithm and PSO,” IEEE Access, vol. 10, pp. 105352–105365, 2022, |
APA Style
Kitmo, Goron, D., Jacques, B., Babé, C., Djongyang, N. (2025). Improvement of Photovoltaic Power Plant Energy and Harmonic Attenuation for Grid Enhancement. International Journal of Energy and Power Engineering, 14(2), 50-62. https://doi.org/10.11648/j.ijepe.20251402.13
ACS Style
Kitmo; Goron, D.; Jacques, B.; Babé, C.; Djongyang, N. Improvement of Photovoltaic Power Plant Energy and Harmonic Attenuation for Grid Enhancement. Int. J. Energy Power Eng. 2025, 14(2), 50-62. doi: 10.11648/j.ijepe.20251402.13
@article{10.11648/j.ijepe.20251402.13,
  author = {Kitmo and Deli Goron and Bikai Jacques and Colbert Babé and Noël Djongyang},
  title = {Improvement of Photovoltaic Power Plant Energy and Harmonic Attenuation for Grid Enhancement
},
  journal = {International Journal of Energy and Power Engineering},
  volume = {14},
  number = {2},
  pages = {50-62},
  doi = {10.11648/j.ijepe.20251402.13},
  url = {https://doi.org/10.11648/j.ijepe.20251402.13},
  eprint = {https://article.sciencepublishinggroup.com/pdf/10.11648.j.ijepe.20251402.13},
  abstract = {This article presents a method for power factor correction and power compensation taking into account the injection of distributed generators in the distribution networks. Distribution networks are most often exposed to problems of harmonic disturbance. This work proposes a method that combines active filters and perturb and observe algorithms to reduce the rate of harmonic distortion in a photovoltaic system that is to be fed into power grids. A THD of 2.14% is achieved in compliance with the IEEE 519-2014 standard. Voltage and current profiles have good waveforms. The voltage level is regulated by the PI regulator. The perturb and observe algorithms associated with the filter developed in this work have shown their superiority in terms of voltage stability and power demand management for a grid-connected photovoltaic system.},
 year = {2025}
}
TY  - JOUR
T1  - Improvement of Photovoltaic Power Plant Energy and Harmonic Attenuation for Grid Enhancement

AU  - Kitmo
AU  - Deli Goron
AU  - Bikai Jacques
AU  - Colbert Babé
AU  - Noël Djongyang
Y1  - 2025/07/15
PY  - 2025
N1  - https://doi.org/10.11648/j.ijepe.20251402.13
DO  - 10.11648/j.ijepe.20251402.13
T2  - International Journal of Energy and Power Engineering
JF  - International Journal of Energy and Power Engineering
JO  - International Journal of Energy and Power Engineering
SP  - 50
EP  - 62
PB  - Science Publishing Group
SN  - 2326-960X
UR  - https://doi.org/10.11648/j.ijepe.20251402.13
AB  - This article presents a method for power factor correction and power compensation taking into account the injection of distributed generators in the distribution networks. Distribution networks are most often exposed to problems of harmonic disturbance. This work proposes a method that combines active filters and perturb and observe algorithms to reduce the rate of harmonic distortion in a photovoltaic system that is to be fed into power grids. A THD of 2.14% is achieved in compliance with the IEEE 519-2014 standard. Voltage and current profiles have good waveforms. The voltage level is regulated by the PI regulator. The perturb and observe algorithms associated with the filter developed in this work have shown their superiority in terms of voltage stability and power demand management for a grid-connected photovoltaic system.
VL  - 14
IS  - 2
ER  -
Department of Renewable Energy, National Advanced School of Engineering of Maroua, University of Maroua, Maroua, Cameroon
Department of Renewable Energy, National Advanced School of Engineering of Maroua, University of Maroua, Maroua, Cameroon
Department Energy Engineering, IUT of Ngaoundéré, Ngaoundéré, Cameroon
Department of Renewable Energy, National Advanced School of Engineering of Maroua, University of Maroua, Maroua, Cameroon
Department of Renewable Energy, National Advanced School of Engineering of Maroua, University of Maroua, Maroua, Cameroon
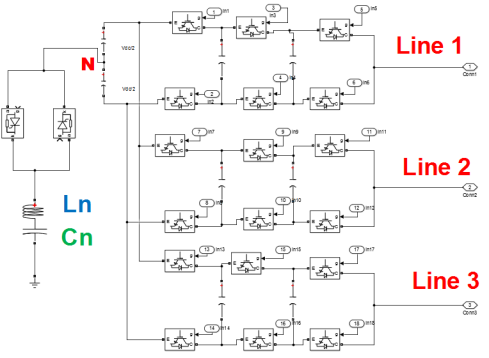
Figure 1. Model of proposed filter.
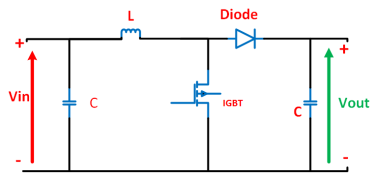
Figure 2. Model of the Boost converter.
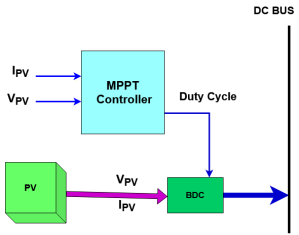
Figure 3. Flowchart of MPPT algorithm using PV generator.
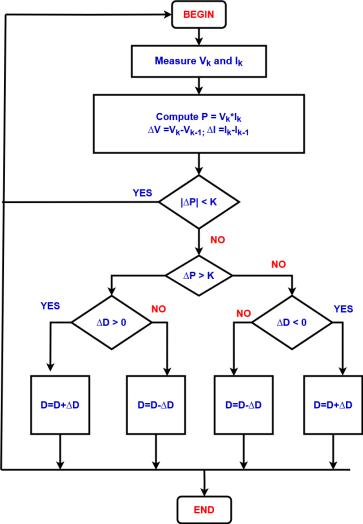
Figure 4. Flowchart of the perturb and observe PV Algorithm.
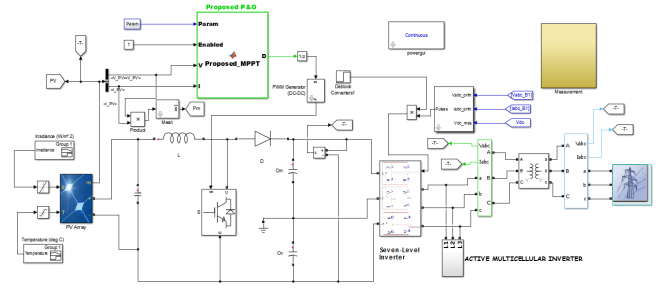
Figure 5. Configuration of overall system.
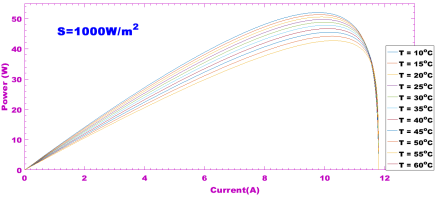
Figure 6. Current/power functions under the influence of temperature.
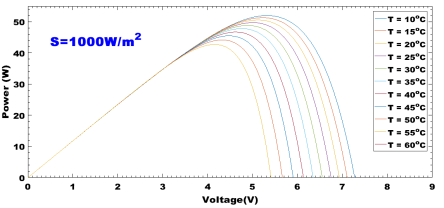
Figure 7. Voltage/power functions under the influence of temperature.
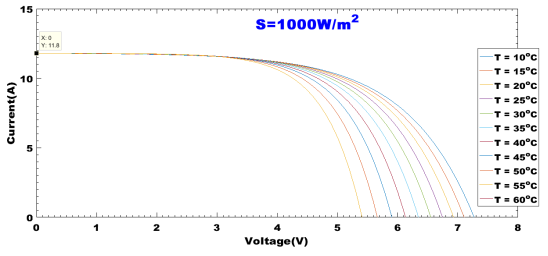
Figure 8. Voltage /current functions under the influence of temperature.
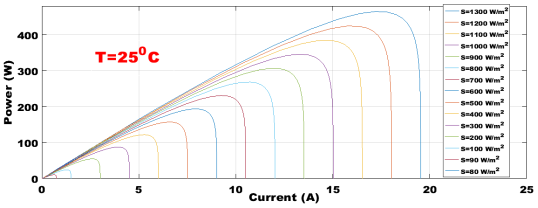
Figure 9. Current/power functions under the influence of irradiance.
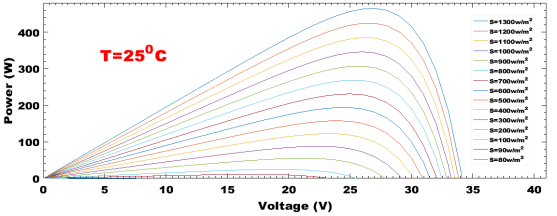
Figure 10. Voltage/power functions under the influence of irradiance.
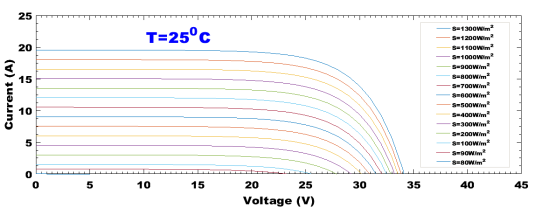
Figure 11. Voltage/current functions under the influence of irradiance.
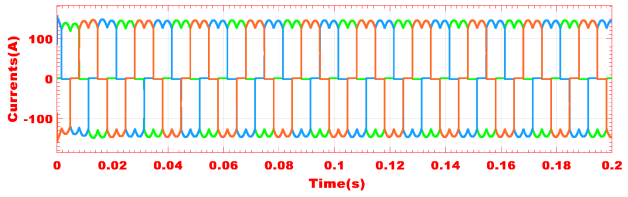
Figure 12. Current waveform deformation due to harmonics.
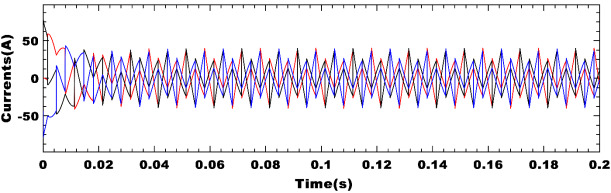
Figure 13. Reference current of the filter to be injected in the Network.
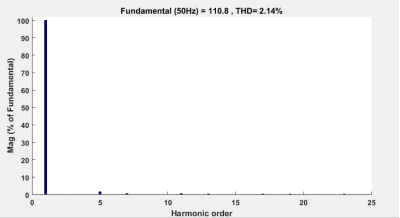
Figure 14. Evaluation of total harmonic distortion.
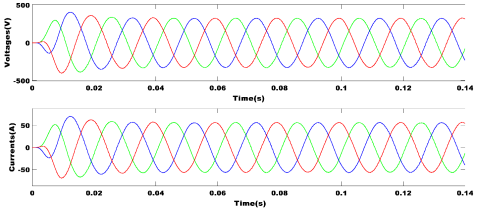
Figure 15. Inverter output characteristics.
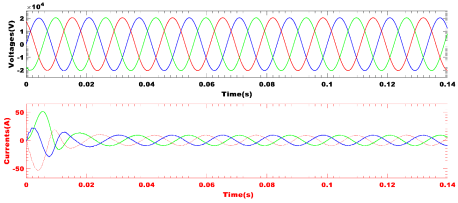
Figure 16. Grid output characteristics.
Information

