Research Article | | Peer-Reviewed

Acid Activated Biochar Prepared from Avocado Pomace for Remediation of Methyl Orange Contaminated Aqueous Solution

Received: 24 May 2025     Accepted: 11 June 2025     Published: 30 June 2025
Views:       Downloads:
Abstract

This study focused on the remediation of methyl orange (MO) from wastewater by preparation of acid activated biochar from avocado pomace, which was obtained from Jimma Industrial Park, Ethiopia. This avocado pomace was considered as a solid waste and accumulated on waste disposal areas of the industrial park. The optimal temperature of 500 °C was selected for further biochar preparation. Physicochemical properties of the biochar have fixed carbon content (71.15 ± 0.84%), ash content (12.95 ± 0.35%), moisture content (10.40 ± 0.45%), volatile matter content (5.50 ± 0.62%) as well as PZC (7.4 ± 0.85). The acid activated biochar at optimum temperature of before and after adsorption was characterized via FTIR, XRD, and SEM. The main parameters of solution pH (5), initial concentration (60 mg/L), mass of adsorbent (0.5 g), and contact time (120 min) were optimized. Langmuir model was more fitted to experimental data and adsorption mechanism was chemisorption; leads to the formation monolayer on the homogenous active site with maximum adsorption capacity 22.988 mg/g. The adsorption phenomena were consistent with PSO kinetics model (R2=0.9997) and adsorption mechanism was chemisorption. Thus, this low cost environmental friendly industrial waste effectively removes MO dye and solves the problem of industrial wastewater through adsorption. More research finding is recommended to study how well this adsorbent works in real wastewater samples.

Published in American Journal of Applied and Industrial Chemistry (Volume 9, Issue 1)
DOI 10.11648/j.ajaic.20250901.11
Page(s) 1-12
Creative Commons

This is an Open Access article, distributed under the terms of the Creative Commons Attribution 4.0 International License (http://creativecommons.org/licenses/by/4.0/), which permits unrestricted use, distribution and reproduction in any medium or format, provided the original work is properly cited.

Copyright

Copyright © The Author(s), 2025. Published by Science Publishing Group

Keywords

Acid Activated Biochar, Adsorption, Avocado Pomace, Methyl Orange

1. Introduction
Environmental pollution is a major challenge in the entire world. It is the release of chemical, physical and biological contaminants to the environment. In recent years contamination of the environment (water, soil and air) by pollutants from different activities has become an increasingly serious problem . It has increased exponentially in the past few years and reached alarming level in terms of its effects on living. Many industries, such as the textile, leather, paper and plastics industries, are highly dye users. Textile industry consumes great amount of water and colored dyes, which generate high volume colorful wastewater .
In Ethiopia, textile production becomes the source of income that contributes to their gross domestic product. However, this has brought both consequences to such countries either in a positive way that is an improvement of economy or in a negative way which led to an increased anthropogenic impact on the biosphere . In Addis Ababa, there are many industrial establishments among which most of them are discharging their effluents directly to the river without any prior treatment . Bahir Dar textile factory possesses serious pollution to aquatic habitat of the head of Blue Nile River in turn makes the water highly polluted .
Most synthetic dyes are highly toxic to humans and aquatic beings, and have acute and chronic effects such as kidney and liver cancer in dye workers. MO is large class of synthetic dyes. The presence of aromatic rings and –N=N– groups in Azo dyes make them highly toxic, carcinogenic and teratogenic. MO dye was selected as a target dye because of its wider application in textile, printing, pharmaceutical, food industries, and chemical laboratories, as well as its negative effects on the environment, animals, and human being. It is water soluble organic synthetic dye with very high coloring ability and presents a bright orange color when dissolved in water .
Different materials can be used to produce the adsorbent such as banana peel, potato peel, apple peel, lemon peel, grape waste and avocado peel fruit-vegetable wastes. Every year, approximately 1.3 billion tons of food is waste and 40-50% of these are fruit-vegetable waste. Valorization of this waste can both prevent the pollution of the environment and help to purify the water . The production and processing of avocado oil leads to an abundance of organic waste that is sent directly into landfill. For every 1000 kg of avocado, only 78 kg of oil is produced . The remaining mass is accounted for by-products in the form of seed (121 kg), skin (153 kg), pomace (150 kg), wastewater (448 kg) .
There are various ways to remove dyes from wastewater discharges like coagulation, adsorption electrochemical process, membrane separation process, chemical oxidation, reverse osmosis and aerobic and anaerobic microbial degradation . Considering their economic disadvantages and inefficiency, many of these processes are not popular. Adsorption is a surface process that leads to transfer of a molecule from a fluid bulk to solid surface which is the easiest, safest and most cost-effective separation methods for the removal of dye. This process involves a mass transfer and leads to the accumulation of atoms, ions or molecules at the interface of two phases, (liquid-solid) adhere using a surface of the adsorbent . Thus, the result of this study finds low cost active adsorbent from avocado pomace and its effective utilization in the removal of MO as a model dye from aqueous solution.
2. Materials and Methods
2.1. Chemicals and Reagents
The chemicals and reagents which have been used in this study were; powder MO dye (C14H14N3NaO3S, 85% Aladdin Co., Ltd., China), phosphoric acid (H3PO4, 98%, Nice Laboratories, India), nitric acid (HNO3, 69%, Loba Chemie Pvt. Ltd., India), hydrochloric acid (HCl, 35.4%; Loba Chemie Pvt. Ltd. India), NaOH (90%, BDH, England) and sodium chloride (NaCl, 99.9%, Fisher Chemical, US). All chemicals used in this study were analytical reagent grade and were used without further purification.
2.2. Apparatus and Instruments
The apparatus and instruments which have been used in this study were; a double-beam UV–Vis spectrophotometer (Model: SPECORD 200/, AnalytiK Jena, Germany), a pH meter (Model: Bante902P, USA), a drying oven (Model GENLAB WIDNERS, England), a thermostatic water bath shaker (Model GrantGLS400, England), an electronic balance (Model: JA103P, China), a sieve (125 µm, ASTME11, UK), a FT-IR (Model: PerkinElmer, Spectrum Two, USA), a XRD (Model: Drawell XRD-7000) and a (Model: JCM-6000plus).
2.3. Preparations and Activation of Acid Activated Biochar
The avocado pomace was obtained from avocado oil processing of Jimma Industrial Park. It was separated from seed and washed as well as oven dried at 105 °C for 6 h. After that, it was crushed, sieved and stored in a desiccator . Up on completion of that, 50 g of grounded-seized sample was soaked with 50% H3PO4 by ratio 1:1 and left for 24 h (Figure 1). After 24 h the sample was washed with distilled water to remove all the excess acid and oven dried at 105 °C for 3 h. About each 10 g of acid treated samples were placed in three ceramic crucibles and putted in the carbonization furnace. The carbonization process was carried out at three different temperatures 400 °C, 500 °C and 600 °C for 2 h and the contents were allowed to cool at room temperature. Each sample was thoroughly washed and rinsed using with distilled water until the pH of the filtrate was approximately 7. Then dried in an oven at a temperature of 105 °C for 3 h and kept in desiccator for further analysis .
2.4. Characterization of Acid Activated Biochar
The proximate analysis of acid activated
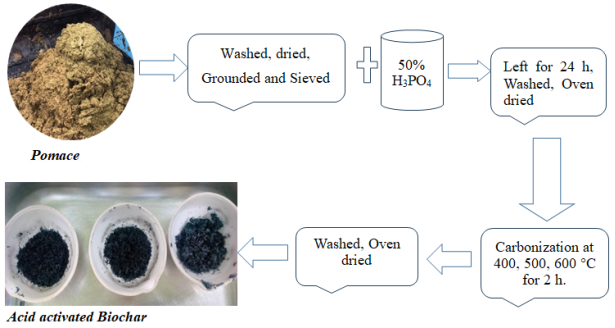
Figure 1. Schematic representation for the preparation of H3PO4 activated biochar from avocado pomace.
2.5. Batch Adsorption Experiments
For batch adsorption studies, the adsorption experiments were performed at room temperature. The adsorbent and the adsorbate were separated by filtration and the filtrate was analyzed for residual MO concentration using UV-Vis spectrophotometer at λmax 465 nm. The percentage removal of MO dye from solutions was calculated by Eq 1.
(%)= Co-CeCox100(1)
where, 𝐶𝑜 Initial dye concentration (mg/L) and 𝐶𝑒 equilibrium dye concentration (mg/L).
The adsorption amounts at a time (qt) and at equilibrium (qe) are determined via Eqs (2) and (3)
qt=(Co-Ct)Vm(2)
qe=(Co-Ce)Vm(3)
where, V is volume of dye solution (L), m is mass of adsorbent (g), qe is the equilibrium adsorption capacity (mg/g) and qt is the adsorption capacity over time (mg/g) . The effects of pH, initial MO concentration, contact time, and adsorbent dose on the adsorption of MO onto acid activated biochar were studied and optimized.
2.6. Data Analysis
2.6.1. Isotherm Studies
In this study, Langmuir and Freundlich isothermal adsorption models were applied to describe the distribution of adsorbate between the liquid and solid phase. Langmuir model is an ideal model for monolayer adsorption, supposing that the adsorption sites distributed on adsorbent surface uniformly . The Freundlich isothermal model is used to describe the multilayer adsorption, assuming that the distribution of active adsorption sites on the adsorbent surface is heterogeneous. The liner equation of the Langmuir and Freundlich models are expressed via Eqs 4 and 5.
lnCeqe=1qmKe+ Ceqm(4)
logqe=logKF+1/nlogCe(5)
where, 𝑞𝑚 (mg/g) denote the maximum adsorption capacity, qe is the amount of sorbate sorbed at equilibrium (mg/g), 𝐶𝑒 equilibrium dye concentration (mg/L), KF is the adsorption coefficient (L/mg); n is the coefficient of the Freundlich model. Generally, when 0 < 1/n < 1, the adsorption process is spontaneous; when 1/n=1, Freundlich isotherm model is linear, indicating the adsorption process is irreversible; when 1/n > 1, the adsorption process is relatively hard to proceed .
2.6.2. Kinetic Studies
It is important to investigate the adsorption rate and the required time for adsorption to reach equilibrium. In order to understand and research the adsorption mechanism, many empirical models can be used to simulate the kinetics of the solid-liquid interface adsorption. In the context, pseudo first order (PFO) and pseudo second order (PSO) kinetic model were applied to simulate the adsorption kinetics of MO on to acid activated biochar from avocado pomace. PFO kinetic model assumes that the occupying rate of adsorbates onto adsorption sites is proportional to the quantity of the unoccupied sites. The linear form of the kinetic rate expression for PFO and PSO model are given by Eqs 6 and 7.
 log(qe-qt)=logqe-k12.303t(6)
tqt=1k2qe2+tqe(7)
where qe is the amount of dye adsorbed at equilibrium (mg/g), qt is the number of dyes adsorbed at time t (mg/g), k1 is the PFO rate constant (min-1), t is time (min) and k2 represents the rate constant of PSO (g/mg/min).. The straight-line plot of log (qe-qt) against time t, should give a linear relationship from which the PFO rate constant (k1) and equilibrium sorption capacity (qe), can be calculated from the slope and intercept respectively.
3. Results and Discussion
3.1. Optimization of Adsorbent
Temperature optimization experiments were performed to select adsorbent with better sorption capacity. Approximately 10 g of 50% H3PO4 soaked samples were placed in a ceramic crucible and in the carbonization furnace for 2 h. The reaction took place at 400, 500 and 600 °C final temperature. The highest removal efficiency of MO dye occurred for sample prepared at 500 °C (93.34%); due to its porosity and high surface area (Figure 2). The lowest MO dye removal efficiency (62.50%) was observed at 400°C. Therefore, 500°C was the optimal temperature for further adsorbent preparation and termed as acid activated biochar.
3.2. Characterization of Acid Activated Biochar
3.2.1. Physicochemical Characteristics
The physicochemical properties of acid activated biochar were determined by standard method and presented in Table 1. The results showed that prepared acid activated biochar have very high fixed carbon content, low moisture content, low ash content and very low volatile matter. This is due to during carbonization and activation processes, organic substances become unstable as a result of the heat causing the molecules to break their bonds and linkages. Volatile matter is also released as a gas and a liquid which evaporates off leaving material with high carbon content . The high composition of the fixed carbon refers to high quality of the adsorbent which improves the surface area and adsorption performance. From the result the low ash content in the biochar indicates inorganic matter in the sample is insignificant. According to different scholar findings high fixed carbon, low moisture, low volatile matter and low ash content adsorbents are recommendable for adsorption activities .
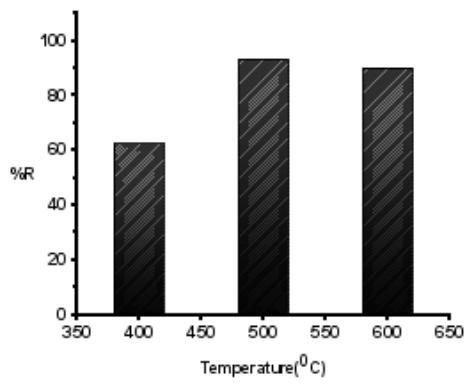
Figure 2. Removal efficiency of acid activated biochar prepared at different temperature.
Table 1. Result for proximate analysis of the acid activated biochar.

Parameters

Mass in percent (%)

Moisture content

10.40 ± 0.45

Ash content

12.95 ± 0.35

Volatile matter

5.50 ± 0.62

Fixed carbon

71.15 ± 0.84

The pH of prepared biochar was 4.7 ± 0.85. The surface area of the prepared acid treated biochar analysis was determined by Sear method. Based on this result the prepared adsorbent has very high surface area (391 m2/g), it was raised from H3PO4 activation. Upon high concentration H3PO4 activation, leads to reorganization of the chemical constituents and subsequent deposition of carbon rich molecules to the voids of biomass by the influence of temperature and pressure .
The PZC is defined as the condition in which the density of electric charge on the adsorbent surface is zero. In this study, the solid addition method was followed. Accordingly, 0.1 M of NaCl solution poured into 12 flasks each containing 0.1 g of adsorbent. The pH of the solutions was measured from 2 to 12 by using a pH meter and kept for 24 h. The results were then plotted between “∆pH final versus pH initial”. The point of intersection of the curves of “∆pH final versus pH initial” is the PZC of adsorbent. The plot of ∆pH final versus pH initial for adsorbents is presented in Figure 3. It was found to be 7.4. When the pH of the solution is below the PZC, the surface of the adsorbent will become positively charged and when the solution pH is greater than PZC, the surface of the adsorbent will become negatively charged. It implied that the prepared adsorbent was most probably adsorbing dye in acidic regions .
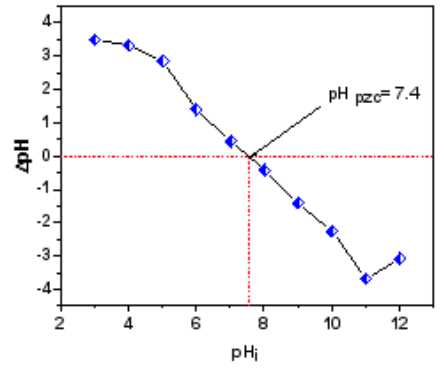
Figure 3. Determination of pHPZC for acid activated biochar.
3.2.2. FTIR Analysis
Fourier Transform Infrared Spectroscopy (FTIR) is the machine, which uses infrared, light to vibrate or rotate bond molecule to detect the functional group presence in the sample. FTIR spectrum was associated with the functional groups that were existed on the surface of acid activated biochar in the range 4000 – 500 cm-1 shown in Figure 4.
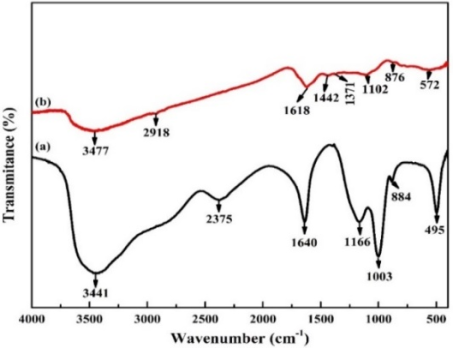
Figure 4. FTIR spectra of acid activated bichar before and after adsorption for MO dye.
FTIR spectrum of before (red) and after adsorption (black) showed a strong peak shift of OH stretch from wavenumber 3477 to 3441 cm-1 . Peak position 2918 cm-1 was assigned to C-H stretching of single bond, which peak shifted to 2375 cm-1 after the loading of MO dye. Peaks at 1640 cm-1 after MO dye adsorption was C=C for aliphatic unsaturated ion. Peak corresponds at 1166 cm-1 was characteristics of C-O stretching vibration of alcohols and phenols. FTIR spectrum of before adsorption showed additional peak at 1442 cm-1 and 1371 cm-1 for aromatic ring and C-N stretching, respectively. The shift of peaks and band width difference before and after adsorption tends to show the participation of functional groups of adsorbent surfaces on adsorption of MO and a suitable site for dye binding. The results confirm that there was deformation (bending and stretching) of bond molecule during interaction of MO dye ions with organic compound in the sample.
3.2.3. XRD Analysis
X-ray diffraction (XRD) studies are used for determining crystal and amorphous structures. The broad band or broad spectrum at 2θ 10-30 was due to the amorphous structure of the adsorbent . The presence of an amorphous phase within the acid activated biochar results an irregular base line with noise and pulsed shape. The analyzed structure and phase of acid activated biochar was performed and presented in Figure 5.
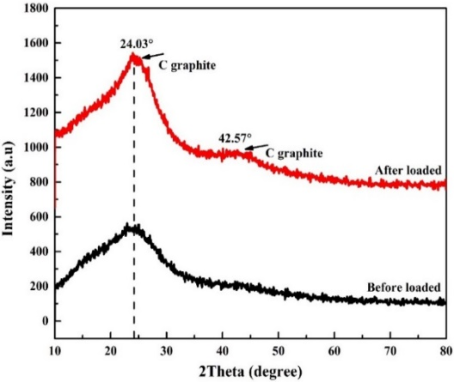
Figure 5. XRD pattern of acid activated biochar (Black) before and (Red) after adsorption of MO dye.
3.2.4. SEM Analysis
Characterization of scanning electron microscopy (SEM) is widely used to study and provides information on size and morphology. As seen from the SEM images of before adsorption (Figure 6A), more porous and irregular shapes were observed. The structures signify the presence of macrospores and which was responsible for high surface area for acid activated biochar. On the other hand, porosity was decreased after adsorption (Figure 6B) toward smooth a surface as the MO dye molecules were mounted over the pores cavity of adsorbent . Therefore the surface area and pore volume have significant effect on enhancing adsorption efficiency of pollutants .
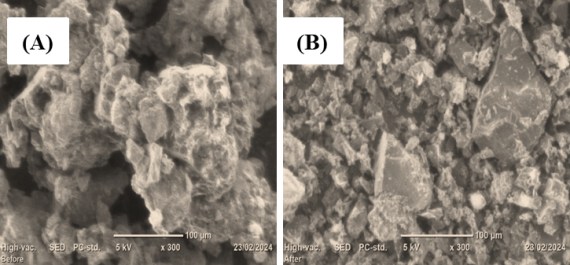
Figure 6. SEM image of acid activated biochar before (A) and after (B) loading of MO dye molecules.
3.3. Effects of Solution pH
The effect of pH on the MO removal was studied in the pH range from 1 to 10. The removal efficiency of MO dye was increase from 80% to 99% as pH increased from pH 2 to 5 Figure 7. As such, the optimum solution pH for this finding was 5. This was occurred due to MO adsorption onto acid activated biochar via complex interplay of electrostatic and dispersion interactions with possible mechanisms namely, (i) π-π dispersion interaction between phenolic groups on the adsorbent with the aromatic rings in MO molecules. (ii) Electron donor–acceptor complex formation at the carbon surface. Although in adsorption process, electrostatic attraction exists between sulphonate and adsorbent surface plays a very significant role, the oxygen of the surface carbonyl group acts as the electron donor and the MO aromatic ring as the acceptor. This can lead to strong binding between the dye molecules and the adsorbent surface. Further increase in pH results in deprotonation of positively charged functional groups causing it to become negatively charged. At this point, electrostatic repulsion between the negatively charged surface and the negatively charged MO molecules could reduce adsorption efficiency .
3.4. Effect of Initial MO Concentration
The effect of the initial concentration of MO dye was investigated by varying the concentration of dye ion from 20 to 100 mg/L. As shown in Figure 8, maximum removal efficiencies (98.8%) was obtained at a lower initial concentration (20 mg/L) due to the vacant active sites on the adsorbing surface. When the initial concentration of dye increases, the active sites necessary for the adsorption of dye molecules get occupied at 60 mg/L, where saturation of the active sites is achieved . The optimal initial MO dye concentration was 60 mg/L. The decreasing removal efficiencies at high concentration was due to the limited number of active sites on the surface of adsorbent to accommodate higher concentration ions . Generally, there were unoccupied binding sites on the adsorbent surface at a low concentration, and insufficient sites at higher concentration, thus decreasing the dye removal efficiency. On the contrary the adsorption capacity was increased with an increase of initial concentration of dye molecules due to the availability of a higher number of dye ions per unit mass of the adsorbents and also increase in the initial concentration of the dye enhances the interaction between the dye molecules and the surface of the adsorbent .
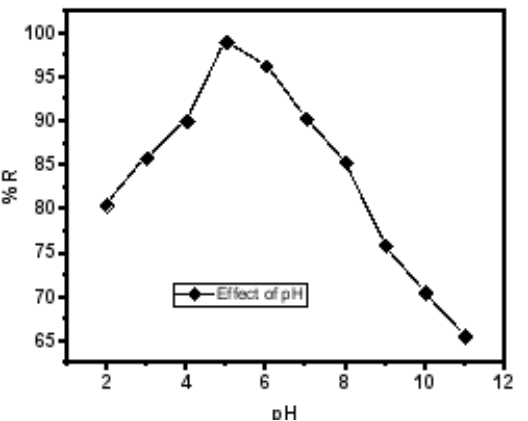
Figure 7. Effect of solution pH on MO adsorption by acid activated biochar, mass of adsorbent 0.1 g, initial concentration 20 mg/L and contact time 2 h.
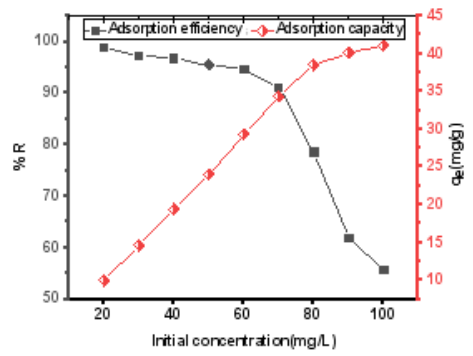
Figure 8. Effect of initial concentration for removal of MO at solution pH 5, mass of adsorbent 0.1 g and contact time 2 h.
An Adsorption isotherms are mathematical models used to clearly describe the distribution of adsorbate species among liquid and adsorbent . Using the assumptions mainly related to the heterogeneity or homogeneity of adsorbents, there are types of coverage and possibility of interaction between adsorbate species. In this study, the correlation coefficients (R2) of Langmuir model (R2=0.9941) (Figure 9A) was higher than the R2 values of Freundlich model (R2=0.9384) (Figure 9B) . This result indicated that the Langmuir model more fitted to experimental data (Table 2) and hence adsorption was mainly chemisorption; lead to the formation monolayer on the homogenous active site on the adsorbent surface .
Moreover, the Langmuir isotherm model which is described in terms of the dimensionless constant called separation factor or equilibrium parameter (RL), is used to predict the nature of the adsorption process which obtained using the relation in Eq 8. The adsorption process is irreversible if RL = 0, favorable if 0 < RL < 1, linear if RL = 1, and unfavorable if RL > 1.
RL=11+KLCo(8)
where Co is the initial MO concentration (mg/L) and KL is the Langmuir constant (L/mg) .
In this study, average values of RL was 0.010182 indicate verifying favorability of adsorption .
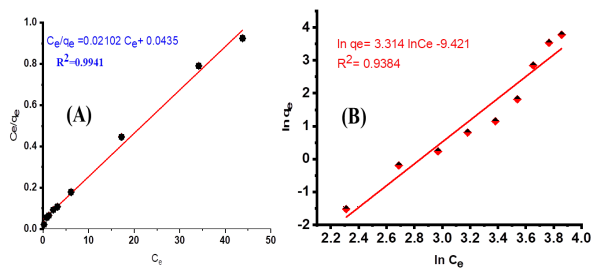
Figure 9. Langmuir (A) and Freundlich (B) linear isotherm model of adsorption of MO dye.
Table 2. Adsorption isotherm parameters and constants for Langmuir and Freundlich models.

Parameters

Isotherm models

Langmuir

Freundlich

qm (mg/g)

22.988

-

b (L/mg)

2.069

-

RL

0.010182

-

KF ((mg1−1/n L1/n)/g)

-

0.001

N

-

0.3075

R2

0.9941

0.9384

3.5. Effect of Contact Time
The effect of contact time was determined by varying the time from 5 to 210 min. As shown in Figure 10, the rapid rate of MO dye ion uptake and reach 98.7% during the first 45 min. The amount of adsorbed dyes was rapidly increased, and then gradually increase until equilibrium was reached at optimal time near to 120 min. This was perhaps due to the most readily availability of sufficient number of active sites which gets saturated with time . Thus 120 min was saturation time (Figure 10) a t which the adsorbent attained maximum percentage removal of MO dye . Beyond 120 min, equilibrium was established. This might be due to the concentration of adsorbate in the pores and concentration of adsorbate in the bulk was dynamic state of equilibrium. Therefore, the contact time of 120 min was selected for further studies for MO dye adsorption.
The study of adsorption kinetics is very important to determine how quickly or slowly the reaction is proceeding . The fast adsorption at the initial stage can be associated with the presence of vacant active sites initially, which are responsible for the rapid adsorption of MO dye on the adsorbent’s surfaces. When equilibrium is achieved, the amount of MO dye migrates from the solution to the adsorbent and amount of MO dye desorbed from the surface of the adsorbent to the solution were in the state of dynamic equilibrium. The time required to attain this equilibrium process is termed as equilibrium time and the amount of MO dye adsorbed on the adsorbent at this time implies equilibrium adsorption capacity.
The linear forms of the PFO and PSO were applied to the experimental data to assess the adsorption kinetics as seen Figure 11. Since the correlation coefficient value of PFO kinetics was low (R2=0.9280) (Figure 11A) compared to PSO kinetic (R2=0.9997) (Figure 11B). The highest R2 values indicating that most satisfactory for describing the adsorption kinetics . Therefore, based on the R2 value it can be concluded that, PSO kinetic model predicted as well suited for the whole adsorption process and the reaction was appears to be controlled by the chemical reaction adsorbate and adsorbent species . Moreover, the experimental number of adsorbed MO dyes per unit mass of adsorbent at equilibrium and theoretical value of adsorbed MO dyes per unit mass of adsorbent at equilibrium were calculated based on PSO model have showed good agreement as compare to PFO Table 3.
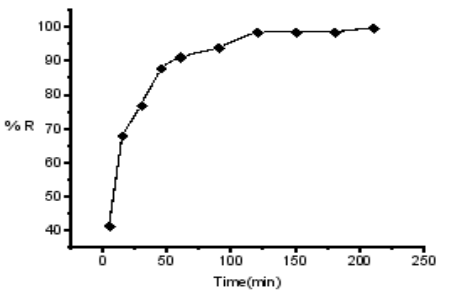
Figure 10. Effect of contact time for the removal of MO at mass of adsorbent 0.1 g, pH 5, and initial concentration 20 mg/L.
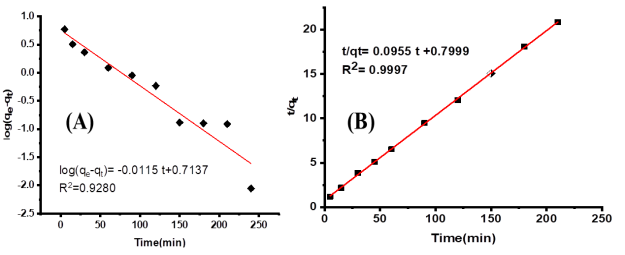
Figure 11. Linear plot for adsorption of PFO (A) and PSO (B) kinetics.
Table 3. Parameters of the PFO and PSO kinetic models for MO dye removal.

Parameters

Kinetic models

PFO

PSO

Co (mg/L)

20

40

qe,exp (mg/g)

10.06

10.06

qe,cal (mg/g)

5.2

10.47

k1 (min-1)

0.0115

-

k2 (g/(mg.min))

-

0.0955

R2

0.9280

0.9997

3.6. Effect of Adsorbent Dose
The effect of adsorbent mass on the MO dye removal efficiency was determined with 0.1 to 0.8 g of adsorbent. As shown in Figure 12, the MO dye removal efficiency increased linearly from 86% to 97% as adsorbent mass increases from 0.1 to 0.5 g. This behavior could be explained considering that with adsorbent mass increase, more active sites were available to bind MO dye from aqueous phase . The result after 0.5 g (Figure 12), the amount of adsorbed MO dye was slowly increases up to 0.7 g. Then beyond 0.7, the removal efficiency was observed to be constant, (i.e. no more adsorption takes place). This was due to the aggregation and overlapping of particles of adsorbent in the solution . As a result, 0.5 g was selected as, the optimum dose for the subsequent experiments.
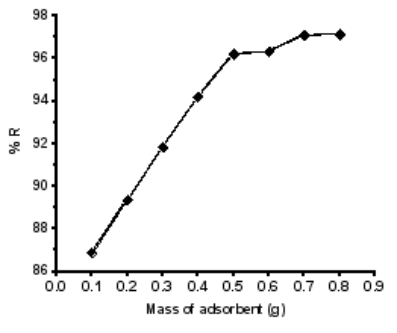
Figure 12. Effect of amount of adsorbent for at contact time 2 h, pH 5 and initial concentration 20 mg/ L.
3.7. Adsorption Mechanism
The adsorption of MO dye from aqueous solution by acid activated biochar derived from avocado pomace was strongly dependent on the various functional groups on the surface of adsorbent such as hydroxyl, phenols, aromatics and etc. those were supported by FTIR spectral described results. The probable adsorption mechanisms between the surface functional groups of adsorbent and MO dye can be assigned to the various interactions such as electrostatic attractions, hydrogen bonding interaction and π–π interactions between the adsorbent and adsorbate . The MO dye adsorption onto acid activated biochar aligns more closely with the Langmuir isotherm model than with the Freundlich model, indicating monolayer chemosorption on its surface. Similarly, the PSO model was more suitable than the PFO model, indicating the chemisorption of MO dye onto the adsorbents. Thus, the adsorption of MO dye onto acid activated biochar occurs through chemisorption mechanism.
3.8. Reliability and Validity of the Work
In order to determine the accuracy of the data collected, all batch tests were carried out by triplicated and only mean values were reported. Blank tests were carried out at the same time. All polyethylene plastic and laboratory items were washed with detergent, followed by repeated rinse with distilled water and soaked overnight in 10% HNO3, then rinsed three times with distilled water and dried. Experimental analyses were carried out using MO containing a working solution. Regressions of experimental data were performed using Origin 19.0 software. The correlation coefficient R2 of parameters were determined to characterize the accuracy of the optimal analysis of the data fit.
4. Conclusion
In this study, acid activated biochar was prepared from pomace of avocado oiling industry at optimal temperature of 500 °C with 93.34% removal efficiency. The adsorbent was tested and evaluated for removal of MO dye from model wastewater through batch adsorption experiment. In this regard, the optimum values for removal of MO dye have been obtained as the pH of solution, adsorbent dose, contact time and initial MO concentration value pH 5, 0.5 g, 120 min and 60 mg/L respectively. The surface area of adsorbent was 391 m2/g. The results of physicochemical properties of adsorbent were showed that the prepared adsorbent has very high fixed carbon content 71.15 ± 0.84%, low moisture content 10.4 ± 0.45%, low ash content 12.95 ± 0.35% and very low 5.5 ± 0.62% volatile matter content. The high composition of the fixed carbon refers to high quality of the adsorbent which improves the surface area and adsorption performance.
The peaks position was shifted and changed in intensity after adsorption of MO dye in the FTIR spectra analysis. This indicates that most of the functional groups were participated on adsorption process and demonstrate the availability of suitable adsorption sites. The adsorption isotherm data were well fitted to Langmuir model (R2=0.9941) than Freundlich model (R2=0.9384). This result addressed the process leads to monolayer formation with maximum adsorption capacity 22.988 mg/g. The experimental and theoretical kinetics data showed good agreement for the PSO kinetic model (R2=0.9997) than PFO models (R2=0.9280), which indicates chemisorption mechanisms. Thus, the avocado pomace based acid activated biochar is an effective, low cost, and locally available alternative for remediation of MO dye from aqueous solutions.
Abbreviations

FTIR

Fourier Transform Infrared Spectroscopy

MO

Methyl Orange

PFO

Pseudo First Order

PSO

Pseudo Second Order

PZO

Point of Zero Charge

SEM

Scanning Electron Microscope

UV-Vis

Ultra Violet-Visible

XRD

X-Ray Diffraction

Acknowledgments
The authors would like to thank the Department of Chemistry, Jimma University, Ethiopia, for providing access to laboratory facilities.
Author Contributions
Zeleke Zewde Babanto: Writing – review & editing, Writing – original draft, Formal analysis, Software, Resources, Conceptualization, Methodology, Data curation, Validation, Visualization
Guta Gonfa: Supervision, Formal analysis, Conceptualization, Methodology
Jafer Esmael: Investigation, Formal analysis, Methodology
Data Availability Statement
Data will be made available on request.
Conflicts of Interest
The authors declare no conflicts of interest.
References
[1] Dimpe KM, Ngila JC, Nomngongo PN. Application of Waste Tyre-Based Activated Carbon for the Removal of Heavy Metals in Wastewater. Cogent Engineering 2017; 4: 1330912.
[2] Balarak D, Pirdadeh F, Mahdavi Y. Biosorption of Acid Red 88 Dyes Using Dried Lemna Minor Biomass. Journal of Science, Technology & Environment Informatics 2015; 1: 81-90.
[3] Desta MB. Batch Sorption Experiments: Langmuir and Freundlich Isotherm Studies for the Adsorption of Textile Metal Ions onto Teff Straw (Eragrostis Tef) Agricultural Waste. Journal of thermodynamics 2013; 2013: 375830.
[4] Tegegn F. Physico-Chemical Pollution Pattern along Akaki River Basin, Addis Ababa, Ethiopia. 2012.
[5] Abrehet Kahsay Mehari AKM, Shewit Gebremedhin SG, Belayneh Ayele BA. Effects of Bahir Dar Textile Factory Effluents on the Water Quality of the Head Waters of Blue Nile River, Ethiopia. 2016.
[6] Iwuozor KO, Ighalo JO, Emenike EC, Ogunfowora LA, Igwegbe CA. Adsorption of Methyl Orange: A Review on Adsorbent Performance. Current Research in Green and Sustainable Chemistry 2021; 4: 100179.
[7] Samarghandi MR, Azizian S, Siboni MS, Jafari SJ, Rahimi S. Removal of Acid Black 1 by Pumice Stone as a Low Cost Adsorbent: Kinetic and Equilibrium Study. Iranian Journal of Environmental Health Science and Engineering 2011; 8: 167-174.
[8] Leong YK, Chang JS. Bioremediation of Heavy Metals Using Microalgae: Recent Advances and Mechanisms. Bioresource technology 2020; 303: 122886.
[9] Permal R, Chang WL, Seale B, Hamid N, Kam R. Converting Industrial Organic Waste from the Cold-Pressed Avocado Oil Production Line into a Potential Food Preservative. Food chemistry 2020; 306: 125635.
[10] Rahman MA, Amin SR, Alam AS. Removal of Methylene Blue from Waste Water Using Activated Carbon Prepared from Rice Husk. Dhaka University Journal of Science 2012; 60: 185-189.
[11] Bai YN, Wang XN, Zhang F, Wu J, Zhang W, Lu YZ, Fu L, Lau TC, Zeng RJ. High-Rate Anaerobic Decolorization of Methyl Orange from Synthetic Azo Dye Wastewater in a Methane-Based Hollow Fiber Membrane Bioreactor. Journal of hazardous materials 2020; 388: 121753.
[12] Koçer AT, Mutlu B, Özçimen D. Investigation of Biochar Production Potential and Pyrolysis Kinetics Characteristics of Microalgal Biomass. Biomass Conversion and Biorefinery 2020; 10: 85-94.
[13] Mussatto SI, Fernandes M, Rocha GJ, Órfão JJ, Teixeira JA, Roberto IC. Production, Characterization and Application of Activated Carbon from Brewer’s Spent Grain Lignin. Bioresource technology 2010; 101: 2450-2457.
[14] Bello OS, Adegoke KA, Akinyunni OO. Preparation and Characterization of a Novel Adsorbent from Moringa Oleifera Leaf. Applied Water Science 2017; 7: 1295-1305.
[15] Ahmad F, Daud WMAW, Ahmad MA, Radzi R. The Effects of Acid Leaching on Porosity and Surface Functional Groups of Cocoa (Theobroma Cacao)-Shell Based Activated Carbon. Chemical Engineering Research and Design 2013; 91: 1028-1038.
[16] Bello OS, Ahmad MA. Coconut (Cocos Nucifera) Shell Based Activated Carbon for the Removal of Malachite Green Dye from Aqueous Solutions. Separation Science and Technology 2012; 47: 903-912.
[17] Chaouch N, Khelfaoui A. Defluoridation of Groundwater in the South East of Algeria by Adsorption. Mater Biomater Sci 2019; 2: 014-017.
[18] Zewde Z, Asere TG, Yitbarek M. Porous Biochars Derived from Brewery Waste for the Treatment of Cr (VI)-Contaminated Water. PloS one 2024; 19:e0314522.
[19] Xu P, Zeng GM, Huang DL, Lai C, Zhao MH, Wei Z, Li NJ, Huang C, Xie GX. Adsorption of Pb (II) by Iron Oxide Nanoparticles Immobilized Phanerochaete Chrysosporium: Equilibrium, Kinetic, Thermodynamic and Mechanisms Analysis. Chemical Engineering Journal 2012; 203: 423-431.
[20] Abramian L, El-Rassy H. Adsorption Kinetics and Thermodynamics of Azo-Dye Orange II onto Highly Porous Titania Aerogel. Chemical Engineering Journal 2009; 150: 403-410.
[21] Ghosal PS, Gupta AK. Determination of Thermodynamic Parameters from Langmuir Isotherm Constant-Revisited. Journal of Molecular Liquids 2017; 225: 137-146.
[22] Chen Y, Zhang D. Adsorption Kinetics, Isotherm and Thermodynamics Studies of Flavones from Vaccinium Bracteatum Thunb Leaves on NKA-2 Resin. Chemical Engineering Journal 2014; 254: 579-585.
[23] Fito J, Said H, Feleke S, Worku A. Fluoride Removal from Aqueous Solution onto Activated Carbon of Catha Edulis through the Adsorption Treatment Technology. Environmental Systems Research 2019; 8: 1-10.
[24] Mopoung S, Moonsri P, Palas W, Khumpai S. Characterization and Properties of Activated Carbon Prepared from Tamarind Seeds by KOH Activation for Fe (III) Adsorption from Aqueous Solution. The scientific world journal 2015; 2015: 415961.
[25] Deng H, Lu J, Li G, Zhang G, Wang X. Adsorption of Methylene Blue on Adsorbent Materials Produced from Cotton Stalk. Chemical engineering journal 2011; 172: 326-334.
[26] Islam MA, Benhouria A, Asif M, Hameed BH. Methylene Blue Adsorption on Factory-Rejected Tea Activated Carbon Prepared by Conjunction of Hydrothermal Carbonization and Sodium Hydroxide Activation Processes. Journal of the Taiwan Institute of Chemical Engineers 2015; 52: 57-64.
[27] Temesgen F, Gabbiye N, Sahu O. Biosorption of Reactive Red Dye (RRD) on Activated Surface of Banana and Orange Peels: Economical Alternative for Textile Effluent. Surfaces and interfaces 2018; 12: 151-159.
[28] Ahmad MA, Afandi NS, Bello OS. Optimization of Process Variables by Response Surface Methodology for Malachite Green Dye Removal Using Lime Peel Activated Carbon. Applied Water Science 2017; 7: 717-727.
[29] Liang Q, Ye L, Huang ZH, Xu Q, Bai Y, Kang F, Yang QH. A Honeycomb-like Porous Carbon Derived from Pomelo Peel for Use in High-Performance Supercapacitors. Nanoscale 2014; 6: 13831-13837.
[30] Laskar N, Kumar U. SEM, FTIR and EDAX Studies for the Removal of Safranin Dye from Water Bodies Using Modified Biomaterial-Bambusa Tulda. In IOP Conference Series: Materials Science and Engineering; IOP Publishing, 2017; 225: p 012105.
[31] Hosseini SS, Hamadi A, Foroutan R, Peighambardoust SJ, Ramavandi B. Decontamination of Cd2+ and Pb2+ from Aqueous Solution Using a Magnetic Nanocomposite of Eggshell/Starch/Fe3O4. Journal of Water Process Engineering 2022; 48: 102911.
[32] Samarghandi M, Zarrabi M, Sepehr M, Amrane A, Safari G, Bashiri S. Application of Acidic Treated Pumice as an Adsorbent for the Removal of Azo Dye from Aqueous Solutions: Kinetic, Equilibrium and Thermodynamic Studies. 2013.
[33] Kiran S, Nosheen S, Abrar S, Anjum F, Gulzar T, Naz S. Advanced Approaches for Remediation of Textile Wastewater: A Comparative Study. Advanced Functional Textiles and Polymers: Fabrication, Processing and Applications 2019; 201-264.
[34] Zarei M, Pezhhanfar S, Ahmadi Someh A. Removal of Acid Red 88 from Wastewater by Adsorption on Agrobased Waste Material. A Case Study of Iranian Golden Sesamum Indicum Hull. Environmental Health Engineering and Management Journal 2017; 4: 195-201.
[35] Tang Y, He T, Liu Y, Zhou B, Yang R, Zhu L. Sorption Behavior of Methylene Blue and Rhodamine B Mixed Dyes onto Chitosan Graft Poly (Acrylic Acid-co-2-acrylamide-2-methyl Propane Sulfonic Acid) Hydrogel. Advances in Polymer Technology 2018; 37: 2568-2578.
[36] Seow TW, Lim CK. Removal of Dye by Adsorption: A Review. International Journal of Applied Engineering Research 2016; 11: 2675-2679.
[37] Mondal NK, Kar S. Potentiality of Banana Peel for Removal of Congo Red Dye from Aqueous Solution: Isotherm, Kinetics and Thermodynamics Studies. Applied Water Science 2018; 8: 1-12.
[38] Boulaiche W, Hamdi B, Trari M. Removal of Heavy Metals by Chitin: Equilibrium, Kinetic and Thermodynamic Studies. Applied Water Science 2019; 9: 1-10.
[39] Berger AH, Bhown AS. Comparing Physisorption and Chemisorption Solid Sorbents for Use Separating CO2 from Flue Gas Using Temperature Swing Adsorption. Energy Procedia 2011; 4: 562-567.
[40] Ho YS, McKay G. Pseudo-Second Order Model for Sorption Processes. Process biochemistry 1999; 34: 451-465.
[41] Mamo DW, Asere, TG, Habtemariam TH. Adsorptive Removal of Cr (VI) from Aqueous Solution Using Activated Carbon of Enset Root (Ensete Ventricosum). Desalination and Water Treatment 2025; 321: 101053.
[42] Mathew M, Desmond RD, Caxton M. Removal of Methylene Blue from Aqueous Solutions Using Biochar Prepared from Eichhorrnia Crassipes (Water Hyacinth)-Molasses Composite: Kinetic and Equilibrium Studies. African Journal of Pure and Applied Chemistry 2016; 10: 63-72.
[43] Razi MAM, Hishammudin MNAM, Hamdan R. Factor Affecting Textile Dye Removal Using Adsorbent from Activated Carbon: A Review. In MATEC Web of Conferences; EDP Sciences, 2017; 103: p 06015.
[44] Abdurrahman FB, Akter M, Abedin MZ. Dyes Removal from Textile Wastewater Using Orange Peels. Int J Sci Technol Res 2013; 2: 47-50.
[45] Yadav O. Research Article Removal of Phenol Red Dye from Contaminated Water Using Barley (Hordeum Vulgare L.) Husk-Derived Activated Carbon Nigussie Alebachew Department of Chemistry, Haramaya University, PO Box 138, Dire Dawa, Ethiopia. Sci. Int 2017; 5.
[46] Ai L, Zhang C, Liao F, Wang Y, Li M, Meng L, Jiang J. Removal of Methylene Blue from Aqueous Solution with Magnetite Loaded Multi-Wall Carbon Nanotube: Kinetic, Isotherm and Mechanism Analysis. Journal of hazardous materials 2011; 198: 282-290.
[47] El-Bindary AA, El-Sonbati AZ, Shoair AF, Mohamed AS. Adsorptive Removal of Hazardous Azorhodanine Dye from an Aqueous Solution Using Rice Straw Fly Ash. J. Mater. Environ. Sci 2015; 6: 1723-1732.
[48] Worku A, Sahu O. Removal of Reactive Dye from Aqueous Solution Using Physico-Chemically Treated Rice Husk. Journal of Environmental Treatment Techniques 2014; 2: 77-84.
[49] Jawad AH, Razuan R, Appaturi JN, Wilson LD. Adsorption and Mechanism Study for Methylene Blue Dye Removal with Carbonized Watermelon (Citrullus Lanatus) Rind Prepared via One-Step Liquid Phase H2SO4 Activation. Surfaces and Interfaces 2019; 16: 76-84.
[50] Chowdhury S, Mishra R, Saha P, Kushwaha P. Adsorption Thermodynamics, Kinetics and Isosteric Heat of Adsorption of Malachite Green onto Chemically Modified Rice Husk. Desalination 2011; 265: 159-168.
Cite This Article
  • APA Style

    Babanto, Z. Z., Esmael, J., Gonfa, G. (2025). Acid Activated Biochar Prepared from Avocado Pomace for Remediation of Methyl Orange Contaminated Aqueous Solution. American Journal of Applied and Industrial Chemistry, 9(1), 1-12. https://doi.org/10.11648/j.ajaic.20250901.11

    Copy | Download

    ACS Style

    Babanto, Z. Z.; Esmael, J.; Gonfa, G. Acid Activated Biochar Prepared from Avocado Pomace for Remediation of Methyl Orange Contaminated Aqueous Solution. Am. J. Appl. Ind. Chem. 2025, 9(1), 1-12. doi: 10.11648/j.ajaic.20250901.11

    Copy | Download

    AMA Style

    Babanto ZZ, Esmael J, Gonfa G. Acid Activated Biochar Prepared from Avocado Pomace for Remediation of Methyl Orange Contaminated Aqueous Solution. Am J Appl Ind Chem. 2025;9(1):1-12. doi: 10.11648/j.ajaic.20250901.11

    Copy | Download

  • @article{10.11648/j.ajaic.20250901.11,
      author = {Zeleke Zewde Babanto and Jafer Esmael and Guta Gonfa},
      title = {Acid Activated Biochar Prepared from Avocado Pomace for Remediation of Methyl Orange Contaminated Aqueous Solution
    },
      journal = {American Journal of Applied and Industrial Chemistry},
      volume = {9},
      number = {1},
      pages = {1-12},
      doi = {10.11648/j.ajaic.20250901.11},
      url = {https://doi.org/10.11648/j.ajaic.20250901.11},
      eprint = {https://article.sciencepublishinggroup.com/pdf/10.11648.j.ajaic.20250901.11},
      abstract = {This study focused on the remediation of methyl orange (MO) from wastewater by preparation of acid activated biochar from avocado pomace, which was obtained from Jimma Industrial Park, Ethiopia. This avocado pomace was considered as a solid waste and accumulated on waste disposal areas of the industrial park.  The optimal temperature of 500 °C was selected for further biochar preparation. Physicochemical properties of the biochar have fixed carbon content (71.15 ± 0.84%), ash content (12.95 ± 0.35%), moisture content (10.40 ± 0.45%), volatile matter content (5.50 ± 0.62%) as well as PZC (7.4 ± 0.85). The acid activated biochar at optimum temperature of before and after adsorption was characterized via FTIR, XRD, and SEM. The main parameters of solution pH (5), initial concentration (60 mg/L), mass of adsorbent (0.5 g), and contact time (120 min) were optimized. Langmuir model was more fitted to experimental data and adsorption mechanism was chemisorption; leads to the formation monolayer on the homogenous active site with maximum adsorption capacity 22.988 mg/g. The adsorption phenomena were consistent with PSO kinetics model (R2=0.9997) and adsorption mechanism was chemisorption. Thus, this low cost environmental friendly industrial waste effectively removes MO dye and solves the problem of industrial wastewater through adsorption. More research finding is recommended to study how well this adsorbent works in real wastewater samples.
    },
     year = {2025}
    }
    

    Copy | Download

  • TY  - JOUR
    T1  - Acid Activated Biochar Prepared from Avocado Pomace for Remediation of Methyl Orange Contaminated Aqueous Solution
    
    AU  - Zeleke Zewde Babanto
    AU  - Jafer Esmael
    AU  - Guta Gonfa
    Y1  - 2025/06/30
    PY  - 2025
    N1  - https://doi.org/10.11648/j.ajaic.20250901.11
    DO  - 10.11648/j.ajaic.20250901.11
    T2  - American Journal of Applied and Industrial Chemistry
    JF  - American Journal of Applied and Industrial Chemistry
    JO  - American Journal of Applied and Industrial Chemistry
    SP  - 1
    EP  - 12
    PB  - Science Publishing Group
    SN  - 2994-7294
    UR  - https://doi.org/10.11648/j.ajaic.20250901.11
    AB  - This study focused on the remediation of methyl orange (MO) from wastewater by preparation of acid activated biochar from avocado pomace, which was obtained from Jimma Industrial Park, Ethiopia. This avocado pomace was considered as a solid waste and accumulated on waste disposal areas of the industrial park.  The optimal temperature of 500 °C was selected for further biochar preparation. Physicochemical properties of the biochar have fixed carbon content (71.15 ± 0.84%), ash content (12.95 ± 0.35%), moisture content (10.40 ± 0.45%), volatile matter content (5.50 ± 0.62%) as well as PZC (7.4 ± 0.85). The acid activated biochar at optimum temperature of before and after adsorption was characterized via FTIR, XRD, and SEM. The main parameters of solution pH (5), initial concentration (60 mg/L), mass of adsorbent (0.5 g), and contact time (120 min) were optimized. Langmuir model was more fitted to experimental data and adsorption mechanism was chemisorption; leads to the formation monolayer on the homogenous active site with maximum adsorption capacity 22.988 mg/g. The adsorption phenomena were consistent with PSO kinetics model (R2=0.9997) and adsorption mechanism was chemisorption. Thus, this low cost environmental friendly industrial waste effectively removes MO dye and solves the problem of industrial wastewater through adsorption. More research finding is recommended to study how well this adsorbent works in real wastewater samples.
    
    VL  - 9
    IS  - 1
    ER  - 

    Copy | Download

Author Information
  • Abstract
  • Keywords
  • Document Sections

    1. 1. Introduction
    2. 2. Materials and Methods
    3. 3. Results and Discussion
    4. 4. Conclusion
    Show Full Outline
  • Abbreviations
  • Acknowledgments
  • Data Availability Statement
  • Conflicts of Interest
  • References
  • Cite This Article
  • Author Information