Nigeria's extensive inland water resources are a significant asset, but they face severe threats from pollution driven by rapid urbanization, industrial activities, and inadequate waste management. The Shetiko River, like many others, plays a crucial role in supporting human activities such as sanitation, transportation, and irrigation. However, its vulnerability to contamination, particularly from untreated domestic, industrial, and agricultural waste, has led to ecological degradation, changes in ecosystem functions, and heightened health risks. This study analyzed water quality dynamics of Shetiko River by examining factors influencing heavy metals, physicochemical properties, and salinity (ionic content). Shetiko is located in Kuje, Federal Capital Territory (FCT), Abuja, Nigeria. Factor Analysis and Independent t-tests were used to identify the dimensionality and variation in water quality of Shetiko River. A rotated factor matrix identified three primary dimensions of water quality: heavy metal pollution (Factor 1), general physicochemical conditions (Factor 2), and ionic/salinity contributions (Factor 3). Seasonal variations indicated higher heavy metal and salinity levels during the wet season due to runoff, while the dry season exhibited more stable physicochemical properties. Locational differences revealed elevated heavy metal concentrations downstream, linked to anthropogenic activities, and higher salinity levels upstream, influenced by geological factors. Physicochemical conditions showed minimal variation across locations. These findings underscore the critical need for targeted water management strategies addressing seasonal and spatial variations to safeguard water resources and mitigate pollution impacts.
| Published in | American Journal of Biological and Environmental Statistics (Volume 11, Issue 2) |
| DOI | 10.11648/j.ajbes.20251102.12 |
| Page(s) | 28-41 |
| Creative Commons |
This is an Open Access article, distributed under the terms of the Creative Commons Attribution 4.0 International License (http://creativecommons.org/licenses/by/4.0/), which permits unrestricted use, distribution and reproduction in any medium or format, provided the original work is properly cited. |
| Copyright |
Copyright © The Author(s), 2025. Published by Science Publishing Group |
Water Pollution, Heavy Metals, Physicochemical Properties, Salinity, Factor Analysis
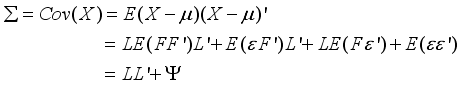
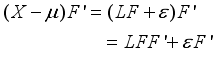
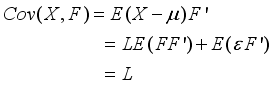
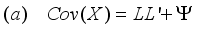
 and covariance matrix
  . In the factor model, X is linearly dependent on a few unobservable random variables variables
  and t additional sources of variation
  . The factor analysis model is given as:
 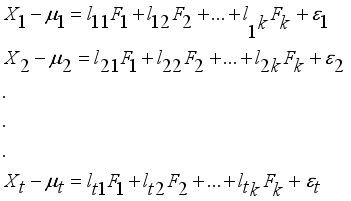 (1)
(1) 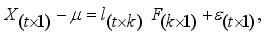 (2)
(2)  is the loading of the ith variable on the jth factor;
  is associated only with the ith response X;
  ,
,  ,…,
,…,  are expressed in terms of t + k random variables
  ,
, 
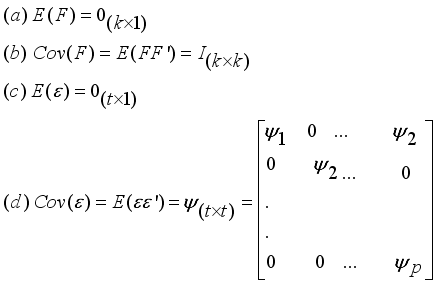 (3)
(3)  are independent so that
 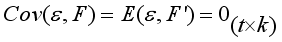 (4)
(4)  which constitute the orthogonal factor model as follows:
 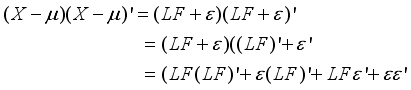 (5)
(5)  (6)
(6)  (7)
(7)  (8)
(8)  (9)
(9)  (10)
(10) 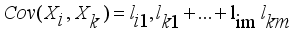 (11)
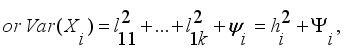
(11)  is the commonality and
  is the specific variance
 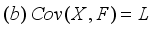 (12)
(12)  (13)
(13) SN | HEAVY METAL | SAMPLE ID | Replicate 1 | Replicate 2 | Replicate 3 | MEAN± SD |
|---|---|---|---|---|---|---|
1 | Lead (Pb) | StWtUp-1 | 0.041 | 0.043 | 0.039 | 0.041 ± 0.002 |
2 | StWtUp-2 | 0.038 | 0.042 | 0.040 | 0.040 ± 0.002 | |
3 | StWtUp-3 | 0.042 | 0.041 | 0.043 | 0.042 ± 0.001 | |
4 | Cadmium (Cd) | StWtUp-1 | 0.010 | 0.012 | 0.011 | 0.011 ± 0.001 |
5 | StWtUp-2 | 0.012 | 0.011 | 0.013 | 0.012 ± 0.001 | |
6 | StWtUp-3 | 0.011 | 0.012 | 0.010 | 0.011 ± 0.001 | |
7 | Chromium (Cr) | StWtUp-1 | 0.140 | 0.145 | 0.142 | 0.142 ± 0.003 |
8 | StWtUp-2 | 0.142 | 0.140 | 0.144 | 0.142 ± 0.002 | |
9 | StWtUp-3 | 0.145 | 0.143 | 0.141 | 0.143 ± 0.002 | |
10 | Copper (Cu) | StWtUp-1 | 0.075 | 0.080 | 0.078 | 0.078 ± 0.003 |
11 | StWtUp-2 | 0.080 | 0.078 | 0.082 | 0.080 ± 0.002 | |
12 | StWtUp-3 | 0.078 | 0.080 | 0.079 | 0.079 ± 0.001 | |
13 | Zinc (Zn) | StWtUp-1 | 0.450 | 0.460 | 0.455 | 0.455 ± 0.005 |
14 | StWtUp-2 | 0.460 | 0.450 | 0.465 | 0.458 ± 0.007 | |
15 | StWtUp-3 | 0.455 | 0.465 | 0.450 | 0.457 ± 0.007 | |
16 | Arsenic (As) | StWtUp-1 | 0.0045 | 0.0055 | 0.005 | 0.005 ± 0.0005 |
17 | StWtUp-2 | 0.0055 | 0.0045 | 0.006 | 0.0053 ± 0.001 | |
18 | StWtUp-3 | 0.005 | 0.006 | 0.0045 | 0.0052 ± 0.001 | |
19 | Mercury (Hg) | StWtUp-1 | 0.0005 | 0.0006 | 0.00055 | 0.00055 ± 0.00005 |
20 | StWtUp-2 | 0.0006 | 0.0005 | 0.0007 | 0.0006 ± 0.0001 | |
21 | StWtUp-3 | 0.00055 | 0.0007 | 0.0005 | 0.00057 ± 0.0001 |
SN | HEAVY METAL | SAMPLE ID | Replicate 1 | Replicate 2 | Replicate 3 | MEAN± SD |
|---|---|---|---|---|---|---|
1 | Lead (Pb) | StWtDn-1 | 0.060 | 0.065 | 0.062 | 0.062 ± 0.003 |
2 | StWtDn-2 | 0.065 | 0.060 | 0.068 | 0.064 ± 0.004 | |
3 | StWtDn-3 | 0.062 | 0.065 | 0.061 | 0.063 ± 0.002 | |
4 | Cadmium (Cd) | StWtDn-1 | 0.018 | 0.020 | 0.019 | 0.019 ± 0.001 |
5 | StWtDn-2 | 0.020 | 0.019 | 0.022 | 0.020 ± 0.002 | |
6 | StWtDn-3 | 0.019 | 0.021 | 0.018 | 0.019 ± 0.002 | |
7 | Chromium (Cr) | StWtDn-1 | 0.250 | 0.260 | 0.255 | 0.255 ± 0.005 |
8 | StWtDn-2 | 0.260 | 0.250 | 0.265 | 0.258 ± 0.007 | |
9 | StWtDn-3 | 0.255 | 0.265 | 0.250 | 0.257 ± 0.007 | |
10 | Copper (Cu) | StWtDn-1 | 0.120 | 0.125 | 0.123 | 0.123 ± 0.003 |
11 | StWtDn-2 | 0.125 | 0.120 | 0.130 | 0.125 ± 0.005 | |
12 | StWtDn-3 | 0.123 | 0.130 | 0.120 | 0.124 ± 0.003 | |
13 | Zinc (Zn) | StWtDn-1 | 0.630 | 0.645 | 0.638 | 0.638 ± 0.007 |
14 | StWtDn-2 | 0.645 | 0.630 | 0.655 | 0.643 ± 0.012 | |
15 | StWtDn-3 | 0.638 | 0.655 | 0.630 | |0.641 ± 0.012 | |
16 | Arsenic (As) | StWtDn-1 | 0.013 | 0.0145 | 0.01375 | 0.01375 ± 0.001 |
17 | StWtDn-2 | 0.0145 | 0.013 | 0.0155 | 0.0143 ± 0.0015 | |
18 | StWtDn-3 | 0.01375 | 0.0155 | 0.013 | 0.0141 ± 0.0015 | |
19 | Mercury (Hg) | StWtDn-1 | 0.0022 | 0.0025 | 0.00235 | 0.00235 ± 0.00015 |
20 | StWtDn-2 | 0.0025 | 0.0022 | 0.0028 | 0.0025 ± 0.0003 | |
21 | StWtDn-3 | 0.00235 | 0.0028 | 0.0022 | 0.00245 ± 0.0003 |
SN | HEAVY METAL | SAMPLE ID | Replicate 1 | Replicate 2 | Replicate 3 | MEAN± SD |
|---|---|---|---|---|---|---|
1 | Lead (Pb) | StDrUp-1 | 0.058 | 0.062 | 0.060 | 0.060 ± 0.002 |
2 | StDrUp-2 | 0.062 | 0.058 | 0.065 | 0.062 ± 0.004 | |
3 | StDrUp-3 | 0.060 | 0.065 | 0.058 | 0.061 ± 0.003 | |
4 | Cadmium (Cd) | StDrUp-1 | 0.015 | 0.018 | 0.016 | 0.016 ± 0.002 |
5 | StDrUp-2 | 0.018 | 0.015 | 0.020 | 0.018 ± 0.003 | |
6 | StDrUp-3 | 0.016 | 0.020 | 0.015 | 0.017 ± 0.003 | |
7 | Chromium (Cr) | StDrUp-1 | 0.200 | 0.210 | 0.205 | 0.205 ± 0.005 |
8 | StDrUp-2 | 0.210 | 0.200 | 0.215 | 0.208 ± 0.007 | |
9 | StDrUp-3 | 0.205 | 0.215 | 0.200 | 0.207 ± 0.007 | |
10 | Copper (Cu) | StDrUp-1 | 0.100 | 0.105 | 0.103 | 0.103 ± 0.003 |
11 | StDrUp-2 | 0.105 | 0.100 | 0.110 | 0.105 ± 0.005 | |
12 | StDrUp-3 | 0.103 | 0.110 | 0.100 | 0.104 ± 0.005 | |
13 | Zinc (Zn) | StDrUp-1 | 0.600 | 0.615 | 0.608 | 0.608 ± 0.007 |
14 | StDrUp-2 | 0.615 | 0.600 | 0.625 | 0.613 ± 0.012 | |
15 | StDrUp-3 | 0.608 | 0.625 | 0.600 | 0.611 ± 0.012 | |
16 | Arsenic (As) | StDrUp-1 | 0.0075 | 0.0085 | 0.008 | 0.008 ± 0.0005 |
17 | StDrUp-2 | 0.0085 | 0.0075 | 0.009 | 0.0087 ± 0.001 | |
18 | StDrUp-3 | 0.008 | 0.009 | 0.0075 | 0.0082 ± 0.001 | |
19 | Mercury (Hg) | StDrUp-1 | 0.0008 | 0.0009 | 0.00085 | 0.00087 ± 0.00005 |
20 | StDrUp-2 | 0.0009 | 0.0008 | 0.001 | 0.00093 ± 0.0001 | |
21 | StDrUp-3 | 0.00085 | 0.001 | 0.0008 | 0.00088 ± 0.0001 |
SN | HEAVY METAL | SAMPLE ID | Replicate 1 | Replicate 2 | Replicate 3 | MEAN± SD |
|---|---|---|---|---|---|---|
1 | Lead (Pb) | StDrDn-1 | 0.090 | 0.095 | 0.093 | 0.093 ± 0.003 |
2 | StDrDn-2 | 0.095 | 0.090 | 0.100 | 0.095 ± 0.005 | |
3 | StDrDn-3 | 0.093 | 0.100 | 0.090 | 0.094 ± 0.005 | |
4 | Cadmium (Cd) | StDrDn-1 | 0.025 | 0.028 | 0.026 | 0.026 ± 0.002 |
5 | StDrDn-2 | 0.028 | 0.025 | 0.030 | 0.028 ± 0.003 | |
6 | StDrDn-3 | 0.026 | 0.030 | 0.025 | |0.027 ± 0.003 | |
7 | Chromium (Cr) | StDrDn-1 | 0.300 | 0.310 | 0.305 | 0.305 ± 0.005 |
8 | StDrDn-2 | 0.310 | 0.300 | 0.315 | 0.308 ± 0.007 | |
9 | StDrDn-3 | 0.305 | 0.315 | 0.300 | 0.307 ± 0.007 | |
10 | Copper (Cu) | StDrDn-1 | 0.150 | 0.155 | 0.153 | 0.153 ± 0.003 |
11 | StDrDn-2 | 0.155 | 0.150 | 0.160 | 0.155 ± 0.005 | |
12 | StDrDn-3 | 0.153 | 0.160 | 0.150 | 0.152 ± 0.005 | |
13 | Zinc (Zn) | StDrDn-1 | 1.020 | 1.035 | 1.028 | 1.028 ± 0.007 |
14 | StDrDn-2 | 1.035 | 1.020 | 1.045 | 1.033 ± 0.012 | |
15 | StDrDn-3 | 1.028 | 1.045 | 1.020 | 1.031 ± 0.012 | |
16 | Arsenic (As) | StDrDn-1 | 0.022 | 0.0235 | 0.0225 | 0.0227 ± 0.001 |
17 | StDrDn-2 | 0.0235 | 0.022 | 0.0245 | 0.0237 ± 0.0015 | |
18 | StDrDn-3 | 0.0225 | 0.0245 | 0.022 | 0.023 ± 0.0015 | |
19 | Mercury (Hg) | StDrDn-1 | 0.0042 | 0.0045 | 0.00435 | 0.00437 ± 0.00015 |
20 | StDrDn-2 | 0.0045 | 0.0042 | 0.0048 | 0.0045 ± 0.0003 | |
21 | StDrDn-3 | 0.00435 | 0.0048 | 0.0042 | 0.00445 ± 0.0003 |
SN | Parameter | Unit | Sample ID | Replicate 1 | Replicate 2 | Replicate 3 | MEAN± SD |
|---|---|---|---|---|---|---|---|
1 | pH | - | StWtUp-1 | 8.2 | 8.3 | 8.1 | 8.2 ± 0.1 |
2 | StWtUp-2 | 8.3 | 8.2 | 8.4 | 8.3 ± 0.1 | ||
3 | StWtUp-3 | 8.1 | 8.4 | 8.2 | 8.2 ± 0.1 | ||
4 | Temperature | °C | StWtUp-1 | 28.5 | 28.8 | 28.2 | 28.5 ± 0.3 |
5 | StWtUp-2 | 28.8 | 28.5 | 29.1 | 28.8 ± 0.3 | ||
6 | StWtUp-3 | 28.2 | 29.1 | 28.5 | 28.6 ± 0.4 | ||
7 | Conductivity | μS/cm | StWtUp-1 | | 600 | 610 | 590 | 600 ± 10 |
8 | StWtUp-2 | 610 | 600 | 620 | 610 ± 10 | ||
9 | StWtUp-3 | 590 | 620 | 600 | 603.3 ± 15 | ||
10 | TDS | mg/L | StWtUp-1 | 360 | 365 | 355 | 360 ± 5 |
11 | StWtUp-2 | 365 | 360 | 370 | 365 ± 5 | ||
12 | StWtUp-3 | 355 | 370 | 360 | 361.7 ± 7.5 | ||
13 | Turbidity | NTU | StWtUp-1 | 15 | 16 | 14 | 15 ± 1 |
14 | StWtUp-2 | 16 | 15 | 17 | 16 ± 1 | ||
15 | StWtUp-3 | 14 | 17 | 15 | 15.3 ± 1.5 | ||
16 | Alkalinity | | mg/L | StWtUp-1 | 200 | 205 | 195 | 200 ± 5 |
17 | StWtUp-2 | 205 | 200 | 210 | 205 ± 5 | ||
18 | StWtUp-3 | 195 | 210 | 200 | 201.7 ± 7.5 | ||
19 | Hardness | mg/L | StWtUp-1 | 300 | 305 | 295 | 300 ± 5 |
20 | StWtUp-2 | 305 | 300 | 310 | 305 ± 5 | ||
21 | StWtUp-3 | 295 | 310 | 300 | 301.7 ± 7.5 | ||
22 | Calcium | mg/L | StWtUp-1 | 80 | 85 | 75 | 80 ± 5 |
23 | StWtUp-2 | 85 | 80 | 90 | 85 ± 5 | ||
24 | StWtUp-3 | 75 | 90 | 80 | 81.7 ± 7.5 | ||
25 | Magnesium | mg/L | StWtUp-1 | 40 | 45 | 35 | 40 ± 5 |
26 | StWtUp-2 | 45 | 40 | 50 | 45 ± 5 | ||
27 | StWtUp-3 | 35 | 50 | 40 | 41.7 ± 7.5 | ||
28 | Chloride | mg/L | StWtUp-1 | 50 | 55 | 45 | 50 ± 5 |
29 | StWtUp-2 | 55 | 50 | 60 | 55 ± 5 | ||
30 | StWtUp-3 | 45 | 60 | 50 | 51.7 ± 7.5 | ||
31 | Nitrate | mg/L | StWtUp-1 | 10 | 12 | 8 | 10 ± 2 |
32 | StWtUp-2 | 12 | 10 | 14 | 12 ± 2 | ||
33 | StWtUp-3 | 8 | 14 | 10 | 10.7 ± 3 | ||
34 | Phosphate | mg/L | StWtUp-1 | 1.10 | 1.15 | 1.05 | 1.10 ± 0.05 |
35 | StWtUp-2 | 1.15 | 1.10 | 1.20 | 1.15 ± 0.05 | ||
36 | StWtUp-3 | 1.05 | 1.20 | 1.10 | 1.12 ± 0.07 |
SN | Parameter | Unit | Sample ID | Replicate 1 | Replicate 2 | Replicate 3 | MEAN± SD |
|---|---|---|---|---|---|---|---|
1 | PH | - | StWtUp-1 | 7.8 | 7.9 | 7.7 | 7.8 ± 0.1 |
2 | StWtUp-2 | 7.9 | 7.8 | 8.0 | 7.9 ± 0.1 | ||
3 | StWtUp-3 | 7.7 | 8.0 | 7.8 | 7.8 ± 0.1 | ||
4 | Temperature | °C | StWtUp-1 | 26.5 | 26.8 | 26.2 | 26.5 ± 0.3 |
5 | StWtUp-2 | 26.8 | 26.5 | 27.1 | 26.8 ± 0.3 | ||
6 | StWtUp-3 | 26.2 | 27.1 | 26.5 | 26.6 ± 0.4 | ||
7 | Conductivity | μS/cm | StWtUp-1 | 400 | 410 | 390 | 400 ± 10 |
8 | StWtUp-2 | 410 | 400 | 420 | 410 ± 10 | ||
9 | StWtUp-3 | 390 | 420 | 400 | 403.3 ± 15 | ||
10 | TDS | mg/L | StWtUp-1 | 240 | 245 | 235 | 240 ± 5 |
11 | StWtUp-2 | 245 | 240 | 250 | 245 ± 5 | ||
12 | StWtUp-3 | 235 | 250 | 240 | 241.7 ± 7.5 | ||
13 | Turbidity | NTU | StWtUp-1 | 10 | 11 | 9 | 10 ± 1 |
14 | StWtUp-2 | 11 | 10 | 12 | 11 ± 1 | ||
15 | StWtUp-3 | 9 | 12 | 10 | 10.3 ± 1.5 | ||
16 | Alkalinity | | mg/L | StWtUp-1 | 150 | 155 | 145 | 150 ± 5 |
17 | StWtUp-2 | 155 | 150 | 160 | 155 ± 5 | ||
18 | StWtUp-3 | 145 | 160 | 150 | 151.7 ± 7.5 | ||
19 | Hardness | mg/L | StWtUp-1 | 220 | 225 | 215 | 220 ± 5 |
20 | StWtUp-2 | 225 | 220 | 230 | 225 ± 5 | ||
21 | StWtUp-3 | 215 | 230 | 220 | 221.7 ± 7.5 | ||
22 | Calcium | mg/L | StWtUp-1 | 60 | 65 | 55 | 60 ± 5 |
23 | StWtUp-2 | 65 | 60 | 70 | 65 ± 5 | ||
24 | StWtUp-3 | 55 | 70 | 60 | 61.7 ± 7.5 | ||
25 | Magnesium | mg/L | StWtUp-1 | 30 | 35 | 25 | 30 ± 5 |
26 | StWtUp-2 | 35 | 30 | 40 | 35 ± 5 | ||
27 | StWtUp-3 | 25 | 40 | 30 | 31.7 ± 7.5 | ||
28 | Chloride | mg/L | StWtUp-1 | 40 | 45 | 35 | 40 ± 5 |
29 | StWtUp-2 | 45 | 40 | 50 | 45 ± 5 | ||
30 | StWtUp-3 | 35 | 50 | 40 | 41.7 ± 7.5 | ||
31 | Nitrate | mg/L | StWtUp-1 | 8 | 10 | 6 | 8 ± 2 |
32 | StWtUp-2 | 10 | 8 | 12 | 10 ± 2 | ||
33 | StWtUp-3 | 6 | 12 | 8 | 8.7 ± 3 | ||
34 | Phosphate | mg/L | StWtUp-1 | 0.80 | 0.85 | 0.75 | 0.80 ± 0.05 |
35 | StWtUp-2 | 0.85 | 0.80 | 0.90 | 0.85 ± 0.05 | ||
36 | StWtUp-3 | 0.75 | 0.90 | 0.80 | 0.82 ± 0.07 |
SN | Parameter | Unit | Sample ID | Replicate 1 | Replicate 2 | Replicate 3 | MEAN± SD |
|---|---|---|---|---|---|---|---|
1 | pH | - | StWtUp-1 | 7.2 | 7.3 | 7.1 | 7.2 ± 0.1 |
2 | StWtUp-2 | 7.3 | 7.2 | 7.4 | 7.3 ± 0.1 | ||
3 | StWtUp-3 | 7.1 | 7.4 | 7.2 | 7.2 ± 0.1 | ||
4 | Temperature | °C | StWtUp-1 | 22.5 | 22.8 | 22.2 | 22.5 ± 0.3 |
5 | StWtUp-2 | 22.8 | 22.5 | 23.1 | 22.8 ± 0.3 | ||
6 | StWtUp-3 | 22.2 | 23.1 | 22.5 | 22.6 ± 0.4 | ||
7 | Conductivity | μS/cm | StWtUp-1 | 350 | 360 | 340 | 350 ± 10 |
8 | StWtUp-2 | 360 | 350 | 370 | 360 ± 10 | ||
9 | StWtUp-3 | 340 | 370 | 350 | 353.3 ± 15 | ||
10 | TDS | mg/L | StWtUp-1 | 210 | 215 | 205 | 210 ± 5 |
11 | StWtUp-2 | 215 | 210 | 220 | 215 ± 5 | ||
12 | StWtUp-3 | 205 | 220 | 210 | 211.7 ± 7.5 | ||
13 | Turbidity | NTU | StWtUp-1 | 8 | 9 | 7 | 8 ± 1 |
14 | StWtUp-2 | 9 | 8 | 10 | 9 ± 1 | ||
15 | StWtUp-3 | 7 | 10 | 8 | 8.3 ± 1.5 | ||
16 | Alkalinity | | mg/L | StWtUp-1 | 140 | 145 | 135 | 140 ± 5 |
17 | StWtUp-2 | 145 | 140 | 150 | 145 ± 5 | ||
18 | StWtUp-3 | 135 | 150 | 140 | 141.7 ± 7.5 | ||
19 | Hardness | mg/L | StWtUp-1 | 200 | 205 | 195 | 200 ± 5 |
20 | StWtUp-2 | 205 | 200 | 210 | 205 ± 5 | ||
21 | StWtUp-3 | 195 | 210 | 200 | 201.7 ± 7.5 | ||
22 | Calcium | mg/L | StWtUp-1 | 50 | 55 | 45 | 50 ± 5 |
23 | StWtUp-2 | 55 | 50 | 60 | 55 ± 5 | ||
24 | StWtUp-3 | 45 | 60 | 50 | 51.7 ± 7.5 | ||
25 | Magnesium | mg/L | StWtUp-1 | 30 | 35 | 25 | 30 ± 5 |
26 | StWtUp-2 | 35 | 30 | 40 | 35 ± 5 | ||
27 | StWtUp-3 | 25 | 40 | 30 | 31.7 ± 7.5 | ||
28 | Chloride | mg/L | StWtUp-1 | 40 | 45 | 35 | 40 ± 5 |
29 | StWtUp-2 | 45 | 40 | 50 | 45 ± 5 | ||
30 | StWtUp-3 | 35 | 50 | 40 | 41.7 ± 7.5 | ||
31 | Nitrate | mg/L | StWtUp-1 | 6 | 8 | 4 | 6 ± 2 |
32 | StWtUp-2 | 8 | 6 | 10 | 8 ± 2 | ||
33 | StWtUp-3 | 4 | 10 | 6 | 6.7 ± 3 | ||
34 | Phosphate | mg/L | StWtUp-1 | 0.38 | 0.42 | 0.35 | 0.38 ± 0.04 |
35 | StWtUp-2 | 0.42 | 0.38 | 0.45 | 0.42 ± 0.04 | ||
36 | StWtUp-3 | 0.35 | 0.45 | 0.38 | 0.39 ± 0.05 |
SN | Parameter | Unit | Sample ID | Replicate 1 | Replicate 2 | Replicate 3 | MEAN± SD |
|---|---|---|---|---|---|---|---|
1 | PH | - | StWtUp-1 | 7.5 | 7.6 | 7.4 | 7.5 ± 0.1 |
2 | StWtUp-2 | 7.6 | 7.5 | 7.7 | 7.6 ± 0.1 | ||
3 | StWtUp-3 | 7.4 | 7.7 | 7.5 | 7.5 ± 0.1 | ||
4 | Temperature | °C | StWtUp-1 | 24.5 | 24.8 | 24.2 | 24.5 ± 0.3 |
5 | StWtUp-2 | 24.8 | 24.5 | 25.1 | 24.8 ± 0.3 | ||
6 | StWtUp-3 | 24.2 | 25.1 | 24.5 | 24.6 ± 0.4 | ||
7 | Conductivity | μS/cm | StWtUp-1 | 450 | 460 | 440 | 450 ± 10 |
8 | StWtUp-2 | 460 | 450 | 470 | 460 ± 10 | ||
9 | StWtUp-3 | 440 | 470 | 450 | 453.3 ± 15 | ||
10 | TDS | mg/L | StWtUp-1 | 270 | 275 | 265 | 270 ± 5 |
11 | StWtUp-2 | 275 | 270 | 280 | 275 ± 5 | ||
12 | StWtUp-3 | 265 | 280 | 270 | 271.7 ± 7.5 | ||
13 | Turbidity | NTU | StWtUp-1 | 12 | 13 | 11 | 12 ± 1 |
14 | StWtUp-2 | 13 | 12 | 14 | 13 ± 1 | ||
15 | StWtUp-3 | 11 | 14 | 12 | 12.3 ± 1.5 | ||
16 | Alkalinity | | mg/L | StWtUp-1 | 180 | 185 | 175 | 180 ± 5 |
17 | StWtUp-2 | 185 | 180 | 190 | 185 ± 5 | ||
18 | StWtUp-3 | 175 | 190 | 180 | 181.7 ± 7.5 | ||
19 | Hardness | mg/L | StWtUp-1 | 250 | 255 | 245 | 250 ± 5 |
20 | StWtUp-2 | 255 | 250 | 260 | 255 ± 5 | ||
21 | StWtUp-3 | 245 | 260 | 250 | 251.7 ± 7.5 | ||
22 | Calcium | mg/L | StWtUp-1 | 70 | 75 | 5 | 70 ± 5 |
23 | StWtUp-2 | 75 | 70 | 80 | 75 ± 5 | ||
24 | StWtUp-3 | 65 | 80 | 70 | 71.7 ± 7.5 | ||
25 | Magnesium | mg/L | StWtUp-1 | 40 | 45 | 35 | 40 ± 5 |
26 | StWtUp-2 | 45 | 40 | 50 | 45 ± 5 | ||
27 | StWtUp-3 | 35 | 50 | 40 | 41.7 ± 7.5 | ||
28 | Chloride | mg/L | StWtUp-1 | 60 | 65 | 55 | 60 ± 5 |
29 | StWtUp-2 | 65 | 60 | 70 | 65 ± 5 | ||
30 | StWtUp-3 | 55 | 70 | 60 | 61.7 ± 7.5 | ||
31 | Nitrate | mg/L | StWtUp-1 | 10 | 12 | 8 | 10 ± 2 |
32 | StWtUp-2 | 12 | 10 | 14 | 12 ± 2 | ||
33 | StWtUp-3 | 8 | 14 | 10 | 10.7 ± 3 | ||
34 | Phosphate | mg/L | StWtUp-1 | 0.60 | 0.65 | 0.55 | 0.60 ± 0.05 |
35 | StWtUp-2 | 0.65 | 0.60 | 0.70 | 0.65 ± 0.05 | ||
36 | StWtUp-3 | 0.55 | 0.70 | 0.60 | 0.62 ± 0.07 |
Factor | |||
|---|---|---|---|
1 | 2 | 3 | |
Lead | .821 | -.529 | -.162 |
Cadmium | .901 | -.410 | -.122 |
Chromium | .816 | -.460 | -.302 |
Cupper | .857 | -.433 | -.275 |
Zinc | .793 | -.502 | -.226 |
Arsenic | .880 | -.332 | -.330 |
Mercury | .875 | -.270 | -.377 |
pH | -.421 | .889 | .157 |
Temp | -.515 | .833 | .061 |
Conductivity | -.633 | .636 | .309 |
TDS | -.644 | .629 | .298 |
Turbidity | -.512 | .639 | .545 |
Calcium | -.245 | .584 | .445 |
Magnesium | -.053 | .131 | .618 |
Chloride | -.329 | -.078 | .949 |
Nitrate | -.267 | .342 | .744 |
Phosphate | -.497 | .859 | .103 |
Season | N | Mean | Std. Deviation | Std. Error Mean | |
|---|---|---|---|---|---|
Heavy Metals | Dry Season | 18 | -.2477553 | .78365757 | .18470986 |
Wet Season | 18 | .2477553 | 1.14936805 | .27090865 | |
Physiochemical conditions | Dry Season | 18 | .8606064 | .52342319 | .12337203 |
Wet Season | 18 | -.8606064 | .49162168 | .11587634 | |
Salinity/ionic content | Dry Season | 18 | -.2803208 | .77583694 | .18286652 |
Wet Season | 18 | .2803208 | 1.11550716 | .26292756 |
t | DF | Sig. (2-tailed) | Mean Difference | Std. Error Difference | |
|---|---|---|---|---|---|
Heavy Metals | -1.511 | 34 | .140 | -.49551050 | .32788600 |
physicochemical conditions | 10.169 | 34 | .000 | 1.72121272 | .16925715 |
salinity/ionic content | -1.751 | 34 | .089 | -.56064150 | .32026718 |
Parameter | location | N | Mean | Std. Deviation | Std. Error Mean |
|---|---|---|---|---|---|
Heavy Metals | Upstream | 18 | -.7706881 | .58178767 | .13712867 |
Downstream | 18 | .7706881 | .68474671 | .16139635 | |
physicochemical conditions | Upstream | 18 | .0540697 | 1.18929177 | .28031876 |
Downstream | 18 | -.0540697 | .81454216 | .19198943 | |
salinity/ionic content | Upstream | 18 | .5294000 | .94179291 | .22198272 |
Downstream | 18 | -.5294000 | .72952612 | .17195096 |
t | DF | Sig. (2-tailed) | Mean Difference | Std. Error Difference | |
|---|---|---|---|---|---|
Heavy Metals | -7.278 | 34 | .000 | -1.54137621 | .21178539 |
physicochemical conditions | .318 | 34 | .752 | .10813931 | .33976249 |
salinity/ionic content | 3.771 | 34 | .001 | 1.05880005 | .28079077 |
| [1] | Ali, R., Hossein, H., Sara, H., Nima, J., Seyedeh, B. Fard, M. & Samira, R. (2019). Evaluation of groundwater quality and heavy metal pollution indices in Bazman basin, southeastern Iran. Groundwater for sustainable development, Volume 9, 2019, 100245. |
| [2] | Ali, M. H., Islam, M. N. & Hoque, M. R. (2009). Assessment of irrigation water quality of a river in Bangladesh. Journal of the Bangladesh agricultural University, 7(2), 247-254. |
| [3] | Ali, M. I., Mohammad R. & Hoque, M. R. (2003). Assessment of heavy metal pollution in irrigation water of Bangladesh. Journal of environmental science and health, Part B, 38(5), 553-561. |
| [4] | Ayers, R. S. & Westcot, D. W. (1994). Water quality for agriculture irrigation and drainage paper 29, Food and Agriculture Organization (FAO) of the United Nations. |
| [5] | Fagbote, E. O. & Olanipekun, E. O. (2013). Evaluation of the impacts of industrial effluents on water quality of the receiving rivers in Nigeria. Journal of environmental science and health, part B, 48(10), 813-821. |
| [6] | Haydar, S., Qari, H. A. & Mohamed, R. M. (2016). Assessment of water quality and pollution status of rivers in Saudi Arabia. Journal of king Saud University of Science, 28(2), 151-160. |
| [7] | Irfan, M., Shakoor, M. B. & Shah, A. (2014). Assessment of water quality of a river in Pakistan. Journal of environmental science and health, 49(10), 741-748. |
| [8] | Kothari, C. R. & Garg, G. (2014). Research methodology: methods and techniques, 3rd ed., New Age International Publishers, New Delhi. |
| [9] | Mussarat, S., K. & Ahmed, M. (2007). Assessment of water quality of a river in Pakistan. Journal of Environmental Science and Health, 42(5), 561-567. |
| [10] | Mustapha, A. & Omotosho, O. E. (2016). Impact of domestic and industrial wastewater on river water quality in Nigeria. Journal of environmental science and health, 34(1), 1-13. |
| [11] | Onyeagu, S. I. (2003). A first course in multivariate statistical analysis, 1st ed. Mega publishers, Awka, Nigeria. |
| [12] | Okoro, H. K. & Fatoki, O. S. (2016). River water pollution in Nigeria: Causes, effects, and control measures. Journal of water resource and protection, 8(10), 1031-1044. |
| [13] | Phocaides, A. (2007). Handbook on pressurized irrigation techniques: Food and Agriculture Organization of the United Nations (FAO), Rome. |
| [14] | Ritchie, J. C. & Schiebe, F. R. (2000). Water quality changes in Lower Mississippi River. American journal of environmental sciences, 6(3), 233-242. |
| [15] | Rowe, D. R., & Abdel-Magid, I. M. (1995). Handbook of wastewater reclamation and reuse. CRC Press. |
| [16] | Sabir, M., Zafar, M. N., Sultana, S. & Javed, A. (2020). Evaluation of water treatment plant performance in removing heavy metals from drinking water. Journal of environmental science and health, Part B, 55(1), 34-43. |
| [17] | Shakoor, M. B. (2015). Heavy metal pollution in rivers of Pakistan. Journal of environmental and occupational science, 4(1), 1-8. |
| [18] | Shakoor, M. B., Niazi, N. K., Bibi, I., Shahid, M. & Khalid, S. (2015). Arsenic and heavy metal pollution in Pakistan: a review. Environmental science and pollution research, 22(15), 11125-11144. |
| [19] | Ukagwu, C. O., Nwosu, D. C. & Onyema, M. I. (2014). Assessment of water quality and aquatic life in Nigerian inland waters. Journal of fisheries and aquatic science, 9(2), 147-155. |
| [20] | Verma, S., Srinivasan, K. T. & Goyal, P. (2012). Assessment of water quality of a river in India. Journal of environmental science and health, 30(1), 34-44. |
| [21] | Zaman, M. S., Islam, M. R., Hossain, M. B. & Hossain, M. A. (2018). Evaluation of water quality and pollution status of a river in Bangladesh. Journal of water and environmental nanotechnology, 3(2), 123-134. |
APA Style
Adeyeye, A. C., Asher, A. S., Kolawole, I. A., Mafuyai, M. Y., Matanmi, O. G. (2025). Multivariate Study of Heavy Metals, Dissolved Salts and Physicochemical Properties of Shetiko River Water, Kuje, Federal Capital Territory, Nigeria. American Journal of Biological and Environmental Statistics, 11(2), 28-41. https://doi.org/10.11648/j.ajbes.20251102.12
ACS Style
Adeyeye, A. C.; Asher, A. S.; Kolawole, I. A.; Mafuyai, M. Y.; Matanmi, O. G. Multivariate Study of Heavy Metals, Dissolved Salts and Physicochemical Properties of Shetiko River Water, Kuje, Federal Capital Territory, Nigeria. Am. J. Biol. Environ. Stat. 2025, 11(2), 28-41. doi: 10.11648/j.ajbes.20251102.12
AMA Style
Adeyeye AC, Asher AS, Kolawole IA, Mafuyai MY, Matanmi OG. Multivariate Study of Heavy Metals, Dissolved Salts and Physicochemical Properties of Shetiko River Water, Kuje, Federal Capital Territory, Nigeria. Am J Biol Environ Stat. 2025;11(2):28-41. doi: 10.11648/j.ajbes.20251102.12
@article{10.11648/j.ajbes.20251102.12,
  author = {Awogbemi Clement Adeyeye and Adedeji Sunday Asher and Ilori Adetunji Kolawole and Mabur Yaks Mafuyai and Oyeyemi Gafar Matanmi},
  title = {Multivariate Study of Heavy Metals, Dissolved Salts and Physicochemical Properties of Shetiko River Water, Kuje, Federal Capital Territory, Nigeria
},
  journal = {American Journal of Biological and Environmental Statistics},
  volume = {11},
  number = {2},
  pages = {28-41},
  doi = {10.11648/j.ajbes.20251102.12},
  url = {https://doi.org/10.11648/j.ajbes.20251102.12},
  eprint = {https://article.sciencepublishinggroup.com/pdf/10.11648.j.ajbes.20251102.12},
  abstract = {Nigeria's extensive inland water resources are a significant asset, but they face severe threats from pollution driven by rapid urbanization, industrial activities, and inadequate waste management. The Shetiko River, like many others, plays a crucial role in supporting human activities such as sanitation, transportation, and irrigation. However, its vulnerability to contamination, particularly from untreated domestic, industrial, and agricultural waste, has led to ecological degradation, changes in ecosystem functions, and heightened health risks. This study analyzed water quality dynamics of Shetiko River by examining factors influencing heavy metals, physicochemical properties, and salinity (ionic content). Shetiko is located in Kuje, Federal Capital Territory (FCT), Abuja, Nigeria. Factor Analysis and Independent t-tests were used to identify the dimensionality and variation in water quality of Shetiko River. A rotated factor matrix identified three primary dimensions of water quality: heavy metal pollution (Factor 1), general physicochemical conditions (Factor 2), and ionic/salinity contributions (Factor 3). Seasonal variations indicated higher heavy metal and salinity levels during the wet season due to runoff, while the dry season exhibited more stable physicochemical properties. Locational differences revealed elevated heavy metal concentrations downstream, linked to anthropogenic activities, and higher salinity levels upstream, influenced by geological factors. Physicochemical conditions showed minimal variation across locations. These findings underscore the critical need for targeted water management strategies addressing seasonal and spatial variations to safeguard water resources and mitigate pollution impacts.
},
 year = {2025}
}
TY  - JOUR
T1  - Multivariate Study of Heavy Metals, Dissolved Salts and Physicochemical Properties of Shetiko River Water, Kuje, Federal Capital Territory, Nigeria

AU  - Awogbemi Clement Adeyeye
AU  - Adedeji Sunday Asher
AU  - Ilori Adetunji Kolawole
AU  - Mabur Yaks Mafuyai
AU  - Oyeyemi Gafar Matanmi
Y1  - 2025/06/06
PY  - 2025
N1  - https://doi.org/10.11648/j.ajbes.20251102.12
DO  - 10.11648/j.ajbes.20251102.12
T2  - American Journal of Biological and Environmental Statistics
JF  - American Journal of Biological and Environmental Statistics
JO  - American Journal of Biological and Environmental Statistics
SP  - 28
EP  - 41
PB  - Science Publishing Group
SN  - 2471-979X
UR  - https://doi.org/10.11648/j.ajbes.20251102.12
AB  - Nigeria's extensive inland water resources are a significant asset, but they face severe threats from pollution driven by rapid urbanization, industrial activities, and inadequate waste management. The Shetiko River, like many others, plays a crucial role in supporting human activities such as sanitation, transportation, and irrigation. However, its vulnerability to contamination, particularly from untreated domestic, industrial, and agricultural waste, has led to ecological degradation, changes in ecosystem functions, and heightened health risks. This study analyzed water quality dynamics of Shetiko River by examining factors influencing heavy metals, physicochemical properties, and salinity (ionic content). Shetiko is located in Kuje, Federal Capital Territory (FCT), Abuja, Nigeria. Factor Analysis and Independent t-tests were used to identify the dimensionality and variation in water quality of Shetiko River. A rotated factor matrix identified three primary dimensions of water quality: heavy metal pollution (Factor 1), general physicochemical conditions (Factor 2), and ionic/salinity contributions (Factor 3). Seasonal variations indicated higher heavy metal and salinity levels during the wet season due to runoff, while the dry season exhibited more stable physicochemical properties. Locational differences revealed elevated heavy metal concentrations downstream, linked to anthropogenic activities, and higher salinity levels upstream, influenced by geological factors. Physicochemical conditions showed minimal variation across locations. These findings underscore the critical need for targeted water management strategies addressing seasonal and spatial variations to safeguard water resources and mitigate pollution impacts.

VL  - 11
IS  - 2
ER  -
National Mathematical Centre, Abuja, Nigeria
National Mathematical Centre, Abuja, Nigeria
Information

