Globally air pollution is a major concern as it poses serious health risks, damages the environment, contributes to climate change, and incurs substantial economic costs. The objective of this study is to monitor the Particulate Matters (PM1, PM2.5, and PM10) and Carbon Monoxide (CO) concentration based on different land use in Narayanganj District town. This study was conducted in seven land uses, 60 locations of Narayanganj District, a district of Dhaka Division; by using portable Air Quality Monitor, Indoor Outdoor Formaldehyde (HCHO) Detector (Model: DM106) and CO Meter (Model: AS8700A). Descriptive statistics and whisker box plots were also employed to analyze and visualize the variations in pollutant concentrations across different locations. Additionally, a dendrogram plot was created to classify and interpret data clusters, providing a deeper understanding of the spatial distribution of pollutants. Results indicated that the average concentration of PM2.5 of different land-use were found 3.37 times higher than the Bangladesh National Ambient Air Quality Standard (NAAQS) level. NAAQS set for PM2.5, and PM10 at 65 and 150 µg/m3, respectively by Department of Environment (DoE). Consequently, the most polluted location was found in Industrial location with PM1, PM2.5 and PM10 concentration of 230, 389 and 496 µg/m3, respectively. Also, the concentration of CO was 1.3 to 2.3 times higher than NAAQS level which is 9 ppm (8-hour) set By Department of Environment (DoE). Besides, the study estimated that the average PM2.5/PM10 ratio was 77.32%, while the PM1/PM2.5 ratio was 60.85%, which indicated significant presence of finer particles in the air. Therefore, the study underscores the urgent need for enhanced air quality policies and public awareness in Narayanganj District due to critically high levels of air pollution.
| Published in | American Journal of Environmental Protection (Volume 14, Issue 2) |
| DOI | 10.11648/j.ajep.20251402.11 |
| Page(s) | 21-35 |
| Creative Commons |
This is an Open Access article, distributed under the terms of the Creative Commons Attribution 4.0 International License (http://creativecommons.org/licenses/by/4.0/), which permits unrestricted use, distribution and reproduction in any medium or format, provided the original work is properly cited. |
| Copyright |
Copyright © The Author(s), 2025. Published by Science Publishing Group |
Particulate Matter, Gaseous Pollutants, Land Use, Meteorological Correlation, Narayanganj District
SL. | Parameters | Instrument | Model |
|---|---|---|---|
1. | PM1, PM2.5, PM10, HCHO, TVOC, AQI, Temperature, Humidity | Air Quality Monitor, Indoor Outdoor Formaldehyde (HCHO) Detector | Model: DM106; B07SCM4YN3 (Saiko) |
2. | Carbon Monoxide (CO) | Handheld Carbon Monoxide Meter | AS8700A (Smart Sensor / OEM) |
Sl. No. | Land Use | PM1 | PM2.5 | |||||||
|---|---|---|---|---|---|---|---|---|---|---|
Number of locations | Range (µg/m3) | Mean (µg/m3) | Std. Deviation (µg/m3) | Coefficient of Variation (%) | Range (µg/m3) | Mean (µg/m3) | Std. Deviation (µg/m3) | Coefficient of Variation (%) | ||
1 | Sensitive Area | 6 | 66 | 127.33 | 23.93 | 18.79 | 99 | 212.33 | 36.49 | 17.18 |
2 | Mixed Area | 7 | 77 | 113.57 | 25.90 | 22.80 | 118 | 188.29 | 39.63 | 21.05 |
3 | Residential Area | 10 | 78 | 127.30 | 22.94 | 18.02 | 126 | 209.5 | 37.78 | 18.04 |
4 | Road Intersection Area | 7 | 66 | 114.57 | 21.90 | 19.11 | 115 | 197.71 | 39.98 | 20.22 |
5 | Commercial Area | 10 | 95 | 143.00 | 32.49 | 22.72 | 163 | 225.5 | 47.49 | 21.06 |
6 | Industrial Area | 10 | 84 | 175.60 | 27.73 | 15.79 | 144 | 291.7 | 47.15 | 16.16 |
7 | Village Area | 10 | 76 | 124.90 | 21.57 | 17.27 | 105 | 211.2 | 32.50 | 15.39 |
Sl. No. | Land Use | PM10 | CO | |||||||
|---|---|---|---|---|---|---|---|---|---|---|
Number of locations | Range (µg/m3) | Mean (µg/m3) | Std. Deviation (µg/m3) | Coefficient of Variation (%) | Range (ppm) | Mean (ppm) | Std. Deviation (ppm) | Coefficient of Variation (%) | ||
1 | Sensitive Area | 6 | 254 | 221.33 | 97.99 | 44.27 | 23 | 8.67 | 10.58 | 122.04 |
2 | Mixed Area | 7 | 157 | 242.14 | 52.70 | 21.77 | 36 | 12 | 12.77 | 106.39 |
3 | Residential Area | 10 | 162 | 271.5 | 47.82 | 17.61 | 18 | 5.20 | 6.34 | 121.90 |
4 | Road Intersection Area | 7 | 135 | 247.14 | 45.39 | 18.36 | 44 | 17.71 | 15.76 | 88.94 |
5 | Commercial Area | 10 | 211 | 302.20 | 70.18 | 23.22 | 44 | 13.10 | 13.95 | 106.47 |
6 | Industrial Area | 10 | 183 | 374.20 | 60.10 | 16.06 | 40 | 20.70 | 16.15 | 78.03 |
7 | Village Area | 10 | 148 | 264.60 | 41.28 | 15.60 | 10 | 2.90 | 3.93 | 135.47 |
ANOVA | ||||||
|---|---|---|---|---|---|---|
Sum of Squares | df | Mean Square | F | Sig. | ||
PM1 | Between Groups | 25208.821 | 6 | 4201.470 | 6.343 | 0.000 |
Within Groups | 35106.162 | 53 | 662.380 | |||
Total | 60314.983 | 59 | ||||
PM2.5 | Between Groups | 64057.693 | 6 | 10676.282 | 6.406 | 0.000 |
Within Groups | 88332.890 | 53 | 1666.658 | |||
Total | 152390.583 | 59 | ||||
PM10 | Between Groups | 134897.452 | 6 | 22482.909 | 6.279 | 0.000 |
Within Groups | 189785.148 | 53 | 3580.852 | |||
Total | 324682.600 | 59 | ||||
CO | Between Groups | 2326.721 | 6 | 387.787 | 2.695 | 0.023 |
Within Groups | 7626.262 | 53 | 143.892 | |||
Total | 9952.983 | 59 | ||||
Total | .269 | 59 | ||||
Correlations among PM & CO and Selected Meteorological Parameters | |||||||
|---|---|---|---|---|---|---|---|
PM1.0 | PM2.5 | PM10 | CO | Temperature | Humidity | ||
PM1 | Pearson Correlation | 1 | .958** | .843** | .341** | -.022 | .154 |
Sig. (2-tailed) | .000 | .000 | .008 | .865 | .242 | ||
N | 60 | 60 | 60 | 60 | 60 | 60 | |
PM2.5 | Pearson Correlation | .958** | 1 | .819** | .362** | -.001 | .108 |
Sig. (2-tailed) | .000 | .000 | .004 | .995 | .412 | ||
N | 60 | 60 | 60 | 60 | 60 | 60 | |
PM10 | Pearson Correlation | .843** | .819** | 1 | .261* | -.141 | .259* |
Sig. (2-tailed) | .000 | .000 | .044 | .282 | .046 | ||
N | 60 | 60 | 60 | 60 | 60 | 60 | |
CO | Pearson Correlation | .341** | .362** | .261* | 1 | .095 | .021 |
Sig. (2-tailed) | .008 | .004 | .044 | .472 | .875 | ||
N | 60 | 60 | 60 | 60 | 60 | 60 | |
Temperature | Pearson Correlation | -.022 | -.001 | -.141 | .095 | 1 | -.896** |
Sig. (2-tailed) | .865 | .995 | .282 | .472 | .000 | ||
N | 60 | 60 | 60 | 60 | 60 | 60 | |
Humidity | Pearson Correlation | .154 | .108 | .259* | .021 | -.896** | 1 |
Sig. (2-tailed) | .242 | .412 | .046 | .875 | .000 | ||
N | 60 | 60 | 60 | 60 | 60 | 60 | |
**. Correlation is significant at the 0.01 level (2-tailed). | |||||||
*. Correlation is significant at the 0.05 level (2-tailed). | |||||||
AQI | Air Quality Index |
CARB | California Air Resources Board |
ECA | Energy and Clean Air |
EEA | European Environment Agency |
DoE | Department of Environment, Bangladesh |
NAAQS | National Ambient Air Quality Standard |
PM | Particulate Matter |
UNEP | United Nations Environment Programme |
U.S. EPA | U. S. Environmental Protection Agency |
WHO | World Health Organization |
| [1] | World Health Organization (WHO) (2024). Air pollution. Retrieved August 25, 2024, from |
| [2] | UNEP (2023). Air Pollution Note: Data You Need to Know. UNEP. Retrieved August 27, 2024, from |
| [3] |
U. S. EPA – U. S. Environmental Protection Agency. (2024). Particulate matter (PM) basics. Retrieved August 25, 2024, from
https://www.epa.gov/pm-pollution/particulate-matter-pm-basics |
| [4] |
CARB – California Air Resources Board (2024). Inhalable particulate matter and health. Retrieved August 27, 2024, from
https://ww2.arb.ca.gov/resources/inhalable-particulate-matter-and-health |
| [5] | Thangavel, P., Park, D. and Lee, Y. (2022). Recent Insights into Particulate Matter (PM2.5)-Mediated Toxicity in Humans: An Overview. Int J Environ Res Public Health, 19(12), 7511. |
| [6] | IQAir. (2023). World Air Quality Report 2023. Retrieved August 27, 2024, from |
| [7] | Molla, M. A. (2021). Air pollution in Bangladesh killed 2.36 lakh people in 2021. The Daily Star. URL: |
| [8] | Majumder, A. K., Rahman, M., Patoary, M. N. A., Kamruzzaman, A. M. and Majumder, R. (2024a). Time Series Analysis PM2.5 Concentration for Capital City Dhaka from 2016 to 2023. Science Frontiers, 5(1): 35-42. |
| [9] | World Bank (2023). Bangladesh needs urgent actions to curb air pollution. Retrieved from |
| [10] | Majumder, A. K., Patoary, M. N. A., Nayeem, A. A. and Rahmana, M. (2023a). Air quality index (AQI) changes and spatial variation in Bangladesh from 2014 to 2019. Journal of Air Pollution and Health, 8(2): 227-244. |
| [11] | Majumder, A. K., Akbar, A. T. M. M., Rahman, M., Patoary, M. N. A., Islam, M. R., and Majumder, R. (2024b). Monsoon Season Spatial Distribution of Particulates Concentration in the Road Intersection Area of Different Land Use in Major City in South Asian Countries. Journal of Health and Environmental Research, 10(1): 15-28. |
| [12] | DoE - Department of Environment (2019). Sources of Air Pollution in Bangladesh (Brick Kiln & Vehicle Emission Scenario). Clean Air and Sustainable Environment Project. Retrived from |
| [13] | ECA - Energy and Clean Air (2024). Together for clean air: Governance of transboundary air pollution for blue skies. Energy and Clean Air. Retrieved from |
| [14] |
EEA - European Environment Agency (2023). How air pollution affects our health. European Environment Agency. Retrieved August 28, 2024, from
https://www.eea.europa.eu/en/topics/in-depth/air-pollution/eow-it-affects-our-health |
| [15] | Dibya, T. B., Proma, A. Y. and Dewan, S. M. R. (2023). Poor Respiratory Health is a Consequence of Dhaka’s Polluted Air: A Bangladeshi Perspective. Environ Health Insights, 17: 11786302231206126. |
| [16] | Majumder, A. K., Kamruzzaman, Tareq, M. S., Rahman, M., Islam, M. and Patoary, M. N. A. (2024c). Status of Ambient Air Quality in Chattogram Metropolitan, Bangladesh. International Journal of Research in Environmental Science (IJRES), 10(1): 1-13. |
| [17] | Majumder, A. K., Kamruzzaman, A. M., Rahman, M. and Patoary, M. N. A. (2024d). Status of air quality in Rajshahi metropolitan area, Bangladesh. GSC Advanced Research and Reviews 18(1): 201-212. |
| [18] | Majumder, A. K., Ullah, M. S., Rahman, M. and Patoary, M. N. A. (2023b). Spatial Distribution of Air Quality in Lakshmipur District Town, Bangladesh: A Winter Time Observation. Multidisciplinary International Journal of Research and Development (MIJRD), 3(6): 52-65. |
| [19] | Majumder, A. K. & Hossain, M M & Patoary, M. N. A & Rahman, Marziat. (2023c). Spatial distribution of air quality in Netrokona district town, Bangladesh. Open Access Research Journal of Engineering and Technology, 5: 1-11. |
| [20] | Rules, E. C. (2023). Department of Environment. Ministry of Environment, Forest and Climate Change. People’s Republic of Bangladesh. |
APA Style
Majumder, A. K., Hossain, T., Rahman, M., Mita, M. H., Hossain, S. M. A. (2025). Spatial Distribution of Air Quality in Narayanganj District Town, Bangladesh. American Journal of Environmental Protection, 14(2), 21-35. https://doi.org/10.11648/j.ajep.20251402.11
ACS Style
Majumder, A. K.; Hossain, T.; Rahman, M.; Mita, M. H.; Hossain, S. M. A. Spatial Distribution of Air Quality in Narayanganj District Town, Bangladesh. Am. J. Environ. Prot. 2025, 14(2), 21-35. doi: 10.11648/j.ajep.20251402.11
@article{10.11648/j.ajep.20251402.11,
  author = {Ahmad Kamruzzaman Majumder and Tanjir Hossain and Marziat Rahman and Mohsina Hossain Mita and S M Alamgir Hossain},
  title = {Spatial Distribution of Air Quality in Narayanganj District Town, Bangladesh
},
  journal = {American Journal of Environmental Protection},
  volume = {14},
  number = {2},
  pages = {21-35},
  doi = {10.11648/j.ajep.20251402.11},
  url = {https://doi.org/10.11648/j.ajep.20251402.11},
  eprint = {https://article.sciencepublishinggroup.com/pdf/10.11648.j.ajep.20251402.11},
  abstract = {Globally air pollution is a major concern as it poses serious health risks, damages the environment, contributes to climate change, and incurs substantial economic costs. The objective of this study is to monitor the Particulate Matters (PM1, PM2.5, and PM10) and Carbon Monoxide (CO) concentration based on different land use in Narayanganj District town. This study was conducted in seven land uses, 60 locations of Narayanganj District, a district of Dhaka Division; by using portable Air Quality Monitor, Indoor Outdoor Formaldehyde (HCHO) Detector (Model: DM106) and CO Meter (Model: AS8700A). Descriptive statistics and whisker box plots were also employed to analyze and visualize the variations in pollutant concentrations across different locations. Additionally, a dendrogram plot was created to classify and interpret data clusters, providing a deeper understanding of the spatial distribution of pollutants. Results indicated that the average concentration of PM2.5 of different land-use were found 3.37 times higher than the Bangladesh National Ambient Air Quality Standard (NAAQS) level. NAAQS set for PM2.5, and PM10 at 65 and 150 µg/m3, respectively by Department of Environment (DoE). Consequently, the most polluted location was found in Industrial location with PM1, PM2.5 and PM10 concentration of 230, 389 and 496 µg/m3, respectively. Also, the concentration of CO was 1.3 to 2.3 times higher than NAAQS level which is 9 ppm (8-hour) set By Department of Environment (DoE). Besides, the study estimated that the average PM2.5/PM10 ratio was 77.32%, while the PM1/PM2.5 ratio was 60.85%, which indicated significant presence of finer particles in the air. Therefore, the study underscores the urgent need for enhanced air quality policies and public awareness in Narayanganj District due to critically high levels of air pollution.
},
 year = {2025}
}
TY  - JOUR
T1  - Spatial Distribution of Air Quality in Narayanganj District Town, Bangladesh

AU  - Ahmad Kamruzzaman Majumder
AU  - Tanjir Hossain
AU  - Marziat Rahman
AU  - Mohsina Hossain Mita
AU  - S M Alamgir Hossain
Y1  - 2025/03/07
PY  - 2025
N1  - https://doi.org/10.11648/j.ajep.20251402.11
DO  - 10.11648/j.ajep.20251402.11
T2  - American Journal of Environmental Protection
JF  - American Journal of Environmental Protection
JO  - American Journal of Environmental Protection
SP  - 21
EP  - 35
PB  - Science Publishing Group
SN  - 2328-5699
UR  - https://doi.org/10.11648/j.ajep.20251402.11
AB  - Globally air pollution is a major concern as it poses serious health risks, damages the environment, contributes to climate change, and incurs substantial economic costs. The objective of this study is to monitor the Particulate Matters (PM1, PM2.5, and PM10) and Carbon Monoxide (CO) concentration based on different land use in Narayanganj District town. This study was conducted in seven land uses, 60 locations of Narayanganj District, a district of Dhaka Division; by using portable Air Quality Monitor, Indoor Outdoor Formaldehyde (HCHO) Detector (Model: DM106) and CO Meter (Model: AS8700A). Descriptive statistics and whisker box plots were also employed to analyze and visualize the variations in pollutant concentrations across different locations. Additionally, a dendrogram plot was created to classify and interpret data clusters, providing a deeper understanding of the spatial distribution of pollutants. Results indicated that the average concentration of PM2.5 of different land-use were found 3.37 times higher than the Bangladesh National Ambient Air Quality Standard (NAAQS) level. NAAQS set for PM2.5, and PM10 at 65 and 150 µg/m3, respectively by Department of Environment (DoE). Consequently, the most polluted location was found in Industrial location with PM1, PM2.5 and PM10 concentration of 230, 389 and 496 µg/m3, respectively. Also, the concentration of CO was 1.3 to 2.3 times higher than NAAQS level which is 9 ppm (8-hour) set By Department of Environment (DoE). Besides, the study estimated that the average PM2.5/PM10 ratio was 77.32%, while the PM1/PM2.5 ratio was 60.85%, which indicated significant presence of finer particles in the air. Therefore, the study underscores the urgent need for enhanced air quality policies and public awareness in Narayanganj District due to critically high levels of air pollution.

VL  - 14
IS  - 2
ER  -
Department of Environmental Science, Stamford University Bangladesh, Dhaka, Bangladesh & Center for Atmospheric Pollution Studies (CAPS), Dhaka, Bangladesh
Department of Environmental Science, Stamford University Bangladesh, Dhaka, Bangladesh
Department of Environmental Science, Stamford University Bangladesh, Dhaka, Bangladesh & Center for Atmospheric Pollution Studies (CAPS), Dhaka, Bangladesh
Center for Atmospheric Pollution Studies (CAPS), Dhaka, Bangladesh
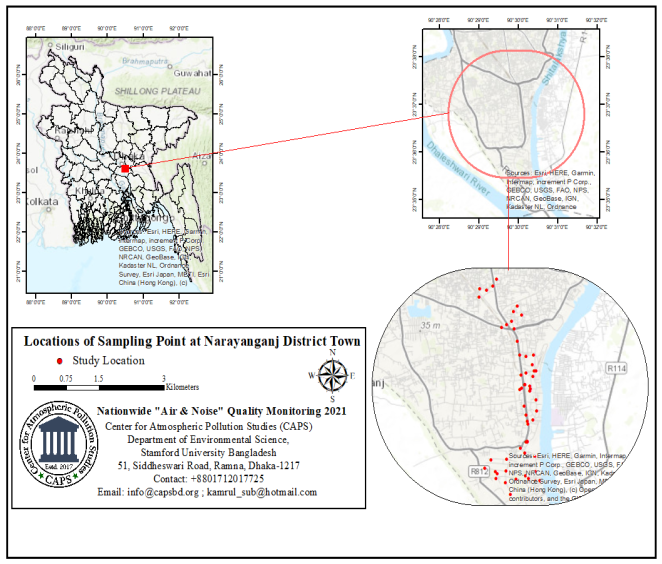
Figure 1. Study Area (Narayanganj District Town and Data Collection Location).
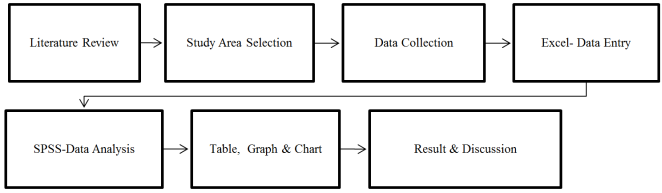
Figure 2. Flow Diagram of Research Methods.
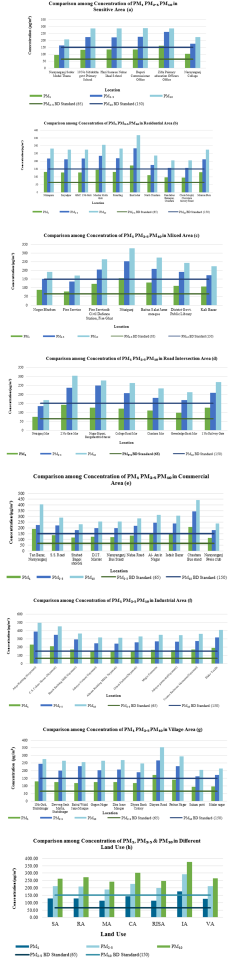
Figure 3. Concentration of PM1, PM2.5 & PM10 in sensitive, residential, mixed, commercial, road intersection, industrial and village area.
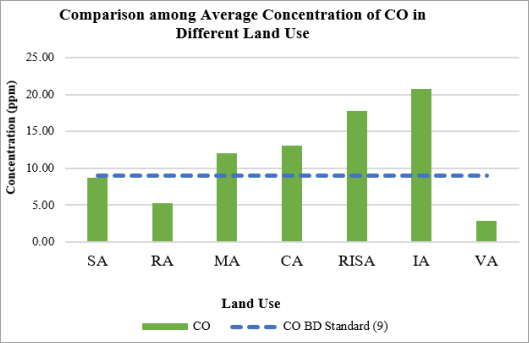
Figure 4. Average Concentration of CO of Different Land Use.
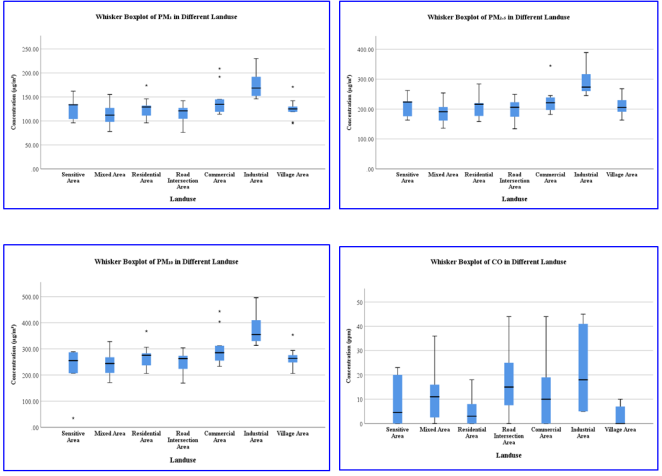
Figure 5. Whisker Box Plot of the Concentration of PM1, PM2.5, PM10 & CO in Different Land use.
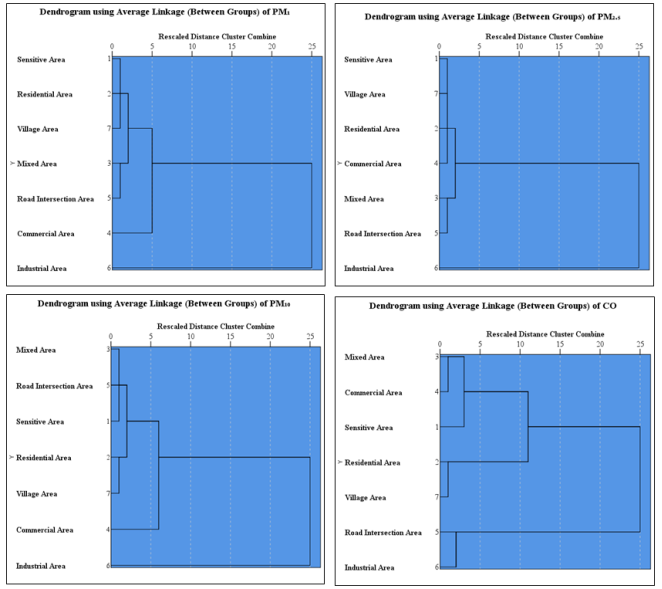
Figure 6. Rescaled Distance Cluster Combine for PM1, PM2.5, PM10 and CO.
Information

