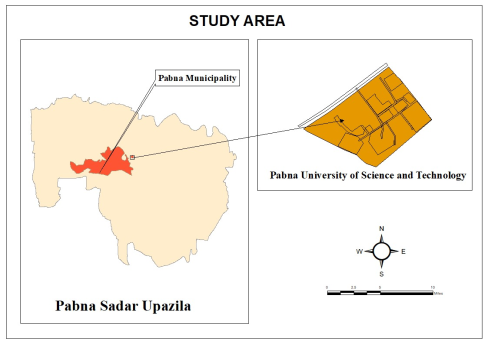
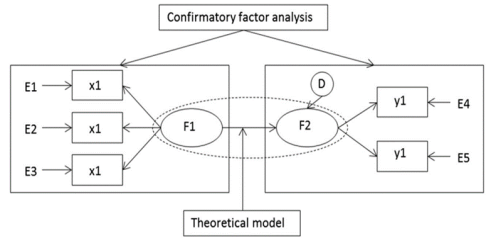
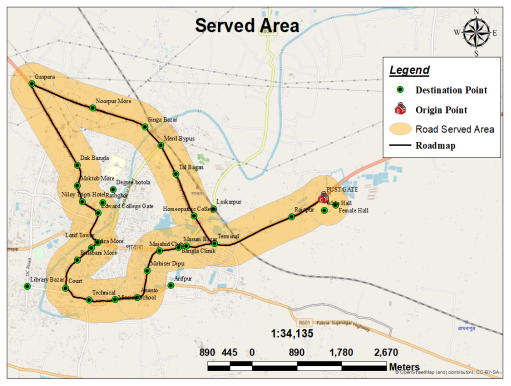
Efficient and accessible transportation services are crucial for facilitating smooth travel for students on university campuses. This study offers a thorough evaluation of the transportation services at Pabna University of Science and Technology (PUST), seeking to identify the primary factors affecting student satisfaction and preferences for travel modes. The study utilizes data gathered from 370 students using structured questionnaires, employing Structural Equation Modelling (SEM) and Confirmatory Factor Analysis (CFA) to assess the correlations between service quality features and student satisfaction. Significant data indicate that 54.9% of students prioritize cost-effectiveness as the foremost reason for utilizing the service, whereas 36.5% identify overcrowding and 31.6% emphasize inadequate seating space as substantial obstacles to usage. The Geographic Information System (GIS) study delineated service coverage, pinpointing accessibility deficiencies, especially in locales such as Bottola and Arifpur, where pupils encounter extended walking distances to bus stops. Structural Equation Modeling (SEM) and Confirmatory Factor Analysis (CFA) were utilized to examine latent variables, revealing substantial correlations between service quality attributes (e.g., safety, driver conduct) and student satisfaction. The model fit indices (RMSEA = 0.072, CFI = 0.904) affirmed strong statistical validity. Although there was reasonable satisfaction with travel speed (Mean = 3.48) and safety (Mean = 3.49), significant shortcomings were observed in seat availability (Mean = 2.20) and fleet size (Mean = 2.08). Only 39.2% of students employed GPS tracking, signifying restricted use of technology solutions. Student feedback highlighted the necessity for augmented bus frequency (44.3%) and expanded routes (18.6%) to improve service effectiveness. The study emphasizes the importance of data-driven planning and the improvement of transport services to achieve enhanced inclusivity, reliability, and user satisfaction. Its findings provide actionable insights for university authorities to optimize resource allocation and enhance the efficiency and accessibility of campus transport systems.
| Published in | American Journal of Traffic and Transportation Engineering (Volume 10, Issue 2) |
| DOI | 10.11648/j.ajtte.20251002.12 |
| Page(s) | 48-61 |
| Creative Commons |
This is an Open Access article, distributed under the terms of the Creative Commons Attribution 4.0 International License (http://creativecommons.org/licenses/by/4.0/), which permits unrestricted use, distribution and reproduction in any medium or format, provided the original work is properly cited. |
| Copyright |
Copyright © The Author(s), 2025. Published by Science Publishing Group |
University Transport Services, Pabna University of Science and Technology (PUST), Service Quality, Operational Efficiency, Fleet Capacity, Structural Equation Modelling (SEM), Student Satisfaction
Reason of preference | Frequency | Percent | Cumulative Percent |
|---|---|---|---|
Faster | 50 | 13.5 | 13.5 |
Economy | 203 | 54.9 | 68.4 |
Safety | 81 | 21.9 | 90.3 |
Reliability | 28 | 7.6 | 97.8 |
No comments | 8 | 2.2 | 100.0 |
Total | 370 | 100.0 | - |
Causes of not using university bus | Frequency | Percent |
|---|---|---|
Poor seat capacity | 117 | 31.6 |
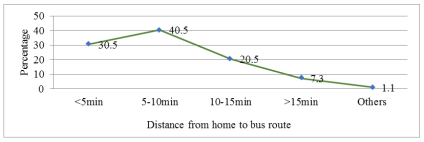
Distance of bus route | 44 | 11.9 |
Overcrowding | 135 | 36.5 |
Break of schedule | 71 | 19.2 |
No comments | 3 | .8 |
Total | 370 | 100.0 |
Use of GPS tracking system | Effectiveness of GPS tracking system | Total | |||||
|---|---|---|---|---|---|---|---|
Very dissatisfied | Dissatisfied | Moderate | Satisfied | very satisfied | No comments | ||
yes | 3.0% | 7.8% | 14.1% | 12.7% | 1.6% | - | 39.2% |
no | - | 0.3% | 2.7% | 0.3% | - | 57.6% | 60.8% |
Total | 3.0% | 8.1% | 16.8% | 13.0% | 1.6% | 57.6% | 100.0% |
Service area condition | Frequency | Percent |
|---|---|---|
very poor | 50 | 13.5 |
Poor | 66 | 17.8 |
Moderate | 163 | 44.1 |
Good | 84 | 22.7 |
very good | 7 | 1.9 |
Total | 370 | 100.0 |
Suggestion to improve varsity transport service | Kind of improvement they need | Total | ||||
|---|---|---|---|---|---|---|
more route | more frequent buses | better bus | need bus stop in campus | No comments | ||
Yes | 18.6% | 44.3% | 17.8% | 9.2% | - | 90.0% |
No | 0.3% | 0.5% | 0.3% | 8.4% | 9.5% | |
No comments | - | - | - | - | 0.5% | 0.5% |
Total | 18.9% | 44.9% | 17.8% | 9.5% | 8.9% | 100.0% |
USI influencing factors | N | Minimum | Maximum | Mean | Rank |
|---|---|---|---|---|---|
Bus Schedule | 370 | 1 | 5 | 2.82 | 3 |
Easy to access Bus stops | 370 | 1 | 5 | 3.04 | 3 |
Route Layout | 370 | 1 | 5 | 3.02 | 3 |
Waiting for Bus | 370 | 1 | 5 | 2.85 | 3 |
Convenience Payment | 370 | 1 | 5 | 3.19 | 3 |
Travel Speed | 370 | 1 | 5 | 3.48 | 2 |
Smoothness Ride | 370 | 1 | 5 | 3.45 | 2 |
Number of stoppages | 370 | 1 | 5 | 3.00 | 3 |
Safety and Security | 370 | 1 | 5 | 3.49 | 2 |
Cleanliness of vehicles | 370 | 1 | 5 | 3.12 | 3 |
Seat availability | 370 | 1 | 5 | 2.20 | 4 |
Bus driver Behaviour | 370 | 1 | 5 | 3.35 | 3 |
Enough number of buses | 370 | 1 | 5 | 2.08 | 4 |
Valid N (listwise) | 370 | - | - | - | - |
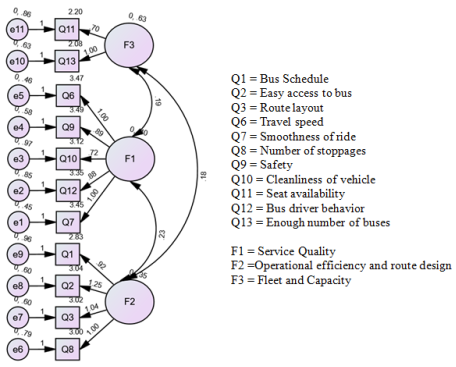
Influence | Factors | Estimate | Standard Estimates | S.E. | C.R. | P |
|---|---|---|---|---|---|---|
Smoothness Ride | Service Quality (F1) | 1.000 | .684 | - | - | - |
driver Behavior | Service Quality (F1) | .876 | .513 | .110 | 7.997 | *** |
Cleanliness vehicles | Service Quality (F1) | .717 | .417 | .108 | 6.665 | *** |
Safety and Security | Service Quality (F1) | .887 | .591 | .099 | 8.962 | *** |
Travel Speed | Service Quality (F1) | 1.003 | .683 | .102 | 9.864 | *** |
Number stoppage | Operational efficiency and route design (F2) | 1.000 | .551 | - | - | - |
Route Layout | Operational efficiency and route design (F2) | 1.037 | .619 | .135 | 7.699 | *** |
easy access | Operational efficiency and route design (F2) | 1.254 | .690 | .156 | 8.015 | *** |
Bus Schedule | Operational efficiency and route design (F2) | .917 | .482 | .138 | 6.630 | *** |
number buses | Fleet and Capacity (F3) | 1.000 | .705 | - | - | - |
Seat availability | Fleet and Capacity (F3) | .700 | .512 | .184 | 3.802 | *** |
CFA | Confirmatory Factor Analysis |
DCM | Discrete Choice Modelling |
EFA | Exploratory Factor Analysis |
GIS | Geographic Information System |
IPA | Importance Performance Analysis |
PLS-SEM | Partial Least Squares-structural Equation Modelling |
PUST | Pabna University of Science and Technology |
RMS | Road Management System |
SEM | Structural Equation Modelling |
TDM | Transport Demand Management |
| [1] | Dong, Z. Y., Zhang, Y., Yip, C., Swift, S., & Beswick, K. (2020). Smart campus: definition, framework, technologies, and services. IET Smart Cities, 2(1), 43-54. |
| [2] | Shaaban, K., & Kim, I. (2016). The influence of bus service satisfaction on university students' mode choice. Journal of Advanced Transportation, 50(6), 935-948. |
| [3] | Hashim, R., Mohamad, S., Haron, S., Hassan, F., Hassan, N. A., & Kasa, A. (2013, April). Student satisfaction with the campus bus services at UiTM Shah Alam, Malaysia. In 2013 IEEE Business Engineering and Industrial Applications Colloquium (BEIAC) (pp. 723-727). IEEE. |
| [4] | Sohail, M., Maunder, D. A. C., & Cavill, S. (2006). Effective regulation for sustainable public transport in developing countries. Transport policy, 13(3), 177-190. |
| [5] | Tumlin, J. (2011). Sustainable transportation planning: tools for creating vibrant, healthy, and resilient communities. John Wiley & Sons. |
| [6] | Beyaztas, H. (2012). Impact of campus physical characteristics on university sustainability performance (Doctoral dissertation). |
| [7] | Brown, J., Hess, D. B., & Shoup, D. (2003). Fare-free public transit at universities: An evaluation. Journal of Planning Education and Research, 23(1), 69-82. |
| [8] | Harnack, L. (2010). Transportation: On campus and off. Mass Transit. http://worldcat.org/oclc/1794668 |
| [9] | Jabin, N., Al Noman, A., Parvin, S., Kader, A., Aktar, T., & Uddin, I. (2022). Transportation Service and Student’s Satisfaction: A Study on Dhaka University. Indian Journal of Social Science and Literature, 1(4), 6-13. |
| [10] | Pasha, M. M., Chowdhury, I. M., & Bhuiyan, M. A. (2015). University Students’ perception on public transit in Dhaka City. International Journal of Humanities and Social Sciences, 9(10), 3505-3508. |
| [11] | Khanam, M., & Marufuzzaman, M. (2019). Determination of the Level of Service at Major Intersection: A Case Study on Traffic More Intersection Area, Pabna, Bangladesh. In Proceeding of the International Conference on Planning, Architecture and Civil Engineering, Bangladesh (pp. 1-6). |
| [12] | Fahim, A. U., Rahman, M. M., Abir, F. A., & Bhuiyan, M. A. F. (2022). An investigation of users’ perception on non-motorized transport services in a municipality area: A cross-sectional study on Pabna municipality. Case studies on transport policy, 10(1), 657-663. |
| [13] | McDougall, G. H., & Levesque, T. (2000). Customer satisfaction with services: putting perceived value into the equation. Journal of services marketing, 14(5), 392-410. |
| [14] | Allen, J., Bellizzi, M. G., Eboli, L., Forciniti, C., & Mazzulla, G. (2020). Service quality in a mid-sized air terminal: A SEM-MIMIC ordinal probit accounting for travel, sociodemographic, and user-type heterogeneity. Journal of Air Transport Management, 84, 101780. |
| [15] | Naveen, B. R., & Gurtoo, A. (2020). The cause effect relationship model of service quality in relation with overall satisfaction. Transportation Research Procedia, 48, 1694-1721. |
| [16] | Sam, E. F., Hamidu, O., & Daniels, S. (2018). SERVQUAL analysis of public bus transport services in Kumasi metropolis, Ghana: Core user perspectives. Case studies on transport policy, 6(1), 25-31. |
| [17] | Deb, S., & Ahmed, M. A. (2018). Determining the service quality of the city bus service based on users’ perceptions and expectations. Travel Behaviour and Society, 12, 1-10. |
| [18] | Sarkar, P. P., & Mallikarjuna, C. (2018). Effect of perception and attitudinal variables on mode choice behavior: A case study of Indian city, Agartala. Travel Behaviour and Society, 12, 108-114. |
| [19] | Mostafa Mohammed, A. M., & Mahmoud, A. S. (2024). Promoting Active Transportation in Egyptian Universities: Assiut University as a Case Study. Sohag Engineering Journal, 4(2), 156-177. |
| [20] | Jomnonkwao, S., Champahom, T., & Ratanavaraha, V. (2020). Methodologies for determining the service quality of the intercity rail service based on users’ perceptions and expectations in Thailand. Sustainability, 12(10), 4259. |
| [21] | Allen, J., Eboli, L., Forciniti, C., Mazzulla, G., & de Dios Ortúzar, J. (2019). The role of critical incidents and involvement in transit satisfaction and loyalty. Transport policy, 75, 57-69. |
| [22] | De Oña, J., De Oña, R., Eboli, L., & Mazzulla, G. (2013). Perceived service quality in bus transit service: a structural equation approach. Transport Policy, 29, 219-226. |
| [23] | Babin, B. J., Hair, J. F., & Boles, J. S. (2008). Publishing research in marketing journals using structural equation modeling. Journal of marketing theory and practice, 16(4), 279-286. |
| [24] | Ha, S. T., Ibrahim, W. H. W., Lo, M. C., & Mah, Y. S. (2019). Factors affecting satisfaction and loyalty in public transport using partial least squares structural equation modeling (PLS-SEM). transport, 10, 60. |
| [25] | Farooq, M. S., Salam, M., Fayolle, A., Jaafar, N., & Ayupp, K. (2018). Impact of service quality on customer satisfaction in Malaysia airlines: A PLS-SEM approach. Journal of Air Transport Management, 67, 169-180. |
| [26] | Nguyen-Phuoc, D. Q., Tran, A. T. P., Van Nguyen, T., Le, P. T., & Su, D. N. (2021). Investigating the complexity of perceived service quality and perceived safety and security in building loyalty among bus passengers in Vietnam-A PLS-SEM approach. Transport Policy, 101, 162-173. |
| [27] | Oña López, J. J. D., Oña López, R. D., Eboli, L., Forciniti, C., & Mazzulla, G. (2018). An ordered regression model to predict transit passengers’ behavioural intentions. URI: |
| [28] | Oña López, J. J. D., Estévez, E., & Oña López, R. D. (2020). Perception of Public Transport Quality of Service among Regular Private Vehicle Users in Madrid, Spain. URI: |
| [29] | Bordagaray, M., dell'Olio, L., Ibeas, A., & Cecín, P. (2014). Modelling user perception of bus transit quality considering user and service heterogeneity. Transportmetrica A: Transport Science, 10(8), 705-721. |
| [30] | Duleba, S., & Moslem, S. (2018). Sustainable urban transport development with stakeholder participation, an AHP-Kendall model: A case study for Mersin. Sustainability, 10(10), 3647. |
| [31] | Mandhani, J., Nayak, J. K., & Parida, M. (2021). Establishing service quality interrelations for Metro rail transit: Does gender really matter?. Transportation Research Part D: Transport and Environment, 97, 102888. |
| [32] | Díez-Mesa, F., de Oña, R., & de Oña, J. (2018). Bayesian networks and structural equation modelling to develop service quality models: Metro of Seville case study. Transportation Research Part A: Policy and Practice, 118, 1-13. |
| [33] | Mandhani, J., Nayak, J. K., & Parida, M. (2020). Interrelationships among service quality factors of Metro Rail Transit System: An integrated Bayesian networks and PLS-SEM approach. Transportation Research Part A: Policy and Practice, 140, 320-336. |
| [34] | Sarstedt, M., Ringle, C. M., Cheah, J. H., Ting, H., Moisescu, O. I., & Radomir, L. (2020). Structural model robustness checks in PLS-SEM. Tourism Economics, 26(4), 531-554. |
| [35] | Tanwar, R., & Agarwal, P. K. (2024). Analysis of the determinants of service quality in the multimodal public transport system of Bhopal city using structural equation modelling (SEM) and factor analysis. Expert Systems with Applications, 256, 124931. |
| [36] | Gunzler, D., Chen, T., Wu, P., & Zhang, H. (2013). Introduction to mediation analysis with structural equation modeling. Shanghai archives of psychiatry, 25(6), 390. |
| [37] | DeFrancisco, J., Harb, R., & Radwan, E. (2014). Evaluation of a carpooling program in a university setting using a stated preference survey (No. 14-0730). |
| [38] | Bamberg, S. (2003). Choice of Travel Mode in Theory of Planned Behavior. The Roles of Past Behavior, Habit, and Reasoned Action, Basic and Applied Social Psychology, 25(3), 275-287. |
| [39] | Shannon, T., Giles-Corti, B., Pikora, T., Bulsara, M., Shilton, T., & Bull, F. (2006). Active commuting in a university setting: Assessing commuting habits and potential for modal change. Transport Policy, 13(3), 240-253. |
| [40] | Eboli, L., & Mazzulla, G. (2012). Performance indicators for an objective measure of public transport service quality. |
| [41] | Morton, C., Caulfield, B., & Anable, J. (2016). Customer perceptions of quality of service in public transport: Evidence for bus transit in Scotland. Case Studies on Transport Policy, 4(3), 199-207. |
| [42] | Diab, E. I., & El-Geneidy, A. M. (2012). Understanding the impacts of a combination of service improvement strategies on bus running time and passenger’s perception. Transportation Research Part A: Policy and Practice, 46(3), 614-625. |
| [43] | Whalen, K. E., Páez, A., & Carrasco, J. A. (2013). Mode choice of university students commuting to school and the role of active travel. Journal of Transport Geography, 31, 132-142. |
| [44] | Boyd, B., Chow, M., Johnson, R., & Smith, A. (2003). Analysis of effects of fare-free transit program on student commuting mode shares: BruinGo at University of California at Los Angeles. Transportation Research Record, 1835(1), 101-110. |
| [45] | Danaf, M., Abou-Zeid, M., & Kaysi, I. (2014). Modeling travel choices of students at a private, urban university: Insights and policy implications. Case studies on transport policy, 2(3), 142-152. |
| [46] | Rahman, M. M. (2024). Passenger Satisfaction of Public Bus Services: A Case Study on Chandra-Hemayetpur Route in Savar. The Jahangirnagar Review, Part II: Social Sciences, 48(1), 43-67. |
| [47] | Paul, B., Rahman, M. M. and Sharmin, S. (2024). Service Quality and Performance of Easy Bikes: A Comparative Study with Local Transport Systems in Manikganj Municipality. Journal of Transportation Engineering and Traffic Management, 5(3), 36-57. |
| [48] | Pramanik, M. A., Rahman, M. S., Fahim, A. U., Rahman, M. M. (2024). Prospects and Challenges of E-Rickshaws in Urban Transportation Systems of Bangladesh: A Case Study of Rangpur City Corporation. American Journal of Traffic and Transportation Engineering, 9(2), 29-40. |
| [49] | Jamil, M. Y., Rahman, M. M. & Sharmin, S. (2021). Accident Hotspot Identification using Geometric Problems and Characteristics in Selected Road of the Dhaka-Aricha Highway (N5). Journal of Transportation Engineering and Traffic Management, 2(3), 1-17. |
| [50] | Akter, J., Shawon, M. T. A. and Rahman, M. M. (2021). Urban Density Influence on Travel and Mode choice Behavior of Savar Municipality: Household Survey Study. Journal of Transportation Engineering and Traffic Management, 2(2), 1-20. |
| [51] | Rahman, M. M. and Kabir, M. H. (2021). Mode Choice Behavior Modeling and Discovering Public Preferences for Office Trip: A Case Study in Uttara Satellite Town. Journal of Interior Designing and Regional Planning, 6(1), 34-46. |
| [52] | Rahman, M. M. and Kabir, M. H. (2021). Office Trip Comfort Perception Based on Passenger Travel Behavior: A Case Study in Uttara Satellite Town. Journal of Transportation Engineering and Traffic Management, 2(1), 1-13. |
| [53] | Sharif, M. S., Rahman, M. M. and Morshed, N. (2014). Traffic Emissions and Related Health Problems in Dhaka City: A Literature Review. Jahangirnagar University Planning Review, 12, 91-99. |
| [54] |
Khan, A. and Rahman, M. M. (2019). Road Management System (RMS) for a Neighborhood. 1st International Conference on Urban and Regional Planning, 417-424.
http://bip.org.bd/SharingFiles/journal_book/upload_content/201912270424103.pdf |
| [55] | Rahman, M. M. and Ritu, S. (2018). An Analysis of Corridor Planning to Enhance the Multimodal Service: Case Study of ‘Gabtoli to Farmgate’ Route. The Jahangirnagar Review, Part II: Social Sciences, 39, 91-103. |
APA Style
Sultana, S., Das, T., Limon, M. M. H., Islam, M., Rahman, M. M. (2025). A Comprehensive Assessment of University Transport Services at Pabna University of Science and Technology (PUST). American Journal of Traffic and Transportation Engineering, 10(2), 48-61. https://doi.org/10.11648/j.ajtte.20251002.12
ACS Style
Sultana, S.; Das, T.; Limon, M. M. H.; Islam, M.; Rahman, M. M. A Comprehensive Assessment of University Transport Services at Pabna University of Science and Technology (PUST). Am. J. Traffic Transp. Eng. 2025, 10(2), 48-61. doi: 10.11648/j.ajtte.20251002.12
@article{10.11648/j.ajtte.20251002.12,
  author = {Sadia Sultana and Tonusree Das and Md. Mahmudul Hasan Limon and Monirul Islam and Mohammad Mizanur Rahman},
  title = {A Comprehensive Assessment of University Transport Services at Pabna University of Science and Technology (PUST)
},
  journal = {American Journal of Traffic and Transportation Engineering},
  volume = {10},
  number = {2},
  pages = {48-61},
  doi = {10.11648/j.ajtte.20251002.12},
  url = {https://doi.org/10.11648/j.ajtte.20251002.12},
  eprint = {https://article.sciencepublishinggroup.com/pdf/10.11648.j.ajtte.20251002.12},
  abstract = {Efficient and accessible transportation services are crucial for facilitating smooth travel for students on university campuses. This study offers a thorough evaluation of the transportation services at Pabna University of Science and Technology (PUST), seeking to identify the primary factors affecting student satisfaction and preferences for travel modes. The study utilizes data gathered from 370 students using structured questionnaires, employing Structural Equation Modelling (SEM) and Confirmatory Factor Analysis (CFA) to assess the correlations between service quality features and student satisfaction. Significant data indicate that 54.9% of students prioritize cost-effectiveness as the foremost reason for utilizing the service, whereas 36.5% identify overcrowding and 31.6% emphasize inadequate seating space as substantial obstacles to usage. The Geographic Information System (GIS) study delineated service coverage, pinpointing accessibility deficiencies, especially in locales such as Bottola and Arifpur, where pupils encounter extended walking distances to bus stops. Structural Equation Modeling (SEM) and Confirmatory Factor Analysis (CFA) were utilized to examine latent variables, revealing substantial correlations between service quality attributes (e.g., safety, driver conduct) and student satisfaction. The model fit indices (RMSEA = 0.072, CFI = 0.904) affirmed strong statistical validity. Although there was reasonable satisfaction with travel speed (Mean = 3.48) and safety (Mean = 3.49), significant shortcomings were observed in seat availability (Mean = 2.20) and fleet size (Mean = 2.08). Only 39.2% of students employed GPS tracking, signifying restricted use of technology solutions. Student feedback highlighted the necessity for augmented bus frequency (44.3%) and expanded routes (18.6%) to improve service effectiveness. The study emphasizes the importance of data-driven planning and the improvement of transport services to achieve enhanced inclusivity, reliability, and user satisfaction. Its findings provide actionable insights for university authorities to optimize resource allocation and enhance the efficiency and accessibility of campus transport systems.
},
 year = {2025}
}
TY  - JOUR
T1  - A Comprehensive Assessment of University Transport Services at Pabna University of Science and Technology (PUST)

AU  - Sadia Sultana
AU  - Tonusree Das
AU  - Md. Mahmudul Hasan Limon
AU  - Monirul Islam
AU  - Mohammad Mizanur Rahman
Y1  - 2025/06/06
PY  - 2025
N1  - https://doi.org/10.11648/j.ajtte.20251002.12
DO  - 10.11648/j.ajtte.20251002.12
T2  - American Journal of Traffic and Transportation Engineering
JF  - American Journal of Traffic and Transportation Engineering
JO  - American Journal of Traffic and Transportation Engineering
SP  - 48
EP  - 61
PB  - Science Publishing Group
SN  - 2578-8604
UR  - https://doi.org/10.11648/j.ajtte.20251002.12
AB  - Efficient and accessible transportation services are crucial for facilitating smooth travel for students on university campuses. This study offers a thorough evaluation of the transportation services at Pabna University of Science and Technology (PUST), seeking to identify the primary factors affecting student satisfaction and preferences for travel modes. The study utilizes data gathered from 370 students using structured questionnaires, employing Structural Equation Modelling (SEM) and Confirmatory Factor Analysis (CFA) to assess the correlations between service quality features and student satisfaction. Significant data indicate that 54.9% of students prioritize cost-effectiveness as the foremost reason for utilizing the service, whereas 36.5% identify overcrowding and 31.6% emphasize inadequate seating space as substantial obstacles to usage. The Geographic Information System (GIS) study delineated service coverage, pinpointing accessibility deficiencies, especially in locales such as Bottola and Arifpur, where pupils encounter extended walking distances to bus stops. Structural Equation Modeling (SEM) and Confirmatory Factor Analysis (CFA) were utilized to examine latent variables, revealing substantial correlations between service quality attributes (e.g., safety, driver conduct) and student satisfaction. The model fit indices (RMSEA = 0.072, CFI = 0.904) affirmed strong statistical validity. Although there was reasonable satisfaction with travel speed (Mean = 3.48) and safety (Mean = 3.49), significant shortcomings were observed in seat availability (Mean = 2.20) and fleet size (Mean = 2.08). Only 39.2% of students employed GPS tracking, signifying restricted use of technology solutions. Student feedback highlighted the necessity for augmented bus frequency (44.3%) and expanded routes (18.6%) to improve service effectiveness. The study emphasizes the importance of data-driven planning and the improvement of transport services to achieve enhanced inclusivity, reliability, and user satisfaction. Its findings provide actionable insights for university authorities to optimize resource allocation and enhance the efficiency and accessibility of campus transport systems.

VL  - 10
IS  - 2
ER  -
Urban and Regional Planning, Pabna University of Science and Technology (PUST), Pabna, Bangladesh;Institute of Remote Sensing and GIS, Jahangirnagar University, Savar, Dhaka, Bangladesh
Urban and Regional Planning, Pabna University of Science and Technology (PUST), Pabna, Bangladesh
Urban and Regional Planning, Pabna University of Science and Technology (PUST), Pabna, Bangladesh;Institute of Remote Sensing and GIS, Jahangirnagar University, Savar, Dhaka, Bangladesh
Institute of Remote Sensing and GIS, Jahangirnagar University, Savar, Dhaka, Bangladesh
Department of Urban and Regional Planning, Jahangirnagar University, Savar, Dhaka, Bangladesh
Information