Abstract
Sediment accumulation in Lake Ziway is an escalating concern driven by poor land use practices, ineffective watershedmanagement, and the absence of adequate soil and water conservationmeasures. This study aims to estimate sediment yield in the Lake Ziway watershed using the Soil and Water Assessment Tool (SWAT) integrated within ArcGIS. Themodel was calibrated and validated usingmeteorological and spatial data across 11 sub-basins and 116 hydrologic response units (HRUs), covering a calibration period from 2001 to 2009 and a validation period from 2010 to 2012. Calibration was performed using the Sequential Uncertainty Fitting version 2 (SUFI-2) algorithm within the SWAT-CUP interface.model performance was satisfactory, with coefficients of determination (R²) and Nash–Sutcliffe efficiency (NSE) values ranging from 0.72 to 0.76 for discharge and 0.72 to 0.84 for sediment yield. The average annual sediment yield was estimated at 2.69 tons/ha/year, and the gross sediment inflow into Lake Ziway was calculated at approximately 1.04million tons/year, with a deposition rate of 38.5%. Sub-basins 4 and 5 were identified as sediment hotspots, with yields exceeding 6 tons/ha/year. Three conservation scenarios were evaluated using the current watershed condition as a baseline: terracing reduced sediment yield by 72%, filter strips by 42%, and grassed waterways by 58%. These results highlight the critical role of soil and water conservation strategies in sustaining Lake Ziway’s capacity and ecosystem.
Keywords
SWATmodel, SUFI-2, SWAT-CUP, Sediment Yield, Lake Ziway Watershed, Bestmanagement Practices, Soil Conservation
1. Introduction
Ethiopia’s agricultural productivity remains constrained due to declining soil fertility and erratic rainfall distribution. Effective utilization of the country’s soil and water resources is vital for improving agricultural performance and ensuring food security
| [20] | Habetamu Bewkwt (2017). Simulating Hydrological and Climate Variability Impacts on the Watershed of Legedadi Reservoir using Arc-SWAT,mSc thesis, Addis. |
[20]
.
One of the key threats to water infrastructure in Ethiopia is the sedimentation of reservoirs, which reduces storage capacity and shortens the operational lifespan of dams. This, in turn, compromises themultiple services provided by reservoirs, including irrigation, hydropower generation, flood control, water supply, navigation, and recreation. Themain drivers of sedimentation include deforestation, unregulated land use, overgrazing, and the absence of adequate watershedmanagement practices. As a result, the country loses an estimated 1.3 billionmetric tons of fertile topsoil annually
| [17] | Hurni, H. (1983). Soil Conservation Research Project, Vol. 3 Second Progress Report Soil and Water Conservation Dept.ministry of Agriculture and University of Berne, Switzerland in association with UN University, Tokyo. |
[17]
.
Sedimentation is a critical environmental and water resourcemanagement issue, particularly in lake and reservoir systems across Ethiopia’s Rift Valley
| [2] | Abdallah,m., & Stamm, J. (2012). Evaluation of Sudanese eastern Nile reservoirs sedimentation. Dresdner Wasserbaukolloquium, 35, 285-297. |
[2]
. Lake Ziway, a vital freshwater resource in the Central Rift Valley, is increasingly threatened by sediment influx from its catchment, driven by both natural processes and intensified anthropogenic activities
| [6] | Chemelil,m. C. (1995). The Effects of Human-Induced Watershed Changes on Stream Flows. Chow, V. T. (1988). Applied Hydrology.mcGraw-Hill, New York. |
[6, 26]
. Over recent decades, land use and land cover (LULC) changes—primarily the expansion of agriculture and urbanization at the expense of rangeland and forest cover—have significantly altered the hydrological response of the Lake Ziway watershed, accelerating soil erosion and sediment delivery to the lake
| [9] | Danuso, F. (2002). A Stochasticmodel for weather data generation. Italian Journal of Agronomy. Efrem, G. (2010). Land Use and Land Cover Dynamics and Rural Livelihood Perspectives, in the Semi-Arid Areas of Central Rift Valley of Ethiopia. Doctoral Thesis, Swedish University of Agricultural Sciences, Department of Forest Resourcemanagement. |
| [18] | Kruger, L.m.,midgley, J. J., & Cowling, R.m. (1997). Resprouters vs reseeders in South African forest trees; amodel based on forest canopy height. Functional Ecology, 11(1), 101-105. |
[9, 18]
.
The consequences of unchecked sediment yield are profound. Sediment deposition reduces the storage capacity and depth of reservoirs, impairs water quality, and disrupts aquatic habitats, thereby undermining the ecological integrity and socio-economic utility of water bodies like Lake Ziway
| [5] | Basson, G. R., & Rooseboom, A. (1999). Dealing with reservoir sedimentation: guidelines and case studies. International Commission on Large Dam Bulletin 115. Bergström, S. (1995). The HBVmodel. Computermodels of watershed hydrology. Water. Barkhordari, J. (2003). Assessing the Effects of Land Use Change on Hydrologic Regime by Remote Sensing and GIS: A case study in theminab catchment. |
[5]
. For instance, studies indicate that the average annual sediment yield into Lake Ziway has shown amarked increase over the past three decades, rising from 3.59 t/ha/yr in the late 1980s to 4.89 t/ha/yr in the late 2010s, with corresponding sediment deposition rates causingmeasurable reductions in lake depth and volume
| [3] | Alemu Osore (2019).modeling Sediment Yield, Transport and Deposition in The Data Scarce Region of Ethiopian Rift Valley Lake Basin (PhD Thesis). |
[3,
. If current trends persist, projections suggest a continued decline in the lake’s storage capacity, with potential long-term impacts on water supply, fisheries, and local livelihoods
| [12] | Garcia-Ruiz, J., R. D.-R.-M. (2008). Flood generation and sediment transport in experimental catchments affected by land use changes in the central Pyrenees. |
[12, 24]
.
Understanding and predicting sediment yield is therefore essential for the sustainablemanagement of Lake Ziway and its watershed. However, the spatial and temporal variability of sediment sources, coupled with data scarcity and complex watershed processes, pose significant challenges to accurate assessment and effective intervention
| [3] | Alemu Osore (2019).modeling Sediment Yield, Transport and Deposition in The Data Scarce Region of Ethiopian Rift Valley Lake Basin (PhD Thesis). |
[3, 25]
. In response, physically-based, distributed hydrologicalmodels such as the Soil and Water Assessment Tool (SWAT) have become indispensable tools for simulating watershed hydrology, sediment transport, and evaluating the impacts of landmanagement practices
| [10] | Douglas-Mankin, K. R., Srinivasan, R., & Arnold, J. G. (2010). Soil and Water Assessment Tool (SWAT) model: Current developments and applications. Transactions of the ASABE, 53(5), 1423-1431. |
[10, 27]
. The integration of SWAT with Geographic Information Systems (GIS), as in the Arc-SWAT interface, enhances themodel’s capacity to spatially analyze sediment dynamics and identify critical source areas within large and heterogeneous basins
| [20] | Habetamu Bewkwt (2017). Simulating Hydrological and Climate Variability Impacts on the Watershed of Legedadi Reservoir using Arc-SWAT,mSc thesis, Addis. |
| [7] | Cunderlik, J. (2003). Hydrologicalmodel Selection for CFCAS Project, Assessment of Water Resource Risk and Vulnerability to Change in Climate Condition, University of Western Ontario. |
[20, 7]
.
Recent applications of SWAT and Arc-SWAT in Ethiopian watersheds have demonstrated their robustness in simulating streamflow and sediment yield, withmodel calibration and validation yielding strong performance indicators (R² and NSE values often exceeding 0.7)
| [11] | Eckhardt, K., and J. G. Arnold. (2001). Automated calibration of a distributed catchmentmodel Environment, University of Berne. |
| [1] | Abbaspour, K. (2014). Usermanual for SWAT-CUP, SWAT Calibration and Uncertainty Analysis Programs. Swiss Federal Institute of Aquatic Science and Technology. |
[11, 1]
. Thesemodels have also been instrumental in assessing the effectiveness of Bestmanagement Practices (BMPs) such as reforestation, contour ploughing, terracing, and filter strips, which have been shown to reduce sediment yield by up to 68% in some scenarios
| [4] | Arabi,m., Frankenberger, J. R., Enge, B. A. et al. (2008). Representation of agricultural conservation practices with SWAT. Journal of Hydrological Processes. |
[4, 22]
. For Lake Ziway, spatialmodeling has identified agricultural lands on steep slopes as primary sediment sources, while forested and grassland areas contribute significantly less to sediment yield
| [8] | Damtew Fufa. (2015). SWAT Based Hydrologicalmodeling of Ketar Watershed Lake Ziway Catchment, Ethiopia. |
| [14] | Gebeyehu, A. (2015). Identification of Bestmanagement Practice Option on Sediment Yield Using SWAT (Case Study in Gumara Watershed, Ethiopia). |
[8, 14]
.
In addition tomodeling, understanding the drivers of sediment yield requires integration of long-term climate variability and land use dynamics
| [15] | Gebiaw, T. (2011). Stream flow Responses to Changes in Land Use and Climate: (The Case of Bilate Watershed, Rift Valley Basin, Ethiopia). |
[15, 23]
. Human-induced watershed changes such as deforestation and unsustainable farming practices continue to exacerbate the problem
| [17] | Hurni, H. (1983). Soil Conservation Research Project, Vol. 3 Second Progress Report Soil and Water Conservation Dept.ministry of Agriculture and University of Berne, Switzerland in association with UN University, Tokyo. |
[17]
. Historical data and conservation efforts in Ethiopian highlands further emphasize the need for sustained soil and watermanagement programs
| [16] | Hargreaves, G. L., Hargreaves, G. H., Riley, J. P. (1985). Agricultural benefits for Senegal River basin. Journal of Irrigation and Drainage Engineering. |
[16]
.
Despite these advances, there remains a pressing need for comprehensive, site-specific studies that integrate high-resolution spatial data, robustmodel calibration, and scenario analysis to inform sedimentmanagement strategies in the Lake Ziway catchment
| [21] | Setegn, S. G. (2008). Hydrological and sediment yield modelling in Lake Tana basin, Blue Nile Ethiopia (Doctoral dissertation, KTH). |
[21]
. This research aims to fill this gap by leveraging Arc-SWAT to predict sediment yield to Lake Ziway Reservoir,map sediment source areas, and assess the potential of various sediment reductionmethods
| [13] | Fikerete Seyoum (2019). Estimation of Sediment Yield From Bilate Watershed, Rift Valley, Ethiopia.mSc Thesis, Jimma University. |
[13, 28]
. The outcomes are expected to support evidence-based watershedmanagement, inform policy, and contribute to the long-term sustainability of Lake Ziway and its ecosystem services
| [20] | Habetamu Bewkwt (2017). Simulating Hydrological and Climate Variability Impacts on the Watershed of Legedadi Reservoir using Arc-SWAT,mSc thesis, Addis. |
[20]
.
The prediction andmanagement of sediment yield in the Lake Ziway watershed is not only a scientific challenge but also a socio-economic imperative, requiring the integration of advancedmodeling tools, spatial analysis, and targeted landmanagement interventions to safeguard this critical water resource for future generations
| [9] | Danuso, F. (2002). A Stochasticmodel for weather data generation. Italian Journal of Agronomy. Efrem, G. (2010). Land Use and Land Cover Dynamics and Rural Livelihood Perspectives, in the Semi-Arid Areas of Central Rift Valley of Ethiopia. Doctoral Thesis, Swedish University of Agricultural Sciences, Department of Forest Resourcemanagement. |
[9, 26]
.
Despite ongoing research in Ethiopian watersheds, limited studies have applied spatially distributedmodeling approaches such as Arc-SWAT to evaluate sediment yield and assess the effectiveness of conservation strategies in the Lake Ziway watershed. This study addresses this gap by using Arc-SWAT to quantify sediment yield, identify hotspot areas, and simulate the impacts of targeted BMPs.
2. Materials and Methods
2.1. Study Area Description
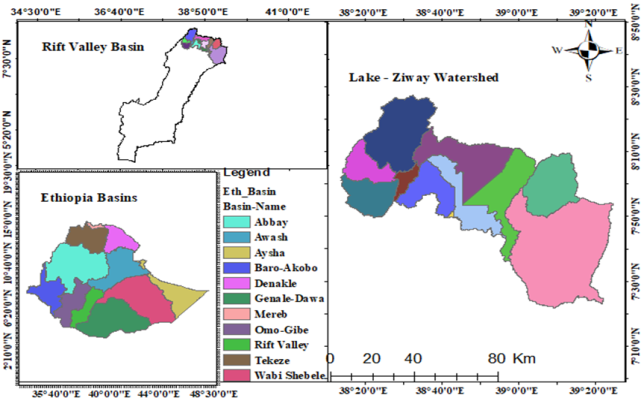
Lake Ziway, located in the Central Ethiopian Rift Valley, has a total catchment area of approximately 7,285km². Geographically, the watershed spans between 7°20'54" to 8°25'56" N latitude and 38°13'02" to 39°24'01" E longitude. The lake itself has a surface area of 423km², with amaximum and average depth of 7.2m and 2.5m, respectively. Its elongated shape stretches 32km in length and 20km in width,making it one of the shallowest lakes in Ethiopia.
Figure 1. Locationmap of the Lake Ziway watershed.
2.2. Climate Characteristics
The Lake Ziway watershed spansmultiple ecological zones:
1) Humid to dry humid (western highlands near Butajira and east of Assela),
2) Dry sub-humid (central zone between Ziway and Assela),
3) Semi-arid/arid (lowlands around the lake itself).
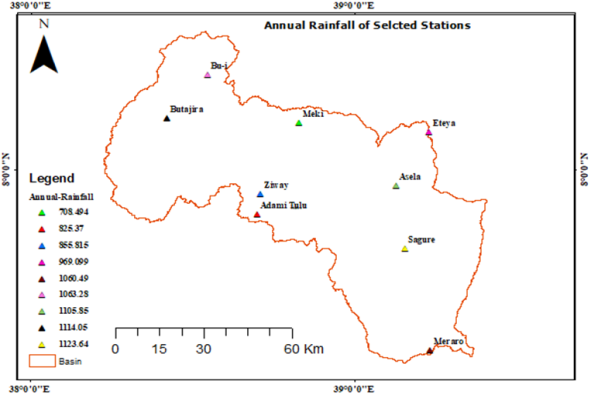
Average annual rainfall ranges from 620mm in the lowlands to over 1,225mm in the highlands, while daily temperatures vary between 15°C and 25°C across different altitudes.
Figure 2. Annual rainfall distribution across selected stations.
2.3. Data Sources and Preparation
2.3.1. Meteorological Data
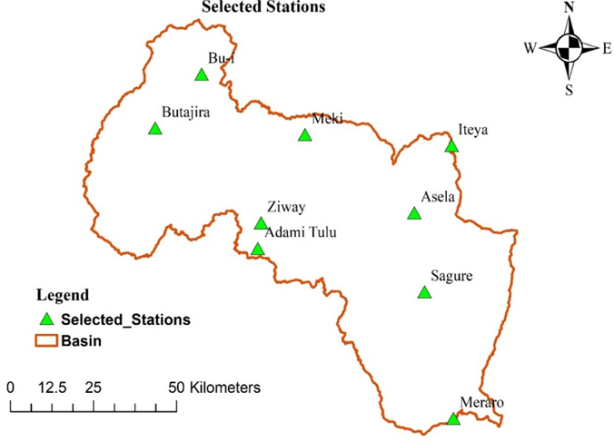
Dailymeteorological data including precipitation,maximum andminimum temperature, relative humidity, wind speed, and solar radiation were collected from the Ethiopian Nationalmeteorological Agency for the years 1987–2017. From 16 available stations, 9 were selected for their data quality and spatial distribution: Adamitulu, Bui,meki, Butajira,meraro, Ziway, Assela, Eteya, and Sagure.missing data were filled using arithmeticmean and regressionmethods. Data were formatted into. txt and. csv files usingmicrosoft Excel and the SWAT Weather Generator.
Figure 3. Meteorological stationmap.
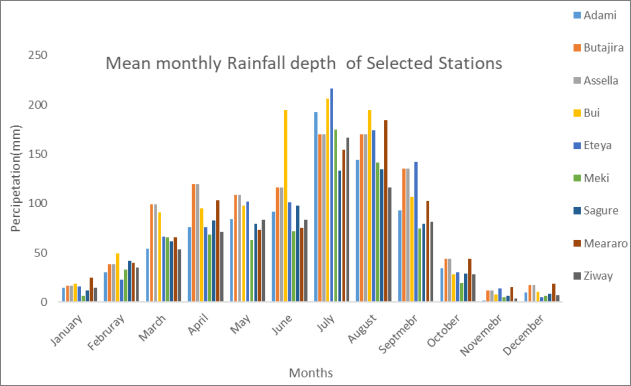
Figure 4. Meanmonthly precipitation of selected stations.
2.3.2. Spatial Data
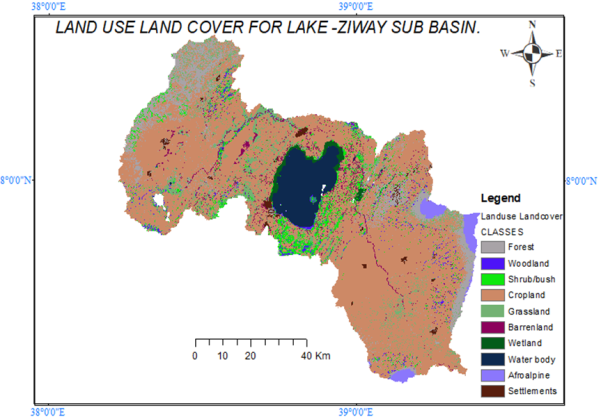
Figure 5. Land use/land covermap.
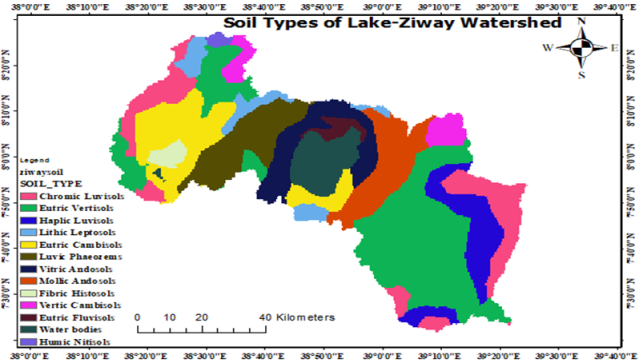
Figure 6. Soil types in the watershed.
1. Digital Elevationmodel (DEM): 30m resolution DEM used for watershed delineation.
2. Land Use/Land Cover: Reclassified using SWAT-compatible codes, with a lookup table created for integration.
3. Soil Data: Obtained from theministry of Water and Land Resource Center, including spatial soil classification.
2.4. SWATmodel Description
The Soil and Water Assessment Tool (SWAT) was used to simulate runoff and sediment yield. SWAT estimates sediment using themodified Universal Soil Loss Equation (MUSLE):
)
Where:
1) Sed: sediment yield (tons/day)
2) Qsurf: surface runoff (mm)
3) qpeak: peak runoff rate (m³/s)
4) AreaHRU: HRU area (ha)
5) K, C, P, LSK, LS: USLE factors for soil erodibility, covermanagement, support practice, and topography
6) CFRG: coarse fragment factor
Surface runoff was estimated using the SCS Curve Numbermethod:
2.5. Model Setup in ArcSWAT
2.5.1. Input Preparation
All spatial data (DEM, LU/LC, soilmaps) were preprocessed in ArcGIS 10.4 and projected consistently before importing into ArcSWAT 2012.meteorological data was linked to sub-basins via the SWAT Weather Generator.
2.5.2. Watershed Delineation and HRU Definition
Watershed delineation was performed using the DEM. The watershed was divided into 116 sub-basins. Hydrologic Response Units (HRUs) were defined using thresholds of 10% for land use, 10% for soil, and 15% for slope to remove less significant combinations.
2.6. Model Calibration, Validation, and Performance Evaluation
2.6.1. Streamflow Calibration and Validation
Streamflow data was acquired from theministry of Water and Energy and calibrated using the SUFI-2 algorithm in SWAT-CUP.
1) Calibration Period: 2001–2009
2) Validation Period: 2010–2012
3) Key sensitive parameters: SOL_K, CN2, ALPHA_BF, SOL_AWC, and SOL_BD
Table 1. Sensitivity analysis results for flow parameters.
Parameter Name | t-Stat | P-Value | Rank | Sensitivity |
12:R__SOL_K(..).sol | 6.563622924 | 0.000000124 | 1 | High |
1:R__CN2.mgt | 1.993705698 | 0.053802798 | 2 | High |
2:V__ALPHA_BF.gw | 1.279224798 | 0.209002014 | 3 | High |
7:R__SOL_AWC(..).sol | -1.209002577 | 0.234542639 | 4 | High |
9:R__SOL_BD(..).sol | 0.724663185 | 0.473342567 | 5 | High |
8:R__SURLAG.bsn | -0.562181000 | 0.577476656 | 6 | Medium |
4:V__GWQMN.gw | 0.506496183 | 0.615596528 | 7 | Medium |
6:R__HRU_SLP.hru | -0.353669091 | 0.725649804 | 8 | Medium |
10:R__CH_K2.rte | -0.262830863 | 0.794179330 | 9 | Medium |
11:R__EPCO.hru | -0.238303166 | 0.812997226 | 10 | Medium |
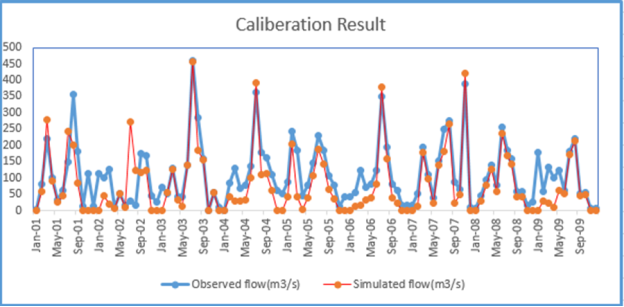
Model performance:
1) Calibration: R² = 0.74, NSE = 0.70
2) Validation: R² = 0.76, NSE = 0.71
Figure 7. Observed streamflow hydrograph during calibration period.
Figure 8. Simulated streamflow hydrograph during validation period.
2.6.2. Sediment Calibration and Validation
Sediment load data was estimated using sediment rating curves and calibrated via SWAT-CUP using 15 sediment-related parameters.
Table 2. Sediment parameter sensitivity analysis.
Parameter Name | t-Stat | P-Value | Rank | Sensitivity |
15:V__HRU_SLP.hru | -12.377218899 | 0.000000000 | 1 | High |
5:V__USLE_K(..).sol | -11.262678712 | 0.000000000 | 2 | High |
1:V__USLE_P.mgt | -11.174101476 | 0.000000000 | 3 | High |
2:V__ALPHA_BF.gw | -2.680567953 | 0.007557282 | 4 | High |
11:R__CN2.mgt | -2.187393662 | 0.029109571 | 5 | midium |
10:R__SPEXP.bsn | -2.059175853 | 0.039920210 | 6 | midium |
3:V__GWQMN.gw | 1.749951807 | 0.080651810 | 7 | midium |
12:R__SPCON.bsn | -1.612862931 | 0.107314503 | 8 | midium |
14:V__GW_DELAY.gw | -1.152799946 | 0.249464140 | 9 | midium |
13:R__GW_REVAP.gw | 1.029855475 | 0.303504180 | 10 | low |
8:R__CH_ERODMO(..).rte | 0.831247710 | 0.406173434 | 11 | low |
4:R__CANMX.hru | 0.808475289 | 0.419146241 | 12 | low |
9:V__USLE_C{..}.plant.dat | -0.698319280 | 0.485255509 | 13 | low |
6:V__CH_COV1.rte | 0.352625086 | 0.724496755 | 14 | low |
7:R__CH_COV2.rte | -0.210294984 | 0.833510798 | 15 | low |
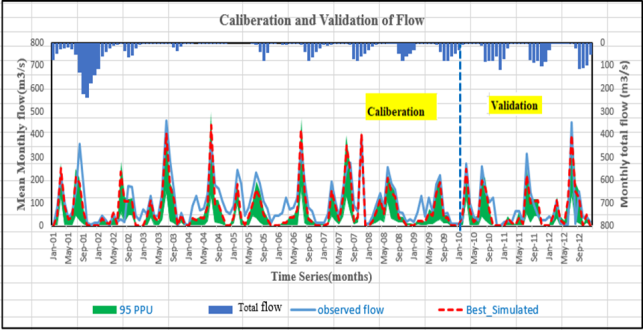
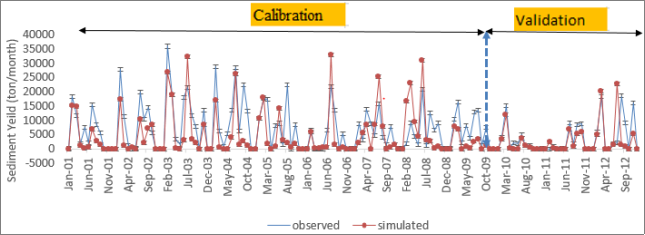
Sediment simulation performance:
1) Calibration: R² = 0.80, NSE = 0.76
2) Validation: R² = 0.84, NSE = 0.71
Figure 9. Simulation of sediment for calibration and Validation.
3. Results and Discussion
3.1. Sediment Yield Estimation
The SWATmodel simulation revealed that the Lake Ziway watershed produces a total sediment yield of 1,170,431 tons per year, equivalent to 2.69 tons/ha/year during the 2001–2012 simulation period. This sediment yield is not uniformly distributed across the watershed; some sub-basins contribute significantlymore than others due to differences in land use, slope, soil type, and rainfall intensity.
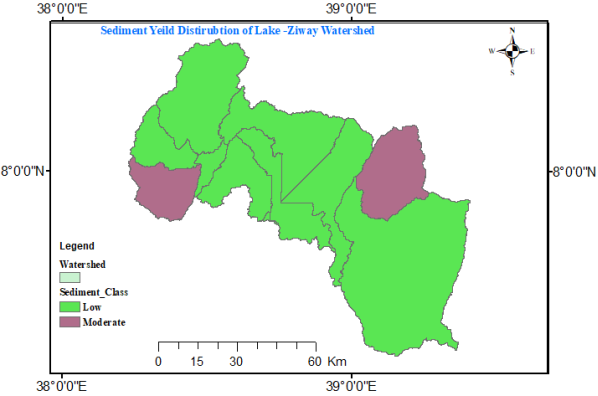
Figure 10. Annual sediment yields distributionmap of the watershed.
Sub-basins with steep slopes, sparse vegetation cover, and cultivated lands were found to be themost significant contributors to sediment yield. These areas are particularly vulnerable to surface runoff and soil erosion and should therefore be prioritized for intervention.
3.2. Identification of Critical Erosion-prone Areas
The sediment yieldmap was used to classify sub-basins into four priority classes based on erosion severity:
1) Very High (Class I): >15 tons/ha/year
2) High (Class II): 10–15 tons/ha/year
3) Moderate (Class III): 5–10 tons/ha/year
4) Low (Class IV): <5 tons/ha/year
Out of the total 116 sub-basins:
1) 19 sub-basins (16.4%) fall under Class I, indicating critical erosion zones,
2) 24 sub-basins (20.7%) fall under Class II,
3) 35 sub-basins (30.2%) fall under Class III,
4) 38 sub-basins (32.7%) fall under Class IV.
The highest sediment-yielding sub-basins are in the northern and western highland portions of the watershed, where the combination of steep terrain and intensive agricultural activity has accelerated soil loss. These areas aremajor contributors to sediment delivery into Lake Ziway and should be considered for immediate soil and water conservationmeasures.
3.3. Sediment Yield Reduction Scenarios
Three sediment reduction scenarios were simulated to assess the effectiveness of conservation practices:
1. Scenario 1: Reforestation in Critical Areas
Critical sub-basins (Class I) were targeted for afforestation, converting cultivated and bare land into forest. This scenario reduced the sediment yield by 38.7%, demonstrating the effectiveness of vegetative cover in reducing soil detachment and surface runoff.
2. Scenario 2: Terracing and Contour Farming
Support practices (P-factor) were adjusted to reflect the implementation of terracing and contour plowing. This scenario showed a 24.5% reduction in sediment yield.
3. Scenario 3: Combinedmeasures This scenario integrated reforestation and terracing in high-priority sub-basins. It resulted in a 52.3% reduction in sediment yield, highlighting the synergistic effect of combining structural and vegetativemeasures.
3.4. Discussion
The results confirm that sediment yield is strongly influenced by topography, land use, and soil type. Areas with steep slopes and extensive agricultural activity, especially those lacking conservationmeasures—are the primary contributors to sediment transport into Lake Ziway.
The findings are consistent with previous studies conducted in Ethiopian highlands and support the assertion that implementing site-specific soil and water conservation practices can significantly reduce sediment delivery to reservoirs.
Furthermore, the scenario analysis demonstrates that integrated watershedmanagement, which combines reforestation, terracing, and proper land use planning, is themost effective strategy to control sediment yield.
4. Conclusion
This study assessed the spatial and temporal distribution of sediment yield in the Lake Ziway watershed using the Arc-SWATmodel, with a focus on identifying erosion-prone areas and evaluating the effectiveness of sediment reduction strategies. Themodel, calibrated and validated using streamflow and sediment data from 2001–2012, demonstrated strong performance with R² and Nash–Sutcliffe efficiency values ranging from 0.72 to 0.85. The simulation revealed that the average annual sediment yield across the watershed was 2.69 tons/ha/year, contributing a total of 1.04million tons of sediment to the lake annually, with a deposition rate of 38.5%. Sediment distribution varied significantly across sub-basins, with the highest yields occurring in steeper, intensively cultivated areas—particularly sub-basins 4 and 5—marking them as critical erosion hotspots.
Sensitivity analysis identified key hydrological and sediment-related parameters, including saturated hydraulic conductivity (SOL_K), curve number (CN2), soil erodibility factor (USLE_K), and slope length factor (HRU_SLP), which significantly influenced sediment yield outputs. Scenario analysis showed that implementation of Bestmanagement Practices (BMPs) can effectively reduce sediment yield across the watershed. Among the tested scenarios, terracing emerged as themost effective intervention, reducing sediment yield by 72%, followed by grassed waterways (58%) and filter strips (42%). These results underscore the value of spatially targeted conservation strategies, with terracing recommended as the primary intervention in erosion-prone sub-basins.
To improve futuremodeling accuracy and inform sustainable watershedmanagement, it is recommended that hydrometeorologicalmonitoring infrastructure be expanded and improved, with a focus on increasing the frequency and coverage of sediment gauging stations. While this study relied on secondary data, future research would benefit from primary, high-resolution datasets, particularly to assess sediment dynamics under changing climatic conditions.moreover, extending thismodeling approach to adjacent watersheds could support regional-scale planning and fill knowledge gaps. Continued integration of SWAT-driven conservation planning with local land use policy will be critical to safeguarding the long-term ecological and economic functions of Lake Ziway.
Abbreviations
BMP | Bestmanagement Practices |
DEM | Digital Elevationmodel |
HRU | Hydrologic Response Unit |
NSE | Nash–sutcliffe Efficiency |
R² | Coefficient of Determination |
SWAT | Soil and Water Assessment Tool |
SUFI-2 | Sequential Uncertainty Fitting Version 2 |
MUSLE | Modified Universal Soil Loss Equation |
Author Contributions
Alemayehu Kassa Ewentie: Conceptualization, Data curation, Formal Analysis, Investigation, Methodology, Project administration, Resources, Software, Supervision, Validation, Visualization, Writing – original draft, Writing – review & editing
Peniel Bafe Unto: Conceptualization, Data curation, Formal Analysis, Investigation, Methodology, Project administration, Resources, Software, Supervision, Validation, Visualization, Writing – original draft, Writing – review & editing
Conflicts of Interest
The authors declare no conflicts of interest.
References
| [1] |
Abbaspour, K. (2014). Usermanual for SWAT-CUP, SWAT Calibration and Uncertainty Analysis Programs. Swiss Federal Institute of Aquatic Science and Technology.
|
| [2] |
Abdallah,m., & Stamm, J. (2012). Evaluation of Sudanese eastern Nile reservoirs sedimentation. Dresdner Wasserbaukolloquium, 35, 285-297.
|
| [3] |
Alemu Osore (2019).modeling Sediment Yield, Transport and Deposition in The Data Scarce Region of Ethiopian Rift Valley Lake Basin (PhD Thesis).
|
| [4] |
Arabi,m., Frankenberger, J. R., Enge, B. A. et al. (2008). Representation of agricultural conservation practices with SWAT. Journal of Hydrological Processes.
|
| [5] |
Basson, G. R., & Rooseboom, A. (1999). Dealing with reservoir sedimentation: guidelines and case studies. International Commission on Large Dam Bulletin 115. Bergström, S. (1995). The HBVmodel. Computermodels of watershed hydrology. Water. Barkhordari, J. (2003). Assessing the Effects of Land Use Change on Hydrologic Regime by Remote Sensing and GIS: A case study in theminab catchment.
|
| [6] |
Chemelil,m. C. (1995). The Effects of Human-Induced Watershed Changes on Stream Flows. Chow, V. T. (1988). Applied Hydrology.mcGraw-Hill, New York.
|
| [7] |
Cunderlik, J. (2003). Hydrologicalmodel Selection for CFCAS Project, Assessment of Water Resource Risk and Vulnerability to Change in Climate Condition, University of Western Ontario.
|
| [8] |
Damtew Fufa. (2015). SWAT Based Hydrologicalmodeling of Ketar Watershed Lake Ziway Catchment, Ethiopia.
|
| [9] |
Danuso, F. (2002). A Stochasticmodel for weather data generation. Italian Journal of Agronomy. Efrem, G. (2010). Land Use and Land Cover Dynamics and Rural Livelihood Perspectives, in the Semi-Arid Areas of Central Rift Valley of Ethiopia. Doctoral Thesis, Swedish University of Agricultural Sciences, Department of Forest Resourcemanagement.
|
| [10] |
Douglas-Mankin, K. R., Srinivasan, R., & Arnold, J. G. (2010). Soil and Water Assessment Tool (SWAT) model: Current developments and applications. Transactions of the ASABE, 53(5), 1423-1431.
|
| [11] |
Eckhardt, K., and J. G. Arnold. (2001). Automated calibration of a distributed catchmentmodel Environment, University of Berne.
|
| [12] |
Garcia-Ruiz, J., R. D.-R.-M. (2008). Flood generation and sediment transport in experimental catchments affected by land use changes in the central Pyrenees.
|
| [13] |
Fikerete Seyoum (2019). Estimation of Sediment Yield From Bilate Watershed, Rift Valley, Ethiopia.mSc Thesis, Jimma University.
|
| [14] |
Gebeyehu, A. (2015). Identification of Bestmanagement Practice Option on Sediment Yield Using SWAT (Case Study in Gumara Watershed, Ethiopia).
|
| [15] |
Gebiaw, T. (2011). Stream flow Responses to Changes in Land Use and Climate: (The Case of Bilate Watershed, Rift Valley Basin, Ethiopia).
|
| [16] |
Hargreaves, G. L., Hargreaves, G. H., Riley, J. P. (1985). Agricultural benefits for Senegal River basin. Journal of Irrigation and Drainage Engineering.
|
| [17] |
Hurni, H. (1983). Soil Conservation Research Project, Vol. 3 Second Progress Report Soil and Water Conservation Dept.ministry of Agriculture and University of Berne, Switzerland in association with UN University, Tokyo.
|
| [18] |
Kruger, L.m.,midgley, J. J., & Cowling, R.m. (1997). Resprouters vs reseeders in South African forest trees; amodel based on forest canopy height. Functional Ecology, 11(1), 101-105.
|
| [19] |
Nina Kemal (2016).megech Dam Reservoir Sediment Estimation Using Swatmodel,mSc thesis, Addis Ababa University, Ethiopia.
|
| [20] |
Habetamu Bewkwt (2017). Simulating Hydrological and Climate Variability Impacts on the Watershed of Legedadi Reservoir using Arc-SWAT,mSc thesis, Addis.
|
| [21] |
Setegn, S. G. (2008). Hydrological and sediment yield modelling in Lake Tana basin, Blue Nile Ethiopia (Doctoral dissertation, KTH).
|
Cite This Article
-
APA Style
Ewentie, A. K., Unto, P. B. (2025). Prediction of Sediment Yeild to Lake Ziway Reservoir and Assessing Reduction methods (Using Arc-swat). American Journal of Water Science and Engineering, 11(2), 40-50. https://doi.org/10.11648/j.ajwse.20251102.14
 Copy
|
Copy
|
 Download
ACS Style
Ewentie, A. K.; Unto, P. B. Prediction of Sediment Yeild to Lake Ziway Reservoir and Assessing Reduction methods (Using Arc-swat). Am. J. Water Sci. Eng. 2025, 11(2), 40-50. doi: 10.11648/j.ajwse.20251102.14
Copy
|
Download
AMA Style
Ewentie AK, Unto PB. Prediction of Sediment Yeild to Lake Ziway Reservoir and Assessing Reduction methods (Using Arc-swat). Am J Water Sci Eng. 2025;11(2):40-50. doi: 10.11648/j.ajwse.20251102.14
Copy
|
Download
-
@article{10.11648/j.ajwse.20251102.14,
  author = {Alemayehu Kassa Ewentie and Peniel Bafe Unto},
  title = {Prediction of Sediment Yeild to Lake Ziway Reservoir and Assessing Reduction methods (Using Arc-swat)
},
  journal = {American Journal of Water Science and Engineering},
  volume = {11},
  number = {2},
  pages = {40-50},
  doi = {10.11648/j.ajwse.20251102.14},
  url = {https://doi.org/10.11648/j.ajwse.20251102.14},
  eprint = {https://article.sciencepublishinggroup.com/pdf/10.11648.j.ajwse.20251102.14},
  abstract = {Sediment accumulation in Lake Ziway is an escalating concern driven by poor land use practices, ineffective watershedmanagement, and the absence of adequate soil and water conservationmeasures. This study aims to estimate sediment yield in the Lake Ziway watershed using the Soil and Water Assessment Tool (SWAT) integrated within ArcGIS. Themodel was calibrated and validated usingmeteorological and spatial data across 11 sub-basins and 116 hydrologic response units (HRUs), covering a calibration period from 2001 to 2009 and a validation period from 2010 to 2012. Calibration was performed using the Sequential Uncertainty Fitting version 2 (SUFI-2) algorithm within the SWAT-CUP interface.model performance was satisfactory, with coefficients of determination (R²) and Nash–Sutcliffe efficiency (NSE) values ranging from 0.72 to 0.76 for discharge and 0.72 to 0.84 for sediment yield. The average annual sediment yield was estimated at 2.69 tons/ha/year, and the gross sediment inflow into Lake Ziway was calculated at approximately 1.04million tons/year, with a deposition rate of 38.5%. Sub-basins 4 and 5 were identified as sediment hotspots, with yields exceeding 6 tons/ha/year. Three conservation scenarios were evaluated using the current watershed condition as a baseline: terracing reduced sediment yield by 72%, filter strips by 42%, and grassed waterways by 58%. These results highlight the critical role of soil and water conservation strategies in sustaining Lake Ziway’s capacity and ecosystem.
},
 year = {2025}
}
Copy
|
Download
-
TY  - JOUR
T1  - Prediction of Sediment Yeild to Lake Ziway Reservoir and Assessing Reduction methods (Using Arc-swat)

AU  - Alemayehu Kassa Ewentie
AU  - Peniel Bafe Unto
Y1  - 2025/06/30
PY  - 2025
N1  - https://doi.org/10.11648/j.ajwse.20251102.14
DO  - 10.11648/j.ajwse.20251102.14
T2  - American Journal of Water Science and Engineering
JF  - American Journal of Water Science and Engineering
JO  - American Journal of Water Science and Engineering
SP  - 40
EP  - 50
PB  - Science Publishing Group
SN  - 2575-1875
UR  - https://doi.org/10.11648/j.ajwse.20251102.14
AB  - Sediment accumulation in Lake Ziway is an escalating concern driven by poor land use practices, ineffective watershedmanagement, and the absence of adequate soil and water conservationmeasures. This study aims to estimate sediment yield in the Lake Ziway watershed using the Soil and Water Assessment Tool (SWAT) integrated within ArcGIS. Themodel was calibrated and validated usingmeteorological and spatial data across 11 sub-basins and 116 hydrologic response units (HRUs), covering a calibration period from 2001 to 2009 and a validation period from 2010 to 2012. Calibration was performed using the Sequential Uncertainty Fitting version 2 (SUFI-2) algorithm within the SWAT-CUP interface.model performance was satisfactory, with coefficients of determination (R²) and Nash–Sutcliffe efficiency (NSE) values ranging from 0.72 to 0.76 for discharge and 0.72 to 0.84 for sediment yield. The average annual sediment yield was estimated at 2.69 tons/ha/year, and the gross sediment inflow into Lake Ziway was calculated at approximately 1.04million tons/year, with a deposition rate of 38.5%. Sub-basins 4 and 5 were identified as sediment hotspots, with yields exceeding 6 tons/ha/year. Three conservation scenarios were evaluated using the current watershed condition as a baseline: terracing reduced sediment yield by 72%, filter strips by 42%, and grassed waterways by 58%. These results highlight the critical role of soil and water conservation strategies in sustaining Lake Ziway’s capacity and ecosystem.

VL  - 11
IS  - 2
ER  -
Copy
|
Download