Cardiovascular Disease (CVD) remains a leading cause of mortality worldwide, necessitating effective prediction methods to improve patient outcomes. The study contributed to knowledge by using Support Vector Machine (SVM) to predict the outcome of patient at risk of CVD. This study explored the application of Logistic Regression (LR) and Support Vector Machine (SVM) models for predicting patient outcomes in CVD. In this analysis, patient medical record data was retrieved online from kaggle.com, comprising a dataset of 1,000 instances with 14 features relevant to cardiovascular health. Both Logistic Regression, implemented in SPSS, and SVM, executed using the R package, were employed for predictive modelling. From this study, SVM emerged as the superior model due to its ability to handle high-dimensional data and complex relationships. It has shown potentials in reducing the severity of cardiac diseases by accurately identifying at-risk individuals, thereby enabling timely intervention. The results indicated that the SVM model achieved an impressive accuracy rate of 98.7%, significantly outperforming the LR model of accuracy rate of 97%. Accurate predictions from the SVM model are vital for healthcare experts in identifying individuals at risk and formulating tailored treatment plans. Leveraging advanced machine learning techniques such as SVM can enhance the predictive capabilities regarding cardiovascular disease outcomes. This study underscores the importance of integrating these models into clinical practice to facilitate proactive healthcare measures and ultimately reduce cardiovascular morbidity and mortality rates.
| Published in | Biomedical Statistics and Informatics (Volume 10, Issue 2) |
| DOI | 10.11648/j.bsi.20251002.13 |
| Page(s) | 39-45 |
| Creative Commons |
This is an Open Access article, distributed under the terms of the Creative Commons Attribution 4.0 International License (http://creativecommons.org/licenses/by/4.0/), which permits unrestricted use, distribution and reproduction in any medium or format, provided the original work is properly cited. |
| Copyright |
Copyright © The Author(s), 2025. Published by Science Publishing Group |
Cardiovascular Disease, Logistic Regression, Support Vector Machine, K-Nearest Neighbours
 ,(1)
,(1)  (2)
(2) S. No. | Attribute | Assigned Code | Unit | Type of Data |
|---|---|---|---|---|
1. | Patient Identification Number | Patient ID | Number | Numeric |
2. | Age | Age | In Years | Numeric |
3 | Gender | Gender | 1,0(0 = female, 1 = male) | Binary |
4. | Chest pain type | Chestpain | 0,1,2,3 (Value 0: typical angina Value 1: atypical angina Value 2: non-anginal pain Value 3: asymptomatic) | Nominal |
5. | Resting blood pressure | Resting BP | 94-200 (in mm HG) | Numeric |
6. | Serum cholesterol | Serum cholestrol | 126-564 (in mg/dl) | Numeric |
7. | Fasting blood sugar | Fasting blood sugar | 0,1 > 120 mg/dl (0 = false, 1 = true | Binary |
8. | Resting electrocardiogram results | Resting relectro | 0,1,2 (Value 0: normal, Value 1: having ST-T wave abnormality (T wave inversions and/or ST elevation or depression of > 0.05 mV), Value 2: showing probable or definite left ventricular hypertrophy by Estes' criteria) | Nominal |
9. | Maximum heart rate | Max heart rate | achieved 71-202 | Numeric |
10. | Exercise induced angina | Exercise angia | 0,1 (0 = no, 1 = yes) | Binary |
11. | Oldpeak = ST | Oldpeak | 0-6.2 | Numeric |
12. | Slope of the peak exercise ST segment | Slope | 1,2,3 (1-upsloping, 2-flat, 3- down sloping) | Nominal |
13. | Number of major vessels | No of major vessels | 0,1,2,3 | Numeric |
14. | Classification | Target | 0,1 (0 = Absence of Heart Disease, 1= Presence of Heart Disease) | Binary |
 (3)
(3)  (4)
(4)  (5)
(5)  (6)
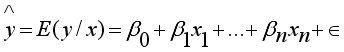
(6)  represents the predicted value of the dependent variable y given the independent variables 𝑥1, 𝑥2, ..., 𝑥𝑛;
  (7)
(7) Variables in the Equation | ||||||
|---|---|---|---|---|---|---|
B | S. E. | Wald | Df | Sig. | Exp(B) | |
Age | -.002 | .012 | .019 | 1 | .889 | .998 |
Gender | 3.146 | .562 | 31.314 | 1 | .000 | 23.246 |
Chest pain | 1.083 | .228 | 22.639 | 1 | .000 | 2.953 |
Resting bp | .039 | .008 | 24.420 | 1 | .000 | 1.040 |
Serum cholesterol | .001 | .002 | .211 | 1 | .646 | 1.001 |
Fasting blood | .964 | .487 | 3.914 | 1 | .048 | 2.622 |
Resting result | 1.181 | .300 | 15.461 | 1 | .000 | 3.257 |
Heart rate | .016 | .006 | 6.874 | 1 | .009 | 1.016 |
Exercise induced angina | -.114 | .405 | .079 | 1 | .779 | .893 |
Old peak | -1.283 | .205 | 39.141 | 1 | .000 | .277 |
Slope of the peak exercise | 7.309 | .830 | 77.521 | 1 | .000 | 1493.345 |
Number of major vessel | .122 | .219 | .309 | 1 | .578 | 1.129 |
Constant | -18.976 | 2.385 | 63.303 | 1 | .000 | .000 |
Predicted group Cross Tabulation | |||
|---|---|---|---|
Predicted group | Total | ||
Healthy | Unhealthy | ||
Healthy | 405 | 15 | 420 |
Unhealthy | 15 | 565 | 580 |
Total | 420 | 580 | 1000 |
Predicted Group Cross Tabulation | |||
|---|---|---|---|
Predicted group | Total | ||
Unhealthy | Healthy | ||
Unhealthy | 413 | 7 | 420 |
Healthy | 6 | 574 | 580 |
Total | 419 | 581 | 1000 |
CVD | Cardiovascular Disease |
SVM | Support Vector Machine |
LR | Logistic Regression |
DTC | Decision Tree Classifiers |
DCNN | Deep Convolutional Neural Network |
BN | Bayesian Network |
ROC | Receiver Operating Characteristics (ROC) |
| [1] | Anshori M., & Haris, M. S. (2022). Predicting heart disease using logistic regression. Knowledge Engineering and Data Science (KEDS), 5(2), 188-196. |
| [2] | Anshori M., Haris, M. S., & Wahyudi, A. (2024). Logistic regression's effectiveness in feature selection with information gain in predicting heart failure patients. Journal of Enhanced Studies in Informatics and Computer Applications, 1(2), 35-39. |
| [3] | Bharani B. R., Manjunatha S., Vijayalakshmi R., & Preethi S. (2024). Heart disease prediction using effective machine learning techniques. International Journal for Multidisciplinary Research (IJFMR), 6(2), 1-8. |
| [4] | Doppala P. B., & Bhattacharyya, D. (2021). Cardiovascular disease dataset, Mendeley Data, V1, |
| [5] | Elsedimy, E. I., AboHashish, S. M. M. A & Algarni F. (2024). New cardiovascular disease prediction approach using support vector machine and quantum-behaved particle swarm optimization. Multimed Tools Application, 83, 23901-23928. |
| [6] | Guido, M., De Santis, F., & Pappalardo, G. (2024). Application of support vector machine to healthcare: Improved Performance Metrics. Journal of Healthcare Engineering, Article ID 123456. |
| [7] | Harrell J., & Frank E. (2015). Regression modelling strategies: With applications to linear models, logistic and ordinal regression, and survival analysis (2nd ed). Springer International Publishing. |
| [8] | Hoque, R., Billah M., Debnath A., Hossain, S. M. S., & Sharif, N. B. (2024). Heart disease prediction using support vector machine. International Journal of Science and Research Archive, 11(2), 412-420. |
| [9] | Maghdid, S. S., & Rashid, T. A. (2022). An extensive dataset for the heart disease classification system, Mendeley Data. |
| [10] | Nwohiri, A. M., Laguda, A. A., Olanite, A. A., & Olabamire, D. D. (2024). Logistic regression technique for cardiovascular disease prediction. FUDMA Journal of Sciences (FJS), 8(4), 266-275. |
| [11] | Palaniappan, S., & Awang R. (2008). Intelligent Heart Disease Prediction System Using Data Mining Techniques. International Conference on Computer Systems and Application, Doha, 108-115. |
| [12] | Shapshak, P., Balaji, S., Kangueane, P., Chiappelli, F., Somboonwit C., Menezes, L. J., Sinnott, J. T. (2019). Application of Support Vector Machines in Viral Biology. Global Virology III: Virology in the 21st Century. Springer, Cham. |
| [13] |
World Health Organization (2023). Cardiovascular diseases,
https://www.who.int/health-topics/cardiovascular-diseases#tab=tab_1 accessed on March 14, 2024. |
APA Style
Adeyeye, A. C., Adedayo, J. S., Kolawole, I. A., Matanmi, O. G. (2025). Prediction of Patients’ Outcomes in Cardiovascular Disease. Biomedical Statistics and Informatics, 10(2), 39-45. https://doi.org/10.11648/j.bsi.20251002.13
ACS Style
Adeyeye, A. C.; Adedayo, J. S.; Kolawole, I. A.; Matanmi, O. G. Prediction of Patients’ Outcomes in Cardiovascular Disease. Biomed. Stat. Inform. 2025, 10(2), 39-45. doi: 10.11648/j.bsi.20251002.13
@article{10.11648/j.bsi.20251002.13,
  author = {Awogbemi Clement Adeyeye and Johnson Simeon Adedayo and Ilori Adetunji Kolawole and Oyeyemi Gafar Matanmi},
  title = { Prediction of Patients’ Outcomes in Cardiovascular Disease
},
  journal = {Biomedical Statistics and Informatics},
  volume = {10},
  number = {2},
  pages = {39-45},
  doi = {10.11648/j.bsi.20251002.13},
  url = {https://doi.org/10.11648/j.bsi.20251002.13},
  eprint = {https://article.sciencepublishinggroup.com/pdf/10.11648.j.bsi.20251002.13},
  abstract = {Cardiovascular Disease (CVD) remains a leading cause of mortality worldwide, necessitating effective prediction methods to improve patient outcomes. The study contributed to knowledge by using Support Vector Machine (SVM) to predict the outcome of patient at risk of CVD. This study explored the application of Logistic Regression (LR) and Support Vector Machine (SVM) models for predicting patient outcomes in CVD. In this analysis, patient medical record data was retrieved online from kaggle.com, comprising a dataset of 1,000 instances with 14 features relevant to cardiovascular health. Both Logistic Regression, implemented in SPSS, and SVM, executed using the R package, were employed for predictive modelling. From this study, SVM emerged as the superior model due to its ability to handle high-dimensional data and complex relationships. It has shown potentials in reducing the severity of cardiac diseases by accurately identifying at-risk individuals, thereby enabling timely intervention. The results indicated that the SVM model achieved an impressive accuracy rate of 98.7%, significantly outperforming the LR model of accuracy rate of 97%. Accurate predictions from the SVM model are vital for healthcare experts in identifying individuals at risk and formulating tailored treatment plans. Leveraging advanced machine learning techniques such as SVM can enhance the predictive capabilities regarding cardiovascular disease outcomes. This study underscores the importance of integrating these models into clinical practice to facilitate proactive healthcare measures and ultimately reduce cardiovascular morbidity and mortality rates.
},
 year = {2025}
}
TY  - JOUR
T1  -  Prediction of Patients’ Outcomes in Cardiovascular Disease

AU  - Awogbemi Clement Adeyeye
AU  - Johnson Simeon Adedayo
AU  - Ilori Adetunji Kolawole
AU  - Oyeyemi Gafar Matanmi
Y1  - 2025/06/06
PY  - 2025
N1  - https://doi.org/10.11648/j.bsi.20251002.13
DO  - 10.11648/j.bsi.20251002.13
T2  - Biomedical Statistics and Informatics
JF  - Biomedical Statistics and Informatics
JO  - Biomedical Statistics and Informatics
SP  - 39
EP  - 45
PB  - Science Publishing Group
SN  - 2578-8728
UR  - https://doi.org/10.11648/j.bsi.20251002.13
AB  - Cardiovascular Disease (CVD) remains a leading cause of mortality worldwide, necessitating effective prediction methods to improve patient outcomes. The study contributed to knowledge by using Support Vector Machine (SVM) to predict the outcome of patient at risk of CVD. This study explored the application of Logistic Regression (LR) and Support Vector Machine (SVM) models for predicting patient outcomes in CVD. In this analysis, patient medical record data was retrieved online from kaggle.com, comprising a dataset of 1,000 instances with 14 features relevant to cardiovascular health. Both Logistic Regression, implemented in SPSS, and SVM, executed using the R package, were employed for predictive modelling. From this study, SVM emerged as the superior model due to its ability to handle high-dimensional data and complex relationships. It has shown potentials in reducing the severity of cardiac diseases by accurately identifying at-risk individuals, thereby enabling timely intervention. The results indicated that the SVM model achieved an impressive accuracy rate of 98.7%, significantly outperforming the LR model of accuracy rate of 97%. Accurate predictions from the SVM model are vital for healthcare experts in identifying individuals at risk and formulating tailored treatment plans. Leveraging advanced machine learning techniques such as SVM can enhance the predictive capabilities regarding cardiovascular disease outcomes. This study underscores the importance of integrating these models into clinical practice to facilitate proactive healthcare measures and ultimately reduce cardiovascular morbidity and mortality rates.

VL  - 10
IS  - 2
ER  -
Statistics Programme, National Mathematical Centre, Abuja, Nigeria
Statistics Programme, National Mathematical Centre, Abuja, Nigeria
Information