Abstract
Health informatics plays a crucial role in the early detection of lung cancer by enhancing the collection, analysis, and application of patient data in clinical settings. It enables the integration of data from electronic health records (EHRs), imaging, pathology reports, and even genomic information. Artificial Intelligence (AI) and Machine Learning (ML) technologies further support lung cancer detection by tracking disease progression over time, identifying changes that may suggest malignancy, and reducing false-positive and unnecessary procedures. A fundamental challenge, however, remains: many existing lung cancer prediction models report accuracy below 80%, emphasizing the need for more effective classification techniques. In this work, we introduce a novel approach that significantly improves predictive accuracy, achieving rates between 95% and 98% a notable advancement over current methods using the same dataset. This improvement is driven by a recently developed Generative AI technology, considered one of the most powerful tools for enhancing the performance of health informatics systems.
|
Published in
|
Cancer Research Journal (Volume 13, Issue 3)
|
|
DOI
|
10.11648/j.crj.20251303.11
|
|
Page(s)
|
81-97 |
|
Creative Commons
|

This is an Open Access article, distributed under the terms of the Creative Commons Attribution 4.0 International License (http://creativecommons.org/licenses/by/4.0/), which permits unrestricted use, distribution and reproduction in any medium or format, provided the original work is properly cited.
|
|
Copyright
|
Copyright © The Author(s), 2025. Published by Science Publishing Group
|
Keywords
Lung Cancer, Detection, Artificial Intelligence, PM GenAI Algorithm, Accuracy
1. Introduction
Recent advances in imaging and sequencing technologies have significantly propelled the clinical study of lung cancer. However, the human capacity to process and interpret the resulting vast and complex datasets remains limited. Machine learning (ML) plays a pivotal role in integrating and analyzing this wealth of data, offering multi-dimensional insights into lung cancer. In this review, we present an overview of ML-based approaches that enhance various aspects of lung cancer diagnosis and treatment, including early detection, auxiliary diagnosis, prognosis prediction, and immunotherapy. We also discuss current challenges and future opportunities for applying ML in lung cancer research and clinical practice.
Lung cancer is among the most frequently diagnosed cancers and remains the leading cause of cancer-related deaths worldwide. Each year, approximately 2.20 million new cases are reported, with 75% of patients succumbing to the disease within five years of diagnosis.
Over the past few decades, advancements in cancer research technologies have driven numerous large-scale collaborative projects, resulting in extensive clinical, medical, and sequencing databases. These resources have empowered researchers to investigate lung cancer across the continuum of diagnosis, treatment, and clinical outcomes.
Cancer studies are increasingly moving toward the integration of multi-dimensional, large-scale datasets. However, leveraging these diverse data types in clinical applications remains a time-consuming and complex process. The rapid expansion of cancer-related databases further compounds the analytical challenge.
As a result, machine learning (ML) has emerged as a critical approach for automatically extracting patterns from complex data to support clinical decision-making. ML, a subset of artificial intelligence (AI), uses mathematical algorithms to identify patterns and make predictions based on data
. It has long played a supportive role in cancer phenotyping and therapy, and its applications have expanded to include early detection, cancer subtype classification, biomarker discovery, tumor microenvironment (TME) deconvolution, prognosis prediction, and drug response evaluation
| [2] | E. Svoboda “Artificial intelligence is improving the detection of lung cancer”, Nature, 587 (2020), pp. S20-S22. |
[2]
.
Early diagnosis plays a crucial role in reducing mortality associated with lung cancer. Chest screening using low-dose computed tomography (CT) is the primary method for monitoring individuals at increased risk. To enhance diagnostic accuracy and efficiency, computer-aided diagnosis (CAD) systems have been developed to assist physicians in interpreting medical imaging data. These systems have proven to be valuable as a second opinion in clinical decision-making
| [3] | Y. Abe, K. Hanai, M. Nakano, Y. Ohkubo, T. Hasizume, T. Kakizaki, et al. “A computer-aided diagnosis (CAD) system in lung cancer screening with computed tomography”. Anticancer Res, 25 (2005), pp. 483-488. |
[3]
.
Traditional feature-based CAD typically involves three steps: nodule segmentation, feature extraction and selection, and clinical judgment inference (classification). Some methods utilize measured texture features of identified nodules in CT images, combined with patient clinical data, to train machine learning (ML) classifiers, such as logistic regression (LR)
| [4] | P. de Melo, “Public Health Informatics and Technology’, 2024, ISBN- 979-8894090955. |
[4]
.
Commonly used features include nodule size, type, location, count, boundary characteristics, and the presence of emphysema in CT scans. Clinical variables often include the patient’s age, gender, timing of specimen collection, family history of lung cancer, smoking exposure, and more. However, these features tend to be subjective and arbitrarily defined, often falling short in providing a comprehensive, quantitative characterization of malignant nodule appearances
| [5] | A. McWilliams, M.C. Tammemagi, J.R. Mayo, H. Roberts, G. Liu, K. Soghrati, et al. Probability of cancer in pulmonary nodules detected on first screening CT, N Engl J Med, 369 (2013), pp. 910-919. |
[5]
.
With advancements in deep learning (DL), particularly convolutional neural networks (CNNs), DL-based models have increasingly been integrated into computer-aided diagnosis (CAD) systems to enhance accuracy, reduce false positives, and improve execution time in lung tumor detection. Like traditional feature-based CAD systems, these DL models typically follow a three-step pipeline: nodule detection and segmentation, feature extraction, and clinical inference
| [6] | M. Buty, Z. Xu, M. Gao, U. Bagci, A. Wu, D. Mollura, Characterization of lung nodule malignancy using hybrid shape and appearance features |
| [7] | S. Ourselin, L. Joskowicz, M. Sabuncu, G. Unal, W. Wells (Eds.), Medical image computing and computer-assisted intervention, Springer, Cham (2016). p. 662-70. |
[6, 7]
. However, DL-based systems surpass traditional ones by automatically extracting high-level features and capturing 3D characteristics of suspicious nodules.
While machine learning (ML) can be incredibly powerful, poor accuracy is indeed one of its potential disadvantages, especially in certain scenarios. Here's a breakdown of why poor accuracy can be a significant issue and what might cause it:
1) ML models are heavily reliant on the quality and quantity of data. If the training data is noisy, incomplete, biased, or not representative of real-world scenarios, the model’s accuracy will suffer.
2) Overfitting or Underfitting
a) Overfitting: The model learns the training data too well, including the noise, and fails to generalize to new data.
b) Underfitting: The model is too simple to capture the underlying trends in the data.
3) Some problems are inherently difficult to model. For example, predicting human behavior or interpreting natural language with full nuance is extremely complex and often results in lower accuracy.
4) Poor accuracy can be hard to fix because many ML models (like deep neural networks) operate as black boxes, making it difficult to understand why they’re making errors.
5) In dynamic environments, the underlying patterns in data may shift over time, causing a once-accurate model to become less reliable.
6) Training highly accurate models often requires significant computational resources. In resource-constrained environments, trade-offs may lead to the use of simpler, less accurate models.
Low-quality or insufficient data, including small sample sizes, especially for certain cancer types, can significantly hinder model performance. This is why many ML algorithms fail to provide reliable results. In this paper, we present a novel algorithm that can dramatically enhance the accuracy of lung cancer detection.
2. Data Description: Lung Cancer Data Set
2.1. Lung Cancer Data Set
This dataset consists of 5,000 records with 17 features related to lung cancer risk factors and prediction. It includes demographic information, lifestyle habits, medical history, and symptoms associated with pulmonary disease. The dataset is useful for predictive modeling, risk assessment, and medical research. The features are as follows:
Table 1. Features of the lung cancer dataset.
Feature | Description |
Age | Age of patients |
Gender (GEN) | Gender of patients (binary) |
Smoking (S) | Smoking or not (binary) |
Finger Discoloration (F) | Finger discoloration in lung cancer can occur due to several reasons, often related to poor oxygenation (binary) |
Mental Stress (M) | Mental stress and "lung stress" are terms that refer to two different types of stress. Mental refers to anxiety and depression (binary) |
Exposure to Pollution (EXP) | Exposure to pollution in lung stress" refers to how breathing in polluted air affects the lungs and causes physical stress or harm to lung tissues and respiratory function (binary). |
Long Term Illness (LONG) | In the context of lung cancer, a long-term illness refers to the chronic and ongoing nature of the disease and its effects, even after initial treatment (binary) |
Energy Level (EN) | In the context of lung cancer, "energy level" typically refers to a patient's overall physical stamina and fatigue, rather than a specific medical or biological measurement. It’s a common way to describe how much energy a person feels they have for daily activities. |
Immune Weakness (IMM) | Immune weakness is commonly referred to as immunodeficiency (binary) |
Breathing Issue (BRE) | This refers to low oxygen levels in the blood, often leading to breathlessness and fatigue (binary). |
Alcohol Consumption (ALC) | Alcohol consumption in the context of lung cancer refers to the intake of alcoholic beverages and its potential relationship to the development or progression of lung cancer. |
Throat Discomfort (TH) | Sensation of discomfort or distress related to the perceived threat of having lung cancer or the physical discomfort that arises due to symptoms of the disease (binary). |
Oxygen Saturation (OX) | Lung cancer can obstruct airways or damage lung tissue, thereby reducing the lungs' ability to transfer oxygen into the blood. This can lead to lower oxygen saturation levels. |
Chest Tightness (CHEST) | It is described as a feeling of pressure, heaviness, or difficulty breathing (binary). |
Family History (FH) | Family history in lung cancer refers to the occurrence of the disease in a person's relatives, particularly first-degree relatives like parents, siblings, or children (binary). |
Smoking in Family (SMOK) | Family history of smoking refers to the presence of smoking habits among family members, particularly parents, siblings, or extended relatives. In the context of lung cancer, family history can play a significant role in understanding an individual's risk of developing the disease, but it's important to distinguish between two key factors: genetic predisposition and environmental exposure (binary). |
Immune Stress (STESS) | Immune stress in lung cancer refers to the complex interactions between the immune system and the tumor environment that can impact the body's ability to fight cancer. It involves a range of factors that affect the immune response, either impairing it or being influenced by the tumor's behavior (binary) |
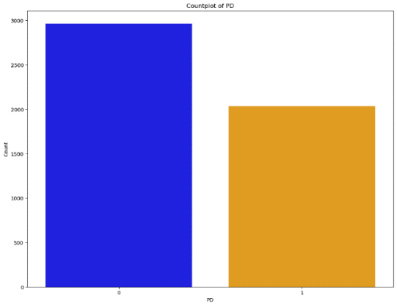
Figure 1 illustrates the comparison between the number of healthy patients and those diagnosed with lung cancer.
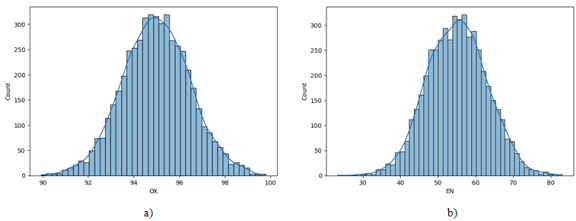
Figure 2 displays histograms of oxygen saturation and energy levels. The histograms demonstrate normal distributions of these features.
Figure 1. The number of healthy patients (marked by ‘0’ and with lung cancer “1”).
Figure 2. Histograms of oxygen saturation (a) and energy levels (b).
2.2. Pre-Processing
Pre-processing of data is a crucial step in any machine learning pipeline. It ensures that the raw data is transformed into a clean and structured format suitable for modeling. We used the following steps:
1) Data Cleaning
i) Handling Missing Values:
a) Remove rows/columns with too many missing values
b) Impute missing values (mean, median, mode, interpolation)
ii) Removing Duplicates
iii) Fixing Structural Errors:
Inconsistent capitalization, typos, incorrect labels (e.g., "male", "Male", "MALE")
iv) Outlier Detection and Removal
2) Data Transformation
i. Normalization/Scaling:
a) Min-Max Scaling: Brings values to a range (typically [0, 1])
b) Standardization (Z-score Scaling): Centers the data around 0 with unit variance
ii. Encoding Categorical Variables:
a) Label Encoding: Converts categories to integers
b) One-Hot Encoding: Creates binary columns for each category
iii. Binning:
Convert continuous data into categorical bins (e.g., age of patient groups)
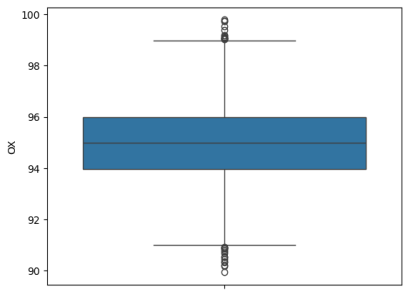
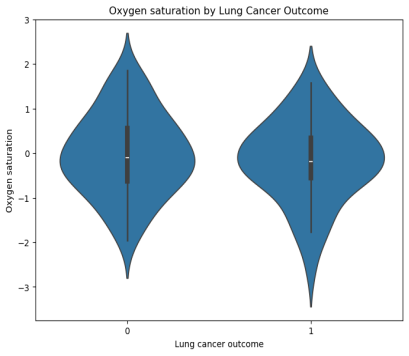
Figure 3 shows the boxplot of the oxygen saturation feature, while
Figure 4 is its violin plot, showing higher levels of oxygen saturation in the healthy population.
Figure 3. Boxplot of oxygen saturation shows outliers (beyond the whiskers).
Figure 4. Violin plot of the oxygen saturation.
2.3. Feature Engineering
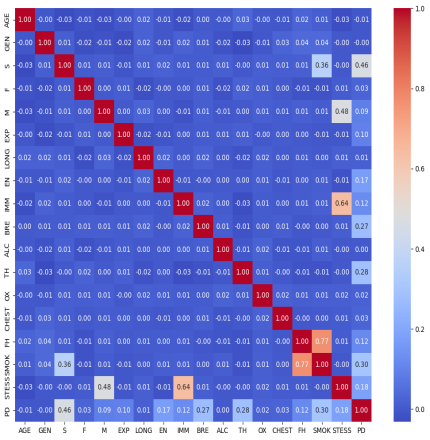
Feature engineering in machine learning is the process of utilizing domain knowledge and data transformation techniques to analyze and create features (input variables) that enhance the performance of machine learning models. It's a crucial step in the data preprocessing pipeline and often has a big impact on model performance. The first step in feature engineering is to analyze the correlation between features. For this reason, we compute a correlation (heatmap) that is shown in
Figure 5. Figure 5. The correlation matrix (heatmap) shows the correlation values between features and outcomes.
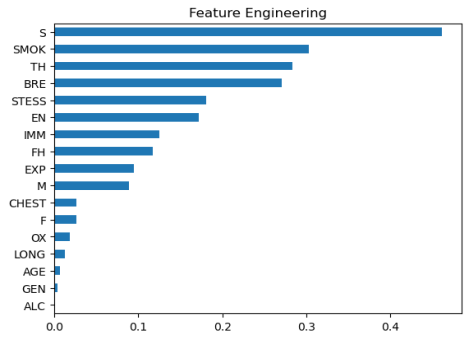
The next step in feature engineering is to plot the impact of the features on the outcomes explicitly.
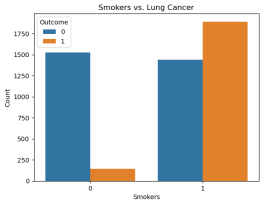
Figure 6 shows that smoking plays the pivotal risk in lung cancer development.
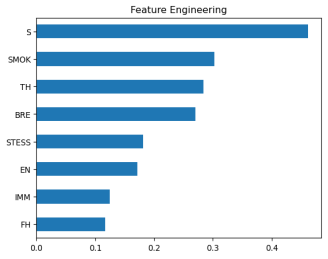
Figure 7 illustrates the features that have the most significant impact on the outcomes.
Figure 6. The plot shows the impact of each feature on the outcome.
Figure 7. The plot shows the features which mostly impact the outcome. These features are smoking, smoking in family, Throat discomfort, Immune stress, Energy level, Immunodeficiency, and family history of lung cancer.
Figure 8 shows the impact of smoking on lung cancer.
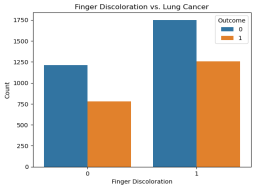
Figure 9 depicts the relationship between finger decolorization and patients with lung cancer.
Figure 8. The number of smoking patients with lung cancer (1) is significantly higher than the number of nonsmoking patients (orange color in the “0” category).
Figure 9. The number of patients with finger decolorization and lung cancer (1) is still significant.
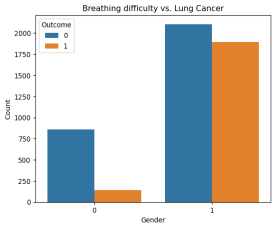
Figure 10 depicts the relationship between the number of patients with breathing difficulty and lung cancer and
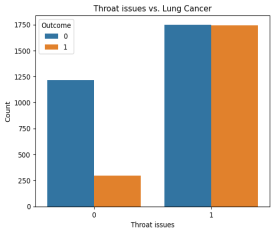
Figure 11 shows that throat issues may be indicative for lung cancer.
Figure 10. The number of patients with breathing difficulties and lung cancer (1) is significantly higher than the number of patients without breathing difficulties (orange color in the “0” category.
Figure 11. The number of patients with throat discomfort and lung cancer (1) is significantly higher than the number of patients without throat complaints (orange color in the “0” category).
3. Lung Cancer Prediction Algorithms
Classification and Regression Problems
Classification is the process of identifying or discovering a model or function that helps separate the data into multiple categorical classes, i.e., discrete values. In classification, data is categorized under different labels based on parameters provided in the input, and then the labels are predicted for the data.
In a classification task, we are supposed to predict discrete target variables (class labels) using independent features. In the classification task, we are supposed to find a decision boundary that can separate the different classes in the target variable. The classification process addresses problems where the data can be categorized into binary or multiple discrete labels. If we want to predict the possibility of a patient having lung cancer, then there would be two labels: Yes and No.
A regression problem in machine learning is a type of supervised learning task where the goal is to predict a continuous output or value based on input features.
Lung cancer, also referred to as lung carcinoma in the usual medical term, is originally a malignant tumor that grows in lung cells uncontrollably and can be identified by cell proliferation. Recent advancements in computer vision have enabled scientists to introduce various diagnostic methods using temporal image analysis. However, with the growth in clinical data repositories, not only image analysis but also text data played a vital role in diagnosis.
Several lung cancer studies focus on detection using symptom data and treatment decisions based on artificial intelligence, image processing, and learning algorithms. Several researchers have applied neural networks, support vector machines, decision trees, convolutional neural networks, Random Forest, XGBoost, and logistic regression — machine learning algorithms—to clinical datasets to predict the recurrence of lung cancer and its survivability. A few comparative studies have also been presented such as ensemble techniques of Bagging and Adaboost and K-Nearest Neighbors, Decision Tree, and Neural Networks on Surveillance, Epidemiology and End Results (SEER) dataset, XGBoost, GridSearchCV, Logistic Regression, Support Vector Machine, Gaussian Naïve Bayes, Decision tree, and K-Nearest Neighbor classifiers to evaluate lung cancer prediction through precision, recall, F1-Score parameters generated using confusion matrix and Area Under Curve (AUC) & Receiver Operating Characteristic (ROC) analysis.
A few more machine learning classifiers such as Logistic Regression, Naïve Bayes and Random Forest, Support Vector Machine (SVM), Artificial Neural Network (ANN), k-Nearest Neighbors (KNN), Radial Basis Function Network (RBF), J48, MLP, Gradient Boosted Tree, Majority Voting, also tried for observing the performance of lung cancer prediction. Specifically, some standard machine learning techniques such as decision tree, boosting, random forest, neural network, naïve Bayes, KNN, and SVM are frequently in lung cancer prediction
| [8] | Earnest, A., Tesema, G. A. & Stirling, R. G. “Machine learning techniques to predict timeliness of care among lung cancer patients”. Healthcare. 11(20), 2756 (2023). |
[8]
. These machine learning algorithms demonstrated their applicability in a temporal, real-world, and larger dataset of lung cancer for risk prediction
| [9] | Chandran, U., “Machine learning and real-world data to predict lung cancer risk in routine care”. Cancer Epidemiol. Biomark. Prevent. 32(3), 337-343 (2023). |
| [10] | Qureshi, R., “Machine learning based personalized drug response prediction for lung cancer patients”. Sci. Rep. 12(1), 18935 (2022). |
[9, 10]
.
In binary classification, while using various methods, especially in diagnostic, prognostic, and predictive research, the Receiver Operating Characteristic (ROC) and Area under the Curve (AUC) analyses are effective techniques usually utilized to calculate measurements for the assessment of the differentiating ability of methods. The ROC curve is used to assess a test’s overall diagnostic performance and compare the performance of two or more diagnostic tests.
In other words, the ROC is informative about performance over a series of thresholds and can be summarized by the AUC, which is a single numerical value. Additionally, a gender and age-based study for a lung cancer dataset has been conducted using machine learning, demonstrating the potential applicability of naïve Bayes, SVM, KNN, random forest, decision tree, AdaboostM1, and neural network. Apart from the above analysis, it is essential to interrelate patients’ habits and symptoms, thereby providing a more precise diagnosis and treatment for lung cancer. Moreover, it is equally important to find a suitable method of analyzing these datasets. Few attempts have been made to compare different machine-learning methods for predicting lung cancer.
A comparison of different ML algorithms is demonstrated in
| [11] | Satya Prakash Maurya, Pushpendra Singh Sisodia, Rahul Mishra. Devesh Pratap singh “Performance of machine learning algorithms for lung cancer prediction: a comparative approach”, Scientific Reports (Sci Rep), ISSN 2045-2322. |
[11]
:
Table 2. Accuracies of ML algorithms in processing lung cancer data.
Method | Accuracy |
Logistic Regression | The accuracy of logistic regression is 87.5%. |
Gaussian Naive Bayes | The accuracy of Gaussian Naive Bayes is 91.07%. |
Bernoulli Naive classifier | The accuracy of Bernoulli Naive Bayes is 91.07%. |
SVM classifier | The accuracy of the Support Vector Machine is 85.71%. |
Random Forest Classifier | The accuracy of the Random Forest Classifier is 85.71%. |
K Nearest Neighbors Classifier | The accuracy of the K Nearest Neighbors Classifier is 92.86%. |
Extreme gradient boosting classifier | The accuracy of the Extreme Gradient Boosting classifier is 89.29%. |
Extra tree classifier | The accuracy of the extra tree classifier is 89.29%. |
AdaBoost classifier | The accuracy of the AdaBoost classifier is 89.29%. |
Ensemble_1 with XGB and ADA Classifier | The accuracy of Ensemble_1 with XGB and ADA Classifier is 89.29%. |
Ensemble_2 with Voting Classifier | The accuracy of Ensemble_2 with Voting Classifier is 87.5%. |
MLP Classifier | The accuracy of MLP Classifier is 89.29% |
The comparative study
| [11] | Satya Prakash Maurya, Pushpendra Singh Sisodia, Rahul Mishra. Devesh Pratap singh “Performance of machine learning algorithms for lung cancer prediction: a comparative approach”, Scientific Reports (Sci Rep), ISSN 2045-2322. |
[11]
suggests that the accuracy of K-Nearest Neighbor is the highest, at 92.86%, while Bernoulli Naïve Bayes and Gaussian Naïve Bayes achieve 91.07%. Therefore, we can conclude that the K-Nearest Neighbor and Bernoulli Naïve Bayes models yield better results on the smaller dataset with binary characteristics. They are more suitable when attributes or features are highly independent in the given dataset. Since other models rely on correlation and the splitting of the dataset into training and testing sets, they cannot be applied to this dataset.
Let us consider the deep learning algorithm:
Deep Learning represents a specialized area within machine learning, which itself is a branch of artificial intelligence (AI). This field emphasizes algorithms designed to emulate the human brain’s processes for data analysis and pattern recognition in decision-making. Deep learning employs artificial neural networks to capture intricate patterns and data representations, particularly in unstructured formats such as images, audio, and text.
In the realm of deep learning, Neural networks are composed of layers of nodes, often referred to as "neurons," with each node executing a specific mathematical function. These networks are structured into various layers, including input layers (which accept data), hidden layers (where the computations occur), and output layers (which generate predictions).
Weights and Biases: Within deep learning, weights and biases serve as parameters within a neural network that are adjusted throughout the training phase. Their significance is as follows:
Weights: These coefficients are assigned to the inputs within the neural network. Each input is multiplied by a corresponding weight, indicating the input’s relevance to the prediction. During the training process, the model identifies the most effective weights by minimizing the error or loss function, which measures the discrepancy between predicted and actual outputs.
Bias: These parameters are added to the weighted sum of inputs, enabling the model to produce predictions even when all inputs are zero. Bias facilitates adjustments to the output in conjunction with the weights. They enhance the network’s adaptability, allowing the activation function to be shifted for a better fit to the data.
Weights and Biases: Weights & Biases (W&B) is a widely used tool for monitoring, visualizing, and refining machine learning experiments.
In the context of deep learning, a batch is defined as a portion of the training dataset utilized during a single iteration of the training process. Rather than employing the entire dataset to compute gradients and adjust weights, which would be computationally intensive, the data is segmented into smaller batches. This method accelerates the training process and may enhance the model’s ability to generalize. The term "batch size" denotes the number of training samples contained within a single batch. A mini-batch represents a smaller subset of the training data, allowing for training to occur across multiple mini-batches. The size of the mini batch is a hyperparameter that can be optimized.
An epoch signifies a complete traversal of the entire training dataset. Throughout each epoch, the model processes the full dataset once, modifying its weights after each batch (or mini-batch). Typically, training is conducted over several epochs, with the model’s performance gradually im- improving as training advances. The number of epochs is another hyperparameter that can be fine-tuned.
Overfitting is a phenomenon that arises when a model captures not only the fundamental patterns within the training data but also the noise and outliers, resulting in strong performance on the training data but poor performance on new, unseen data (test data). This situation often occurs when the model’s complexity exceeds the amount of available data or when it undergoes excessive training across epochs. The occurrence of overfitting can be attributed to a model possessing an excessive number of parameters (for instance, an abundance of layers or neurons in a neural network) and being trained for an extended duration.
Consequently, the model may become overly tailored to the training data, effectively memorizing it rather than learning to generalize, which diminishes its efficacy when confronted with new data. In deep learning, we need to do data preprocessing. First thing, we remove rows that contain blanks and outliers. The second step is to perform standardization or normalization, which is crucial for performing accurate deep learning algorithms.
Deep learning is based on a linear transformation:
z= Wx+b
where W are weights, x stands for input, b is the bias, and z is a linear output.
An artificial neuron will then be presented as:
The algorithm works as follows: The loss function L itself is not directly updated; instead, it is used to update the model's parameters (weights) during training. The process generally follows these steps: 1. Forward Pass:
1) The model makes a prediction based on input data. The predicted output is compared to the actual target using the loss function, which measures error.
2) Computer Gradient (Backpropagation):
The loss function is differentiated with respect to model parameters. Gradients are calculated using the chain rule to determine how each parameter contributed to the error.
3) Update Parameters (Optimization Step):
An optimizer (e.g., Stochastic Gradient Descent, Adam) updates the model parameters using the computed gradients. Parameters are updated using formulas (
2)-(
3). Steps 1-3 are repeated for multiple epochs until the loss function reaches an optimal or satisfactory value.
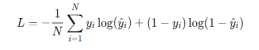
For binary classification, the loss function is given by:
When solving a regression or classification problem, the last layer of a neural network typically contains only one unit. If the activation function of the last unit is linear, then the neural network is a regression model; if the activation function is a logistic function, the neural network is a binary classification model. The results of the lung cancer data are shown in
Figure 12:
Figure 12. Confusion matrix for conventional deep learning.
The classification report is shown in
Table 2:
precision | recall | | f1-score | support |
0 | 0.86 | 0.84 | 0.85 | 511 |
1 | 0.84 | 0.86 | 0.85 | 490 |
accuracy | | | 0.85 | 1001 |
macro avg | 0.85 | 0.85 | 0.85 | 1001 |
weighted avg | 0.85 | 0.85 | 0.85 | 1001 |
In the next section, we will show a method to significantly boost the accuracy of classification.
4. Accuracy Improvement
4.1. Augmented Data and AI
Dr. Philip de Melo
| [12] | P. de Melo, “How to improve performance of Artificial Intelligence with artificial data”, Google publication, 2024. |
[12]
argues that the future of artificial intelligence (AI) lies in synthetic and augmented data. Many of the most significant technical and legal challenges associated with AI stem from the need to gather vast amounts of real-world data to train machine learning (ML) models. As of 2024, the world generates approximately 147 zettabytes (ZB) of data annually, with projections indicating an increase to 181 ZB by the end of 2025. This equates to approximately 402.74 million terabytes (TB) of data created, captured, copied, or consumed daily. However, collecting such data is often difficult and very expensive, and it raises serious concerns about privacy violations, bias in automated decision-making, and widespread copyright infringement. The paradox is that a vast majority of the collected data is of poor quality.
In addition to needing vast amounts of data, machine learning (ML) systems require high-quality data. Much of the data available in real-world settings tends to be incomplete or partially inaccurate. Data scientists work to address these issues by removing incomplete records, inputting missing values, and performing other data "cleaning" tasks, but these processes further add to the cost and complexity of collecting usable training data. One survey found that 96% of companies trying to deploy ML applications struggle with the challenge of obtaining high-quality data
| [13] | Evan Nisselson, Deep Learning with Synthetic Data Will Democratize the Tech Industry, techcrunch (May 11, 2018, 11: 11 AM), https://perma.cc/7UU6-W5KM |
[13]
.
Poor-quality data can significantly degrade data science. Here are some significant impacts:
1) Bad decisions: If the data is incorrect, incomplete, or outdated, any decision made using it can also be wrong, leading to lost money, missed opportunities, or even greater risks.
2) Wasted resources: Teams spend extra time cleaning, verifying, and fixing bad data, pulling focus from more important work.
3) Loss of trust: If customers or stakeholders notice errors, they might lose confidence in your product, service, or company.
4) Compliance issues: In regulated industries, poor data quality can cause legal trouble if reporting is inaccurate.
5) Poor customer experience: Think wrong addresses, wrong names, wrong recommendations — customers get frustrated quickly.
6) Missed revenue: With inaccurate data, companies can miss upsell or cross-sell opportunities or target the wrong audiences.
Poor data quality in healthcare can have huge and serious impacts, both immediately and long-term. Here are some major impacts:
1) Patient Safety Risks: Incorrect or missing data (such as allergies, medications, or medical history) can lead to misdiagnosis, incorrect treatments, or even life-threatening errors.
2) Delayed Care: Inaccurate or incomplete information means doctors may need to redo tests or spend extra time verifying facts, slowing down critical decision-making.
3) Increased Costs: Errors led to repeat tests, incorrect billing, insurance issues, and lawsuits — all of which can drive up healthcare costs for providers, insurers, and patients.
4) Poor Research and Public Health Decisions: Healthcare research depends on reliable data. Poor data can skew studies, rendering public health policies, drug development, and treatment guidelines less effective.
5) Loss of Trust: Patients, insurers, and providers lose confidence in healthcare systems when mistakes happen due to bad data.
6) Regulatory and Legal Consequences: Healthcare organizations are required to maintain accurate records (e.g., HIPAA, GDPR). Bad data can lead to compliance violations and substantial fines.
7) Worsened Health Outcomes: Over time, populations suffering from chronic diseases may go unmanaged, outbreaks may not be detected early, and healthcare inequalities can deepen.
Synthetic data brings a range of technical and legal advantages. It can significantly lower the cost of data acquisition, help avoid privacy violations, reduce bias in automated systems, and mitigate the risk of copyright infringement.
This paper examines the application of PM GenAI and synthetic data to significantly enhance the accuracy of classification and regression in various domains.
With more data, deep learning models could learn more intricate patterns and generalize better to unseen data. Larger datasets help reduce the risk of overfitting, where the model becomes overly reliant on the training data and performs poorly on new data. However, more data requires more computational power and time to process. Training a model on large datasets can be computationally expensive and time-consuming, often requiring specialized hardware, such as Graphics Processing Units/ Tensor Processing Units (GPUs/TPUs) and optimized algorithms.
When we have a large dataset, we can typically afford to use more complex models (larger networks with more layers and parameters), as there's enough data to prevent overfitting. Larger datasets allow deep learning models to fully utilize their potential. While large datasets are often sufficient, data augmentation techniques (such as rotation, flipping, cropping, etc.) can be beneficial for introducing variety and enhancing the model's ability to generalize. A larger dataset is more likely to cover a wider variety of scenarios, which can help the model learn a more diverse range of patterns. However, if the dataset is not representative of real-world conditions, it can still introduce bias.
While large datasets are generally ideal for training deep models from scratch, transfer learning (using a pre-trained model) can still work effectively. In these cases, we can fine-tune a pre-trained model on the large dataset, saving time and resources. Large datasets enable better model accuracy, generalization, and the ability to use complex models but come with increased computational requirements and longer training times.
When a dataset is small, the model might not learn enough to generalize well, leading to overfitting. The model may memorize specific features and fail to adapt to real-world variations, resulting in poor performance on tests or unseen data. Smaller datasets are faster to process, requiring less time and computational resources. This can be an advantage in cases where quick experimentation is needed, but it often leads to reduced model accuracy as mentioned.
For smaller datasets, simpler models (with fewer parameters and layers) are often more effective. If you use a too complex model with too little data, the model may learn to overfit the data, thereby reducing its ability to generalize. When dealing with small datasets, data augmentation is often used to artificially increase the dataset size. Additionally, synthetic data generation techniques (such as GANs or other simulation methods) can be employed to create more data, helping to mitigate the issue of overfitting.
A smaller dataset may not capture the full variability of the problem space, resulting in a model that performs well under certain conditions but struggles when faced with variations not represented in the data. When dealing with smaller datasets, transfer learning is particularly valuable. We can take a model pre-trained on a large dataset and fine-tune it for a specific task with far less data.
Small datasets pose a risk of overfitting and often necessitate data augmentation, simpler models, or transfer learning to perform adequately. The data set sources were considered in
| [14] | National Lung Screening Trial Research Team, Aberle DR, Adams AM, Berg CD, Black WC, Clapp JD, et al. Reduced lung-cancer mortality with low-dose computed tomographic screening. N Engl J Med 2011 Aug 04; 365(5): 395-409. |
| [15] | de Koning HJ, van der Aalst CM, de Jong PA, Scholten ET, Nackaerts K, Heuvelmans MA, et al. Reduced lung-cancer mortality with volume CT screening in a randomized trial. N Engl J Med 2020 Feb 06; 382(6): 503-513. |
| [16] | Moyer VA, U.S. Preventive Services Task Force. Screening for lung cancer: U.S. Preventive Services Task Force recommendation statement. Ann Intern Med 2014 Mar 04; 160(5): 330-338. |
| [17] | Wood DE, Kazerooni EA, Baum SL, Eapen GA, Ettinger DS, Hou L, et al. Lung cancer screening, version 3.2018, NCCN clinical practice guidelines in oncology. J Natl Compr Canc Netw 2018 Apr; 16(4): 412-441. |
[14-17]
.
The prediction of lung cancer was discussed in
| [18] | Katki HA, Kovalchik SA, Petito LC, Cheung LC, Jacobs E, Jemal A, et al. Implications of nine risk prediction models for selecting ever-smokers for computed tomography lung cancer screening. Ann Intern Med 2018 Jul 03; 169(1): 10-19. |
| [19] | Ruano-Ravina A, Pérez-Ríos M, Casàn-Clará P, Provencio-Pulla M. Low-dose CT for lung cancer screening. Lancet Oncol 2018 Mar; 19(3): e131-e132. |
| [20] | Bach PB, Kattan MW, Thornquist MD, Kris MG, Tate RC, Barnett MJ, et al. Variations in lung cancer risk among smokers. J Natl Cancer Inst 2003 Mar 19; 95(6): 470-478. |
| [21] | Cassidy A, Myles JP, van Tongeren M, Page RD, Liloglou T, Duffy SW, et al. The LLP risk model: an individual risk prediction model for lung cancer. Br J Cancer 2008 Jan 29; 98(2): 270-276. |
| [22] | Hoggart C, Brennan P, Tjonneland A, Vogel U, Overvad K, Østergaard JN, et al. A risk model for lung cancer incidence. Cancer Prev Res (Phila) 2012 Jun; 5(6): 834-846. |
| [23] | Iyen-Omofoman B, Tata LJ, Baldwin DR, Smith CJP, Hubbard RB. Using socio-demographic and early clinical features in general practice to identify people with lung cancer earlier. Thorax 2013 May; 68(5): 451-459. |
[18-23]
using socio-demographic and early clinical features in general practice to identify people with lung cancer earlier. A risk prediction model for lung cancer incidence was considered in
| [24] | Marcus MW, Chen Y, Raji OY, Duffy SW, Field JK. LLPi: Liverpool Lung Project risk prediction model for lung cancer incidence. Cancer Prev Res (Phila) 2015 Jun; 8(6): 570-575 |
| [25] | Spitz MR, Hong WK, Amos CI, Wu X, Schabath MB, Dong Q, et al. A risk model for prediction of lung cancer. J Natl Cancer Inst 2007 May 02; 99(9): 715-726. |
| [26] | Wang X, Zhang Y, Hao S, Zheng L, Liao J, Ye C, et al. Prediction of the 1-year risk of incident lung cancer: prospective study using electronic health records from the state of Maine. J Med Internet Res 2019 May 16; 21(5): e13260 |
| [27] | Wilson DO, Weissfeld J. A simple model for predicting lung cancer occurrence in a lung cancer screening program: The Pittsburgh Predictor. Lung Cancer 2015 Jul; 89(1): 31-37. |
[24-27]
.
Ardila discusses end-to-end lung cancer screening with three-dimensional deep learning on low-dose chest computed tomography
| [28] | Ardila D, Kiraly AP, Bharadwaj S, Choi B, Reicher JJ, Peng L, et al. End-to-end lung cancer screening with three-dimensional deep learning on low-dose chest computed tomography. Nat Med 2019 Jun; 25(6): 954-961. |
[28]
.
| [28] | Ardila D, Kiraly AP, Bharadwaj S, Choi B, Reicher JJ, Peng L, et al. End-to-end lung cancer screening with three-dimensional deep learning on low-dose chest computed tomography. Nat Med 2019 Jun; 25(6): 954-961. |
[28]
used morphological feature extraction and KNG‐CNN (Knowledge-Navigated Graph Convolutional Neural Network) classification of CT images for early lung cancer detection.
| [29] | Jena S, George S. Morphological feature extraction and KNG-CNN classification of CT images for early lung cancer detection. Int J Imaging Syst Technol 2020 Jun 09; 30(4): 1324-1336. |
[29]
developed an advanced lung cancer classification approach adopting modified graph clustering and whale optimization‐based feature selection technique, accompanied by a hybrid ensemble classifier.
Yeh et al. developed a new artificial Intelligence-Based prediction algorithm for lung cancer risk using electronic medical records: a deep learning approach
| [30] | Yeh MCH, Wang YH, Yang HC, Bai KJ, Wang HH, Li YCJ Artificial Intelligence-Based Prediction of Lung Cancer Risk Using Nonimaging Electronic Medical Records: Deep Learning Approach J Med Internet Res 2021; 23(8): e26256 https://doi.org/10.2196/26256 |
[30]
.
4.2. Augmented Data Generation
Generating synthetic data can be a complex process that often requires specialized tools and software designed to create and manipulate datasets. Fortunately, several platforms and libraries are available that enable developers and researchers to produce synthetic data efficiently. One of the most popular options is TensorFlow, an open-source platform developed by Google. TensorFlow offers a range of tools for building and training neural networks, including Generative Adversarial Networks (GANs), which are commonly used for generating synthetic data.
With its extensive community support and thorough documentation, TensorFlow is a favored choice among both newcomers and seasoned AI professionals. Another widely used tool is PyTorch, a deep learning library known for its flexibility and user-friendly design. PyTorch also supports the creation and training of GAN models and other sophisticated synthetic data techniques, making it a trusted solution in the scientific community. For specialized needs, such as generating synthetic data for healthcare applications, platforms like Synthea are available.
Synthea is an open-source patient simulator that produces synthetic health records based on real-world clinical data, offering detailed information on fictional patients, their diagnoses, treatments, and outcomes. It is particularly valuable for projects that require realistic healthcare datasets.
Generating synthetic medical data plays a vital role in clinical research. Rather than relying on real patient information, which can be expensive and challenging to access due to privacy concerns, researchers can create synthetic datasets that replicate the patterns and features of actual medical data. This approach enables studies and analyses to be conducted without direct access to sensitive personal information. Additionally, synthetic data can be utilized to train artificial intelligence (AI) models and machine learning algorithms for tasks such as disease prediction, identifying risk factors, and developing personalized treatments. One of the key benefits of synthetic medical data is that it supports research efforts when real data is unavailable, whether due to confidentiality issues, limited access, or legal barriers. It also enables the simulation of clinical trials and modeling of various scenarios without compromising patient privacy.
On a global level, synthetic data enables significant breakthroughs in research, development, and public policy. For example, in the field of healthcare, synthetic data transforms biomedical research by providing realistic clinical data to study diseases without compromising patient privacy. This data can be used to train AI algorithms in early disease detection, improve medical treatments, and personalize care for patients.
Data augmentation is about applying transformations to your data to create new, synthetic samples that are different but mathematically consistent with the original dataset. This helps prevent overfitting and improves generalization, especially in machine learning models.
A dataset can be presented as:
Where x is the input and y is the label. Given a data point (x, y), the augmented data can be expressed as:
Where the augmented data set is:
T is a map. It maps input back into input, preserving label y. It is essential to note that although synthetic data and data augmentation both aim to expand and diversify training datasets, they are distinct approaches. Synthetic data is created entirely from scratch, whereas data augmentation modifies existing training examples to produce new ones. Synthetic data offers additional advantages, including enhanced privacy and security, as well as addressing data scarcity. However, if not carefully designed, it can introduce biases or lack realism. In contrast, data augmentation is constrained by the quality and diversity of the original dataset. Using both synthetic data and data augmentation together can help achieve optimal results in deep learning applications.
Data augmentation can help mitigate overfitting, a common challenge in deep learning where a model becomes too specialized to the training data, leading to poor performance on new, unseen data. By creating additional augmented examples, data augmentation enables the model to generalize more effectively and improve its performance on new data.
Data augmentation can also address class imbalance, a frequent issue in deep learning where some classes have significantly fewer examples than others. By generating additional examples for underrepresented classes, data augmentation enables the model to learn more effectively and make more accurate predictions.
Data augmentation can boost the diversity of the training data by generating additional examples with varied properties and characteristics. This helps the model learn more effectively and prevents it from overfitting specific patterns in the training data.
We will use a PM GenAI
| [12] | P. de Melo, “How to improve performance of Artificial Intelligence with artificial data”, Google publication, 2024. |
[12]
approach to augment data for deep learning. Let us consider a data set, a subset of recorded data. Firstly, we need to specify a 17-dimensional vector X (where 17 is the number of features in the lung cancer dataset) and labels y (which are 0 and 1). We can then build a probabilistic model for the classification problem: p(x| y = 0) and p(x| y = 1).
This means that for each vector x, we assign a conditional probability (likelihood) corresponding to its label. In the case of Gaussian statistics, a multivariate probability density function is defined in
| [12] | P. de Melo, “How to improve performance of Artificial Intelligence with artificial data”, Google publication, 2024. |
[12]
via the covariance matrix and its module.
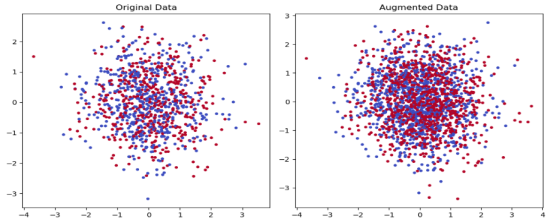
We can then generate augmented data within each batch, increasing its size (
Figure 13b).
Figure 13. Original (a) and augmented data (b) for 2 classes (no lung cancer and lung cancer).
The overall procedure consists of the following steps:
1) The lung cancer data was explored and visualized using Pandas data frame. This included converting zeroes to NaN.
2) The outliers were removed using the Z-score and IQR method (for non-normal distributions).
3) Missing data was eliminated.
4) The data was standardized by the Min/Max method.
5) The data was divided into two categories: 80% for testing and 20% for training. We used a stratified split.
6) PM GenAI was used to examine the data and present it in terms of clusters.
7) Each cluster was examined in terms of its likelihood. Elements of low likelihood were dropped.
8) To mitigate overfitting, we employed a combination of observed and synthetic data, utilizing a mini-batch approach. To avoid data leakage, we processed each mini-batch independently during forward and backward passes. The model updates its weight after each batch (or after accumulating gradients over several batches, depending on the optimizer settings).
9) The selected high-quality data within each cluster was augmented.
10) A deep learning algorithm was applied to the new data. Adam optimizer was used. We use the Adam optimizer to adjust the learning rate automatically for each parameter.
11) The accuracy was then evaluated and compared with that of other technologies.
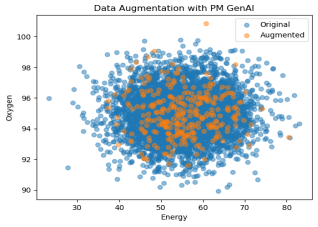
Figure 14 illustrates the original data and the generated data.
Figure 14. Original (blue) and generated data (orange).
The choice of hyperparameters:
The number of epochs is the number of full passes through the entire training dataset. More epochs can lead to better learning, but too many can result in overfitting (where the model memorizes rather than generalizes). To significantly reduce overfitting and increase the number of epochs, we use larger datasets that combine observed and synthetic data, as well as mini-batches.
Batch size is the number of samples processed before the model’s internal parameters (weights) are updated. Small batch sizes use less memory, and more updates per epoch can lead to noisy gradients but may help generalization.
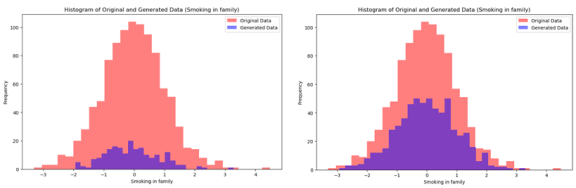
Large batch sizes lead to smoother gradient updates but need more memory and might converge more slowly or to a less optimal solution. We start with a batch size of 64 and 50 epochs with early stopping to prevent overfitting. We did not use dropout as the PM GenAI drops elements of the neural network with low likelihood. The original and produced data sets by PM GenAI are depicted in
Figures 15a and 15b (for
smoking) and 16a, b (for smoking in the family).
Figure 15. a): PM GenAI generates 100 new (blue) samples b) 300 samples for the “smoking” feature.
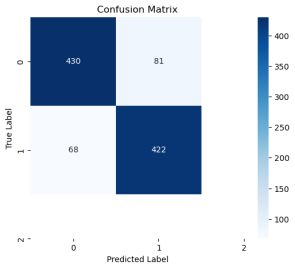
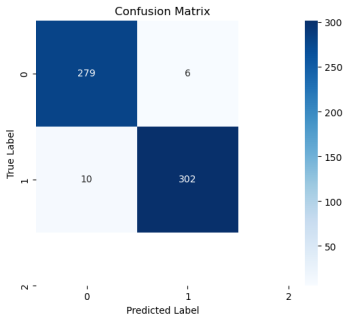
The final step is to remove the data points with low likelihood. We will then apply deep learning to the augmented batches of data. The confusion matrix is illustrated in
Figure 16, while the classification report displays the method's accuracy, precision, and recall.
Figure 16. a): PM GenAI generates 100 new (blue) samples b) 300 samples for the “smoking in family” feature.
Figure 17. The confusion plot of the PIMA data set with PM GenAI algorithm.
Table 3 presents the classification report, which shows a significant improvement in accuracy and sensitivity.
Table 3. The classification report shows significantly improved accuracy, precision, and recall of the lung cancer classification.
0.9731993299832495 (597,) |
precision | recall | | f1-score | support |
0 | 0.97 | 0.98 | 0.97 | 285 |
1 | 0.98 | 0.97 | 0.97 | 312 |
accuracy | | | 0.97 | 597 |
macro avg | 0.97 | 0.97 | 0.97 | 597 |
weighted avg | 0.97 | 0.97 | 0.97 | 597 |
External validation: Statistical analysis of the results (p-value) shows that the comparison of previous methods (
Figure 11) and the PM GenAI algorithm’s accuracy yields:
P ~ 0.004 << 0.05
And statistically significant. We can conclude that the PM GenAI algorithm significantly enhances the performance of classification algorithms for diabetes.
The study
| [30] | Yeh MCH, Wang YH, Yang HC, Bai KJ, Wang HH, Li YCJ Artificial Intelligence-Based Prediction of Lung Cancer Risk Using Nonimaging Electronic Medical Records: Deep Learning Approach J Med Internet Res 2021; 23(8): e26256 https://doi.org/10.2196/26256 |
[30]
presented a model with AUC of 0.821 when the input image-like array included sequential diagnostic information only. By contrast, the AUC was 0.894 when the input features included sequential medication information only; when the sequential diagnostic and medication information was simplified to binary variables, the model performance decreased (AUC=0.827). When both sequential diagnostic and medication information were integrated, the model reached an AUC of 0.902 on prospective testing, with a sensitivity of 0.804 and specificity of 0.837. The calibration of the model showed a median expected error of 0.125.
The model's performance at different age cutoffs was then investigated. Screening using an age cutoff of 55 years yielded a superior AUC of 0.871 compared to those obtained with cutoffs of 50 or 60 years (0.866 and 0.863, respectively). The comparison presented in this paper demonstrates that the new AI algorithm can significantly enhance the accuracy of lung cancer classification.
5. SWOT Analysis
Although the algorithm presented in this paper gives high-accuracy results, a SWOT (Strengths, Weaknesses, Opportunities, and Threats) analysis will be beneficial.
S - Strengths
These are the internal factors or capabilities that give an advantage in lung cancer classification.
1) High diagnostic accuracy of the algorithm.
2) Integration of multi-modal data (e.g., CT scans, pathology, genomics).
3) Non-invasive techniques, such as radiomics or liquid biopsy.
4) Early detection algorithms are improving prognosis.
5) Growing datasets (e.g., NLST, LIDC-IDRI) enabling robust model training.
W - Weaknesses
These are internal limitations or challenges that hinder classification performance.
1) Lack of labeled data and class imbalance (fewer positive cases).
2) The black-box nature of many AI models limits interpretability.
3) Limited generalizability across populations or institutions.
O - Opportunities
External factors or trends that can be leveraged for advancement.
1) Advancements in AI/ML, particularly explainable AI (XAI).
2) Integration with electronic health records (EHRs) for holistic analysis.
3) Personalized medicine approaches using genomic and molecular data.
4) Collaboration with healthcare providers and regulatory bodies.
5) Growing interest and funding in cancer informatics and AI in the field of medicine.
T - Threats
External risks or challenges that could negatively affect classification systems.
1) Data privacy and regulatory concerns (e.g., HIPAA, GDPR).
2) Potential biases in AI models due to non-representative datasets.
3) Rapidly evolving standards and technology obsolescence.
4) Integration issues with existing clinical workflows.
6. Conclusion
In conclusion, informatics plays a pivotal role in the management, research, and treatment of lung cancer. The integration of advanced technologies and data analytics has the potential to significantly improve the lives of individuals with diabetes, empowering them to better manage their condition while also enhancing the efficiency and effectiveness of healthcare providers. However, for lung cancer informatics to reach its full potential, challenges such as data privacy, system integration, and education must be addressed.
With continued advancements in technology and a commitment to improving patient care, lung cancer informatics will undoubtedly play a crucial role in the future of lung cancer management. In the healthcare industry, a wealth of patient data is available. Machine learning, both supervised and unsupervised, has the potential to convert this data into a valuable resource for predictive analysis. Deep learning algorithms, based on the neural network concept, have become increasingly attractive. However, the accuracy of deep learning and other methods lacks the required accuracy.
In this paper, we present a novel approach based on deep learning that utilizes mini-batches to augment the training dataset, thereby mitigating overfitting. We reached the accuracy of 97-98.5%. The method can be used to classify other diseases accurately
| [13] | Evan Nisselson, Deep Learning with Synthetic Data Will Democratize the Tech Industry, techcrunch (May 11, 2018, 11: 11 AM), https://perma.cc/7UU6-W5KM |
[13]
.
We conducted an accuracy evaluation of nearly all machine learning algorithms. Our conclusion is that:
1) The hybrid mini-batch method demonstrated in this paper yields better performance than any other ML algorithms.
2) Feature engineering identifies the most important features that impact the development of lung cancer.
3) Smoking is one of the first items that is tracked in patients at higher risk of lung cancer.
Embedding this algorithm into EHR and other health systems is a significant challenge and can be a focus of future research.
Abbreviations
HIPAA | Health Insurance Portability and Accountability Act |
GDPR | General Data Protection Regulation, a European Union (EU) Law That Governs How Personal Data Is Collected, Processed, Stored, and Shared |
PM GenAI | Principal Model Generative Artificial Intelligence |
NLST | National Lung Screening Trial |
LIDC-IDRI | Lung Image Database Consortium and Image Database Resource Initiative |
Author Contributions
Philip de Melo is the sole author. The author read and approved the final manuscript.
Conflicts of Interest
The authors declare that they have no conflicts of interest.
References
[1] P. de Melo and M. Davtyan, “High Accuracy Classification of Populations with Breast Cancer: SVM Approach”, Cancer Research Journal 2023; 11(3): 94-104
https://doi.org/10.11648/j.crj.20231103.13[2] E. Svoboda “Artificial intelligence is improving the detection of lung cancer”, Nature, 587 (2020), pp. S20-S22.
[3] Y. Abe, K. Hanai, M. Nakano, Y. Ohkubo, T. Hasizume, T. Kakizaki, et al. “A computer-aided diagnosis (CAD) system in lung cancer screening with computed tomography”. Anticancer Res, 25 (2005), pp. 483-488.
[4] P. de Melo, “Public Health Informatics and Technology’, 2024, ISBN- 979-8894090955.
[5] A. McWilliams, M.C. Tammemagi, J.R. Mayo, H. Roberts, G. Liu, K. Soghrati, et al. Probability of cancer in pulmonary nodules detected on first screening CT, N Engl J Med, 369 (2013), pp. 910-919.
[6] M. Buty, Z. Xu, M. Gao, U. Bagci, A. Wu, D. Mollura, Characterization of lung nodule malignancy using hybrid shape and appearance features
[7] S. Ourselin, L. Joskowicz, M. Sabuncu, G. Unal, W. Wells (Eds.), Medical image computing and computer-assisted intervention, Springer, Cham (2016). p. 662-70.
[8] Earnest, A., Tesema, G. A. & Stirling, R. G. “Machine learning techniques to predict timeliness of care among lung cancer patients”. Healthcare. 11(20), 2756 (2023).
[9] Chandran, U., “Machine learning and real-world data to predict lung cancer risk in routine care”. Cancer Epidemiol. Biomark. Prevent. 32(3), 337-343 (2023).
[10] Qureshi, R., “Machine learning based personalized drug response prediction for lung cancer patients”. Sci. Rep. 12(1), 18935 (2022).
[11] Satya Prakash Maurya, Pushpendra Singh Sisodia, Rahul Mishra. Devesh Pratap singh “Performance of machine learning algorithms for lung cancer prediction: a comparative approach”, Scientific Reports (Sci Rep), ISSN 2045-2322.
[12] P. de Melo, “How to improve performance of Artificial Intelligence with artificial data”, Google publication, 2024.
[13] Evan Nisselson, Deep Learning with Synthetic Data Will Democratize the Tech Industry, techcrunch (May 11, 2018, 11: 11 AM),
https://perma.cc/7UU6-W5KM[14] National Lung Screening Trial Research Team, Aberle DR, Adams AM, Berg CD, Black WC, Clapp JD, et al. Reduced lung-cancer mortality with low-dose computed tomographic screening. N Engl J Med 2011 Aug 04; 365(5): 395-409.
[15] de Koning HJ, van der Aalst CM, de Jong PA, Scholten ET, Nackaerts K, Heuvelmans MA, et al. Reduced lung-cancer mortality with volume CT screening in a randomized trial. N Engl J Med 2020 Feb 06; 382(6): 503-513.
[16] Moyer VA, U.S. Preventive Services Task Force. Screening for lung cancer: U.S. Preventive Services Task Force recommendation statement. Ann Intern Med 2014 Mar 04; 160(5): 330-338.
[17] Wood DE, Kazerooni EA, Baum SL, Eapen GA, Ettinger DS, Hou L, et al. Lung cancer screening, version 3.2018, NCCN clinical practice guidelines in oncology. J Natl Compr Canc Netw 2018 Apr; 16(4): 412-441.
[18] Katki HA, Kovalchik SA, Petito LC, Cheung LC, Jacobs E, Jemal A, et al. Implications of nine risk prediction models for selecting ever-smokers for computed tomography lung cancer screening. Ann Intern Med 2018 Jul 03; 169(1): 10-19.
[19] Ruano-Ravina A, Pérez-Ríos M, Casàn-Clará P, Provencio-Pulla M. Low-dose CT for lung cancer screening. Lancet Oncol 2018 Mar; 19(3): e131-e132.
[20] Bach PB, Kattan MW, Thornquist MD, Kris MG, Tate RC, Barnett MJ, et al. Variations in lung cancer risk among smokers. J Natl Cancer Inst 2003 Mar 19; 95(6): 470-478.
[21] Cassidy A, Myles JP, van Tongeren M, Page RD, Liloglou T, Duffy SW, et al. The LLP risk model: an individual risk prediction model for lung cancer. Br J Cancer 2008 Jan 29; 98(2): 270-276.
[22] Hoggart C, Brennan P, Tjonneland A, Vogel U, Overvad K, Østergaard JN, et al. A risk model for lung cancer incidence. Cancer Prev Res (Phila) 2012 Jun; 5(6): 834-846.
[23] Iyen-Omofoman B, Tata LJ, Baldwin DR, Smith CJP, Hubbard RB. Using socio-demographic and early clinical features in general practice to identify people with lung cancer earlier. Thorax 2013 May; 68(5): 451-459.
[24] Marcus MW, Chen Y, Raji OY, Duffy SW, Field JK. LLPi: Liverpool Lung Project risk prediction model for lung cancer incidence. Cancer Prev Res (Phila) 2015 Jun; 8(6): 570-575
[25] Spitz MR, Hong WK, Amos CI, Wu X, Schabath MB, Dong Q, et al. A risk model for prediction of lung cancer. J Natl Cancer Inst 2007 May 02; 99(9): 715-726.
[26] Wang X, Zhang Y, Hao S, Zheng L, Liao J, Ye C, et al. Prediction of the 1-year risk of incident lung cancer: prospective study using electronic health records from the state of Maine. J Med Internet Res 2019 May 16; 21(5): e13260
[27] Wilson DO, Weissfeld J. A simple model for predicting lung cancer occurrence in a lung cancer screening program: The Pittsburgh Predictor. Lung Cancer 2015 Jul; 89(1): 31-37.
[28] Ardila D, Kiraly AP, Bharadwaj S, Choi B, Reicher JJ, Peng L, et al. End-to-end lung cancer screening with three-dimensional deep learning on low-dose chest computed tomography. Nat Med 2019 Jun; 25(6): 954-961.
[29] Jena S, George S. Morphological feature extraction and KNG-CNN classification of CT images for early lung cancer detection. Int J Imaging Syst Technol 2020 Jun 09; 30(4): 1324-1336.
[30] Yeh MCH, Wang YH, Yang HC, Bai KJ, Wang HH, Li YCJ Artificial Intelligence-Based Prediction of Lung Cancer Risk Using Nonimaging Electronic Medical Records: Deep Learning Approach J Med Internet Res 2021; 23(8): e26256
https://doi.org/10.2196/26256Biography
Philip de Melo is an American data scientist and academic. His research focuses on the development and implementation of new IT technologies, including artificial intelligence, machine learning, big data analytics, fast data interoperability, etc. in public health and health care. He was on the faculty of Columbia University (NYC) and Georgia Tech (Atlanta, GA). He served as a PI I for several projects sponsored by ONR, NSF, AFOSR, ONC, and the industrial project MIDAS. He is internationally renowned for the development of PM GenAI, a new AI algorithm designed to enhance the accuracy of disease diagnostics and provide a highly accurate classification of gene mutations. |
References
| [1] |
P. de Melo and M. Davtyan, “High Accuracy Classification of Populations with Breast Cancer: SVM Approach”, Cancer Research Journal 2023; 11(3): 94-104
https://doi.org/10.11648/j.crj.20231103.13
|
| [2] |
E. Svoboda “Artificial intelligence is improving the detection of lung cancer”, Nature, 587 (2020), pp. S20-S22.
|
| [3] |
Y. Abe, K. Hanai, M. Nakano, Y. Ohkubo, T. Hasizume, T. Kakizaki, et al. “A computer-aided diagnosis (CAD) system in lung cancer screening with computed tomography”. Anticancer Res, 25 (2005), pp. 483-488.
|
| [4] |
P. de Melo, “Public Health Informatics and Technology’, 2024, ISBN- 979-8894090955.
|
| [5] |
A. McWilliams, M.C. Tammemagi, J.R. Mayo, H. Roberts, G. Liu, K. Soghrati, et al. Probability of cancer in pulmonary nodules detected on first screening CT, N Engl J Med, 369 (2013), pp. 910-919.
|
| [6] |
M. Buty, Z. Xu, M. Gao, U. Bagci, A. Wu, D. Mollura, Characterization of lung nodule malignancy using hybrid shape and appearance features
|
| [7] |
S. Ourselin, L. Joskowicz, M. Sabuncu, G. Unal, W. Wells (Eds.), Medical image computing and computer-assisted intervention, Springer, Cham (2016). p. 662-70.
|
| [8] |
Earnest, A., Tesema, G. A. & Stirling, R. G. “Machine learning techniques to predict timeliness of care among lung cancer patients”. Healthcare. 11(20), 2756 (2023).
|
| [9] |
Chandran, U., “Machine learning and real-world data to predict lung cancer risk in routine care”. Cancer Epidemiol. Biomark. Prevent. 32(3), 337-343 (2023).
|
| [10] |
Qureshi, R., “Machine learning based personalized drug response prediction for lung cancer patients”. Sci. Rep. 12(1), 18935 (2022).
|
| [11] |
Satya Prakash Maurya, Pushpendra Singh Sisodia, Rahul Mishra. Devesh Pratap singh “Performance of machine learning algorithms for lung cancer prediction: a comparative approach”, Scientific Reports (Sci Rep), ISSN 2045-2322.
|
| [12] |
P. de Melo, “How to improve performance of Artificial Intelligence with artificial data”, Google publication, 2024.
|
| [13] |
Evan Nisselson, Deep Learning with Synthetic Data Will Democratize the Tech Industry, techcrunch (May 11, 2018, 11: 11 AM),
https://perma.cc/7UU6-W5KM
|
| [14] |
National Lung Screening Trial Research Team, Aberle DR, Adams AM, Berg CD, Black WC, Clapp JD, et al. Reduced lung-cancer mortality with low-dose computed tomographic screening. N Engl J Med 2011 Aug 04; 365(5): 395-409.
|
| [15] |
de Koning HJ, van der Aalst CM, de Jong PA, Scholten ET, Nackaerts K, Heuvelmans MA, et al. Reduced lung-cancer mortality with volume CT screening in a randomized trial. N Engl J Med 2020 Feb 06; 382(6): 503-513.
|
| [16] |
Moyer VA, U.S. Preventive Services Task Force. Screening for lung cancer: U.S. Preventive Services Task Force recommendation statement. Ann Intern Med 2014 Mar 04; 160(5): 330-338.
|
| [17] |
Wood DE, Kazerooni EA, Baum SL, Eapen GA, Ettinger DS, Hou L, et al. Lung cancer screening, version 3.2018, NCCN clinical practice guidelines in oncology. J Natl Compr Canc Netw 2018 Apr; 16(4): 412-441.
|
| [18] |
Katki HA, Kovalchik SA, Petito LC, Cheung LC, Jacobs E, Jemal A, et al. Implications of nine risk prediction models for selecting ever-smokers for computed tomography lung cancer screening. Ann Intern Med 2018 Jul 03; 169(1): 10-19.
|
| [19] |
Ruano-Ravina A, Pérez-Ríos M, Casàn-Clará P, Provencio-Pulla M. Low-dose CT for lung cancer screening. Lancet Oncol 2018 Mar; 19(3): e131-e132.
|
| [20] |
Bach PB, Kattan MW, Thornquist MD, Kris MG, Tate RC, Barnett MJ, et al. Variations in lung cancer risk among smokers. J Natl Cancer Inst 2003 Mar 19; 95(6): 470-478.
|
| [21] |
Cassidy A, Myles JP, van Tongeren M, Page RD, Liloglou T, Duffy SW, et al. The LLP risk model: an individual risk prediction model for lung cancer. Br J Cancer 2008 Jan 29; 98(2): 270-276.
|
| [22] |
Hoggart C, Brennan P, Tjonneland A, Vogel U, Overvad K, Østergaard JN, et al. A risk model for lung cancer incidence. Cancer Prev Res (Phila) 2012 Jun; 5(6): 834-846.
|
| [23] |
Iyen-Omofoman B, Tata LJ, Baldwin DR, Smith CJP, Hubbard RB. Using socio-demographic and early clinical features in general practice to identify people with lung cancer earlier. Thorax 2013 May; 68(5): 451-459.
|
| [24] |
Marcus MW, Chen Y, Raji OY, Duffy SW, Field JK. LLPi: Liverpool Lung Project risk prediction model for lung cancer incidence. Cancer Prev Res (Phila) 2015 Jun; 8(6): 570-575
|
| [25] |
Spitz MR, Hong WK, Amos CI, Wu X, Schabath MB, Dong Q, et al. A risk model for prediction of lung cancer. J Natl Cancer Inst 2007 May 02; 99(9): 715-726.
|
| [26] |
Wang X, Zhang Y, Hao S, Zheng L, Liao J, Ye C, et al. Prediction of the 1-year risk of incident lung cancer: prospective study using electronic health records from the state of Maine. J Med Internet Res 2019 May 16; 21(5): e13260
|
| [27] |
Wilson DO, Weissfeld J. A simple model for predicting lung cancer occurrence in a lung cancer screening program: The Pittsburgh Predictor. Lung Cancer 2015 Jul; 89(1): 31-37.
|
| [28] |
Ardila D, Kiraly AP, Bharadwaj S, Choi B, Reicher JJ, Peng L, et al. End-to-end lung cancer screening with three-dimensional deep learning on low-dose chest computed tomography. Nat Med 2019 Jun; 25(6): 954-961.
|
| [29] |
Jena S, George S. Morphological feature extraction and KNG-CNN classification of CT images for early lung cancer detection. Int J Imaging Syst Technol 2020 Jun 09; 30(4): 1324-1336.
|
| [30] |
Yeh MCH, Wang YH, Yang HC, Bai KJ, Wang HH, Li YCJ Artificial Intelligence-Based Prediction of Lung Cancer Risk Using Nonimaging Electronic Medical Records: Deep Learning Approach J Med Internet Res 2021; 23(8): e26256
https://doi.org/10.2196/26256
|
Cite This Article
-
APA Style
Melo, P. D. (2025). Accurate Diagnostics of Lung Cancer Using Prime Model Generative AI. Cancer Research Journal, 13(3), 81-97. https://doi.org/10.11648/j.crj.20251303.11
 Copy
|
Copy
|
 Download
ACS Style
Melo, P. D. Accurate Diagnostics of Lung Cancer Using Prime Model Generative AI. Cancer Res. J. 2025, 13(3), 81-97. doi: 10.11648/j.crj.20251303.11
Copy
|
Download
AMA Style
Melo PD. Accurate Diagnostics of Lung Cancer Using Prime Model Generative AI. Cancer Res J. 2025;13(3):81-97. doi: 10.11648/j.crj.20251303.11
Copy
|
Download
-
@article{10.11648/j.crj.20251303.11,
  author = {Philip de Melo},
  title = {Accurate Diagnostics of Lung Cancer Using Prime Model Generative AI
},
  journal = {Cancer Research Journal},
  volume = {13},
  number = {3},
  pages = {81-97},
  doi = {10.11648/j.crj.20251303.11},
  url = {https://doi.org/10.11648/j.crj.20251303.11},
  eprint = {https://article.sciencepublishinggroup.com/pdf/10.11648.j.crj.20251303.11},
  abstract = {Health informatics plays a crucial role in the early detection of lung cancer by enhancing the collection, analysis, and application of patient data in clinical settings. It enables the integration of data from electronic health records (EHRs), imaging, pathology reports, and even genomic information. Artificial Intelligence (AI) and Machine Learning (ML) technologies further support lung cancer detection by tracking disease progression over time, identifying changes that may suggest malignancy, and reducing false-positive and unnecessary procedures. A fundamental challenge, however, remains: many existing lung cancer prediction models report accuracy below 80%, emphasizing the need for more effective classification techniques. In this work, we introduce a novel approach that significantly improves predictive accuracy, achieving rates between 95% and 98% a notable advancement over current methods using the same dataset. This improvement is driven by a recently developed Generative AI technology, considered one of the most powerful tools for enhancing the performance of health informatics systems.},
 year = {2025}
}
Copy
|
Download
-
TY  - JOUR
T1  - Accurate Diagnostics of Lung Cancer Using Prime Model Generative AI

AU  - Philip de Melo
Y1  - 2025/07/04
PY  - 2025
N1  - https://doi.org/10.11648/j.crj.20251303.11
DO  - 10.11648/j.crj.20251303.11
T2  - Cancer Research Journal
JF  - Cancer Research Journal
JO  - Cancer Research Journal
SP  - 81
EP  - 97
PB  - Science Publishing Group
SN  - 2330-8214
UR  - https://doi.org/10.11648/j.crj.20251303.11
AB  - Health informatics plays a crucial role in the early detection of lung cancer by enhancing the collection, analysis, and application of patient data in clinical settings. It enables the integration of data from electronic health records (EHRs), imaging, pathology reports, and even genomic information. Artificial Intelligence (AI) and Machine Learning (ML) technologies further support lung cancer detection by tracking disease progression over time, identifying changes that may suggest malignancy, and reducing false-positive and unnecessary procedures. A fundamental challenge, however, remains: many existing lung cancer prediction models report accuracy below 80%, emphasizing the need for more effective classification techniques. In this work, we introduce a novel approach that significantly improves predictive accuracy, achieving rates between 95% and 98% a notable advancement over current methods using the same dataset. This improvement is driven by a recently developed Generative AI technology, considered one of the most powerful tools for enhancing the performance of health informatics systems.
VL  - 13
IS  - 3
ER  -
Copy
|
Download