Abstract
Introduction: Prostate cancer is a common malignancy affecting men beyond the middle age. In advanced countries, the life time risk of developing microscopic prostate cancer in men is 30%. However, it is slow-growing and the risk of developing clinical disease is 16%, while the lifetime risk is 3%. It is not common in those below 50 years, but after this age there is a steady increase in its incidence. The objective of this study was to determine the predictive value of prostate specific antigen density (PSAD), percentage free Prostate specific antigen and the combination (PSAD+%FPSA) for cancer detection in the grey zone at a tertiary health center in north central Nigeria. Methodology: A prospective study which was carried out over one year and three months. Each subject had a clinical evaluation involving relevant history, physical examination with digital rectal examination of the prostate gland, followed by blood sampling for both total and free PSA. These samples for PSA were sent to the chemical pathology laboratory. The percentage free PSA was calculated by finding the ratio between free PSA and total PSA and multiplying the result by 100. Also, a transabdominal ultrasound scan was done to determine the prostate volume. The PSA density was calculated by dividing the PSA by the total prostate volume. All patients had digitally guided transrectal prostate biopsy. The analysis were in 3 subsets; PSAD, %FPSA and the combination (PSAD+%FPSA). Results were analysed using SPSS version 20. P value <0.05 was considered significant. Charts and tables were used to express the data. The receiver operating characteristic curve (ROC) was used to determine the predictive power of PSAD and %FPSA, the combination (PSAD+%FPSA) in prostate cancer detection and hence the more predictive of them all. Results: Forty two men with mean age of 67.93 ± 7.11years who had PSA in the grey zone were recruited. Only 5(12%) had diagnosis of prostate adenocarcinoma. Mean age of those with adenocarcinoma was 69.40 ± 1.67years. There was no statistically significant correlation between prostate adenocarcinoma and the variables; PSAD, %FPSA and the combination (PSAD+%FPSA), with P values of 0.517, 0.453 and 0.451 respectively. However when the ROC curve was drawn, the AUC was highest for PSAD at 0.524 with a cut-off value of 0.108ng/ml2. While the AUC and cut-off was 0.373, 29.40 and 0.373, 30.50 for %FPSA and the combination (PSAD+%FPSA) respectively. Additionally, using a two-by-two table, the positive predictive value for adenocarcinoma was 21.1% for PSAD, compared to 11.9% for %FPSA and 7.1% for the combination. Conclusion: The study showed that PSAD was the most predictive of the 3 parameters. A PSAD cut-off value of 0.108 (sensitivity of 80% and specificity of 20%) is suggestive of prostate adenocarcinoma in patients with PSA in the grey zone.
Keywords
PSA Density, Predictive Value, Prostate Cancer, Intermediate PSA, Free PSA, Total PSA
1. Introduction
The prostate is a solid organ which is 18-26 g in weight and shaped like a chestnut or compressed inverted cone, with its base upwards and apex downwards; and surrounds the prostatic urethra which pierces it asymmetrically.
| [1] | Yeboah E. The prostate gland. In: Badoe E, Archampong E, da Rocha-Afodu J. (editors). Principles and Practice of Surgery including Pathology in the tropics. 4th ed. Accra: Ghana publishing co-operation.; 2009. p. 917–952. |
[1]
The anterior surface is blunt and rounded. The posterior surface is flattened and rests "against the lower 3 cm of the rectum, but separated from it by the prostatic capsule and the fascia Denonvilliers.
| [1] | Yeboah E. The prostate gland. In: Badoe E, Archampong E, da Rocha-Afodu J. (editors). Principles and Practice of Surgery including Pathology in the tropics. 4th ed. Accra: Ghana publishing co-operation.; 2009. p. 917–952. |
[1]
This is the portion that is palpated during digital rectal examination (DRE) of the prostate. Anatomically, it has four (4) zones-peripheral, transition, central and anterior fibromuscular stroma. Seventy percent of prostate cancers arise in the peripheral zone. The transitional zone gives rise to 20% of cancers, while the central zone accounts for 10%.
| [2] | Jonathan I. Pathology of prostatic Neoplasia. In: Louis RK, Alan WP, Andrew CN, Craig AP.(editors). campbell-walsh urology. 10th ed. philadelphia: WB saunders CO; 2012. p. 2726–2734. |
[2]
Prostate cancer is recognised as one of the principal health concerns for the male population worldwide. It is a leading cause of cancer mortality in men beyond the middle age.
| [1] | Yeboah E. The prostate gland. In: Badoe E, Archampong E, da Rocha-Afodu J. (editors). Principles and Practice of Surgery including Pathology in the tropics. 4th ed. Accra: Ghana publishing co-operation.; 2009. p. 917–952. |
[1]
The peak incidence is in the sixth to seventh decades of life. Prostate cancer incidence varies by race/ethnicity, with African-Americans at highest risk.
| [1] | Yeboah E. The prostate gland. In: Badoe E, Archampong E, da Rocha-Afodu J. (editors). Principles and Practice of Surgery including Pathology in the tropics. 4th ed. Accra: Ghana publishing co-operation.; 2009. p. 917–952. |
[1]
In Nigeria, it has been shown that the age adjusted incidence approaches that of African Americans and Jamaicans, at 300 per 100,000.
The hospital incidence among Nigerian men in 1997, showed 127 per 100,000,
while another study of a similar population in Nigeria reported an incidence of 114 per 100,000.
Screening programs for prostate cancer coupled with the increasing level of enlightenment has led to early detection of prostate cancer in their potentially curable forms in the developed economy. The situation is, however, different in the developing economies of sub-Saharan African countries and particularly in Nigeria, where organized screening programs are lacking; and late presentation is the norm.
| [6] | Oranusi CK, Mbieri UT, Oranusi IO, Nwofor AME. Prostate cancer awareness and screening among male public servants in Anambra state, Nigeria. African J Urol. 2012; 18(2): 72–74. https://doi.org/10.1016/J.AFJU.2012.04.016 |
[6]
Recognised screening tools are the digital rectal examination (DRE) and prostate specific antigen testing.
The PSA level is widely used as a test for detection of prostate cancer. It is the single most useful screening tool for prostate cancer detection. Many a time it is complemented with the DRE to improve its diagnostic efficacy.
| [7] | Carvalhal GF, Smith DS, Mager DE, Ramos C, Catalona WJ. Digital rectal examination for detecting prostate cancer at prostate specific antigen levels of 4 ng./ml. or less. J Urol. 1999; 161(3): 835–839. https://doi.org/10.1016/S0022-5347(01)61785-3 . |
[7]
However, PSA is organ specific but not disease specific, hence creating some limitations to its use in differentiating between benign causes of PSA elevation and prostate cancer. Notably, is the lack of specificity of PSA within the PSA range (4.0-10.0ng/ml), a diagnostic ‘grey zone’ in which cancer has been reported to be present in 25% of patients with a palpably enlarged benign prostate gland.
There have been several reports on clinical variables as well as advances in PSA, which may improve the specificity of PSA in the early detection of prostate cancer. These include PSA density, PSA density of the transition zone (PSATZ), % FPSA, age specific reference range, PSA molecular forms and PSA velocity.
| [8] | Börgermann C, Kliner S, Swoboda A, Luboldt H-J, Rübben H. Parameters to improve the specificity of the prostate-specific antigen : Early detection of prostate cancer. Urologe. 2001; 50(9): 1095-10100. https://doi.org/10.1007/s00120-011-2577-8 . |
[8]
The attributes and limitations of each of these modalities as tools for detection of prostate cancer have been investigated extensively with varying reports.
In urological practice PSAD and %FPSA stand out as the most commonly used and readily available parameters.
| [9] | Kochañska-Dziurowicz AA, Mielniczuk MR, Stojko A, Kaletka J. The clinical utility of measuring free-to-total prostate-specific antigen (PSA) ratio and PSA density in differentiating between benign prostatic hyperplasia and prostate cancer. Br J Int. 1998; 81(6): 834–838. https://doi.org/10.1046/j.1464-410x.1998.00643.x |
[9]
Prostate specific antigen density (PSAD), is the PSA secreted per unit volume of prostatic tissue.
| [10] | Udeh EI, Nnabugwu II, Ozoemena FO, Ugwumba FO, Aderibigbe ASO, Ohayi SR, et al. Prostate-specific antigen density values among patients with symptomatic prostatic enlargement in Nigeria. world J surg oncol. 2016; 14: 174. https://doi.org/10.1186/s12957-016-0921-6 |
[10]
It requires measurement of prostate volume and is expressed as PSA value divided by the prostate volume. Benson et al
| [11] | Benson MC, Whang IS, Pantuck A, Ring K, Kaplan SA, Olsson CA, et al. Prostate specific antigen density: a means of distinguishing benign prostatic hypertrophy and prostate cancer. J Urol. 1992; 147(3 Pt 2): 815–816. https://doi.org/10.1016/s0022-5347(17)37393-7 |
[11]
in 1992, first proposed the use of PSA density as a means of differentiating prostate cancer from the most frequent cause of PSA elevation, benign prostatic hyperplasia (BPH). PSA density has been proved to be important in evaluating men with ‘grey zone’ PSA levels (4-10 ng/ml) as it helps to reduce unnecessary biopsy and its associated complications, some of which may be very severe. There is documented variation in the PSA secreted per gram of tissue among different races. The Asians and Japanese are known to have more PSA secretion per gram of prostate tissue than the Caucasians, while African-Americans and the blacks secrete even higher PSA per gram of tissue than the Asians and Caucasians. One study by Udeh et al,
| [10] | Udeh EI, Nnabugwu II, Ozoemena FO, Ugwumba FO, Aderibigbe ASO, Ohayi SR, et al. Prostate-specific antigen density values among patients with symptomatic prostatic enlargement in Nigeria. world J surg oncol. 2016; 14: 174. https://doi.org/10.1186/s12957-016-0921-6 |
[10]
Nigeria, revealed a PSAD cut off of 0.04ng/ml among Nigerians for prostate cancer detection, which is lower than the international standard of 0.15ng/ml. The study was able to demonstrate an acceptable sensitivity of 95% and a specificity of 28% in prostate cancer detection using this cut off.
On the other hand, percentage FPSA has been shown to be a useful tool in counselling men with PSA elevations in the range of 4-10ng/ml regarding their risk for prostate cancer. It is gotten by finding the percentage of the ratio between the free and total PSA.
| [11] | Benson MC, Whang IS, Pantuck A, Ring K, Kaplan SA, Olsson CA, et al. Prostate specific antigen density: a means of distinguishing benign prostatic hypertrophy and prostate cancer. J Urol. 1992; 147(3 Pt 2): 815–816. https://doi.org/10.1016/s0022-5347(17)37393-7 |
[11]
In a prospective multi-institutional study of men aged 50 to 75 years with PSA levels of 4-10ng/ml and palpably benign prostate glands, a percentage of FPSA cut off of <25% detected 95% of cancers while avoiding 20% of unnecessary biopsies.
| [12] | Catalona WJ, Partin AW, Slawin KM, Brawer MK, Flanigan RC, Patel A, et al. Use of the Percentage of Free Prostate-Specific Antigen to Enhance Differentiation of Prostate Cancer From Benign Prostatic Disease. JAMA. 1998; 279(19): 1542-1547. https://doi.org/10.1001/jama.279.19.1542 |
[12]
In this study, the risk of cancers was stratified by levels of percentage of FPSA and ranged from 8% when the percentage of FPSA was more than 25% to 56% when the percentage of FPSA was 0% to 10%. Another study by Ezenwa et al
| [13] | Ezenwa E V., Tijani KH, Jeje EA, Soriyan OO, Ogunjimi MA, Ojewola RW, et al. The value of percentage free prostate specific antigen (PSA) in the detection of prostate cancer among patients with intermediate levels of total PSA (4.0-10.0 ng/mL) in Nigeria. Arab J Urol. 2012; 10(4): 394–401. https://doi.org/10.1016/j.aju.2012.05.004 |
[13]
in Nigeria has shown the value of %FPSA in Nigerians with intermediate level of PSA. The study puts the cut off for percentage FPSA at <40%, detecting 100% of Prostate cancer and allowing only 7% of unnecessary biopsies. According to Ezenwa et al
| [13] | Ezenwa E V., Tijani KH, Jeje EA, Soriyan OO, Ogunjimi MA, Ojewola RW, et al. The value of percentage free prostate specific antigen (PSA) in the detection of prostate cancer among patients with intermediate levels of total PSA (4.0-10.0 ng/mL) in Nigeria. Arab J Urol. 2012; 10(4): 394–401. https://doi.org/10.1016/j.aju.2012.05.004 |
[13]
, the prevalence of prostate cancer using a % free PSA cut-off of <40% is 13.3%.
Thus the values for both PSAD and %FPSA appear to be different with a varying cut off level among Nigerians. This differences may underscore the place of PSA variation with race, genetics and environmental factors.
Few studies have compared the predictive value of %FPSA and PSA density or their combination (PSAD + %FPSA) in cancer detection for patients with intermediate level of PSA with each reporting varying outcomes. Kochanska-Dziurowicz et al
| [9] | Kochañska-Dziurowicz AA, Mielniczuk MR, Stojko A, Kaletka J. The clinical utility of measuring free-to-total prostate-specific antigen (PSA) ratio and PSA density in differentiating between benign prostatic hyperplasia and prostate cancer. Br J Int. 1998; 81(6): 834–838. https://doi.org/10.1046/j.1464-410x.1998.00643.x |
[9]
in his study on the clinical utility of FPSA and PSAD, concluded that both parameters are the most specific variables for differentiating BPH from prostate cancer. However Chuan-Shu Chen
| [14] | Chen CS, Wang SS, Li JR, Cheng CL, Yang CR, Chen WM, et al. PSA density as a better predictor of prostate cancer than percent-free PSA in a repeat biopsy. J Chinese Med Assoc. 2011; 74(12): 552–555. |
[14]
and colleagues, 2011, in an attempt to identify the optimal predictive parameter for repeat biopsy in prostate cancer patients, reported PSAD density as being more predictive than %FPSA. On the other hand, another study by Cartsen Stephan
| [15] | Carsten S, Greta S, Marc H, Andre L, Andreas R, Michael L, et al. The Ratio of Prostate-Specific Antigen (PSA) to Prostate Volume (PSA Density) as a Parameter to Improve the Detection of Prostate Carcinoma in PSA Values in the Range of < 4 ng/mL. Am Cancer Soc. 2005; 104(5): 993–1003. |
[15]
concluded that PSAD density did not perform better than % FPSA in cancer detection for PSA in the intermediate range of 4-10ng/ml, however, it was more predictive than %FPSA for PSA < 4ng/ml. These studies, though conflicting, are to the best of my knowledge foreign and there are currently no local studies for now in our environment.
Prostate biopsy indications for those with PSA in the diagnostic grey zone and benign findings on DRE has remained a dilemma and one topic of debate.
| [16] | Amayo W, Obara A. Serum prostate specific antigen levels in men with benign prostatic hyperplasia and cancer of prostate. East African Medical Journal. 2004; 81(1): 22-26. https://doi.org/10.4314/eamj.v81i1.8790 |
[16]
The bone of contention being the lack of biochemical markers, including PSA, with a high sensitivity and specificity for cancer detection. Surgeons may be reluctant to do a prostate biopsy so as to avoid unnecessary biopsies. Thus cancers within this diagnostic grey zone (4-10 ng/ml) will be missed together with the attendant morbidity and mortality.
In prostate cancer detection programs in the developed economy, prostate biopsy is usually recommended for patients with normal DRE results and PSA levels higher than 4ng/ml.
| [17] | Cooner WH, Mosley BR, Rutherford CL, Beard JH, Pond HS, Terry WJ, et al. Prostate cancer detection in a clinical urological practice by ultrasonography, digital rectal examination and prostate specific antigen. J Urol. 1990; 143(6): 1146-1152. https://doi.org/10.1016/s0022-5347(17)40211-4 |
[17]
However, in developing countries like Nigeria, most centers embark on prostate biopsy mainly when the total serum PSA is > 10ng/ml.
| [18] | Ezenwa E, Tijani K, Jeje A, Ogunjimi A, Ojewola R. Prevalence Of Prostate Cancer Among Nigerians With Intermediate Total Prostate Specific Antigen Levels (4-10ng/ml): Experience At Lagos University Teaching Hospital, Nigeria. J internet Urol. 2012; 9(3): 1. |
[18]
This is in order to avoid unnecessary biopsies, with their attendant invasiveness, complications and cost. Those with PSA levels of 4ng/ml to 10ng/ml represent the diagnostic grey zone. In this grey zone, studies have shown that the total PSA alone, though sensitive, has low specificity for cancer detection. [12, 13, 19]
Overtime, the use of PSA variables such as PSA density and %FPSA amongst others have helped to reduce the incidence of unnecessary biopsy, as well as missed cancers in this diagnostic grey zone. Catalona et al in
| [12] | Catalona WJ, Partin AW, Slawin KM, Brawer MK, Flanigan RC, Patel A, et al. Use of the Percentage of Free Prostate-Specific Antigen to Enhance Differentiation of Prostate Cancer From Benign Prostatic Disease. JAMA. 1998; 279(19): 1542-1547. https://doi.org/10.1001/jama.279.19.1542 |
[12]
1998 showed that the incidence of cancer in this diagnostic grey zone was 25% of cases, while the remaining 75% of cases undergo unnecessary biopsies.
Furthermore, most patients with prostate cancer and a PSA level less than 10.0ng/ml have early stage disease and are potentially curable. Hence creating the need for a better marker to identify this small percentage of men, prevent unnecessary biopsies and allow for cancer detection in its potentially curable stage.
This study seeks to find out the predictive value of prostate specific antigen density and percentage free prostate specific antigen (%FPSA), as well as the combination (PSAD+%FPSA) in prostate cancer detection for Nigerians with prostate specific antigen level within the grey zone at the Jos university teaching hospital, Nigeria. This will help in identifying cancers within the diagnostic grey zone and prevent unnecessary biopsies with its attendant complications and cost.
It will corroborate the studies by Ezenwa et al, in Nigeria, on the prevalence and predictive value of %FPSA as well as that on Prostate specific antigen density by Udeh et al, Nigeria in Prostate cancer detection among Nigerian men with PSA in the grey zone.
Additionally it would give room to enable the urologist identify which of the parameters (PSAD, %FPSA or the combination of PSAD and %FPSA) is more predictive of prostate cancer in this diagnostic grey zone.
Furthermore the need for screening and identifying prostate cancer in the early stages where potentially curative therapy can be given, would be buttressed in my locality and in Nigeria.
2. Methodology
This study was carried out in the Urology division of a tertiary health centre in north central Nigeria. The subjects were patients presenting with complaints of lower urinary tract symptoms or those who were asymptomatic but presented for opportunistic screening and had intermediate PSA level of 4-10ng/ml.
2.1. Inclusion Criteria
All consenting patients with PSA in the diagnostic grey zone (4 to 10 ng/ml), irrespective of the symptoms and DRE findings.
2.2. Exclusion Criteria
1. Patients already on treatment for prostate cancer
2. Patients on 5 alpha reductase inhibitor for benign prostate enlargement.
3. Patients assessed to have UTI/acute prostatitis.
2.3. Sample Size Estimation
The sample size required to meet the set objectives at 95% confidence level was calculated from the formula below.91
Where:
n = the desired sample size
Z = the standard normal deviation corresponding to 95% level of confidence. The value obtained from the normal distribution is 1.96.
p = the proportion of patients with cancer of prostate that present at the urology clinic of JUTH, estimated at 11% (0.11).92 That is, 28 cases of prostate cancers out of 252 patients per year (2012-2014).
q = 1 – p=1-0.11=0.89
∂ = degree of accuracy desired is set at 10% (0.1)
The minimum sample size,
n = 37.6
Attrition rate of 10% = 3.7 = 4 patients
The minimum sample size was 42 patients.
2.4. Sampling Technique
Participants for the study were recruited consecutively. In this method, the pre-determined sample size was taken from men visiting the urology division of the health center and who met the inclusion criteria.
2.5. Data Collection
Patients with LUTS seen at the Urology clinic were recruited for the study. Data was obtained using a structured profoma. Each subject had a clinical evaluation involving relevant history, physical examination with digital examination of the prostate gland, followed by blood sampling for both total and free PSA. Urinalysis and urine m/c/s were also done. The blood samples for PSA were separated and refrigerated at -700C (within 2 hours of collection) until it was analysed in the laboratory. The serum sample for PSA was analyzed using an ELISA kit (TECO Inc, California, USA). The result was read using a microtitre-well reader. The percentage free PSA was obtained by finding the ratio between FPSA and total PSA and multiplying the result by 100, to get the percentage. A transabdominal ultrasound scan was done to determine the prostate volume using a curvilinear probe of 3.5MHz by the same radiologist to avoid inter observer error.
The PSA density was calculated by dividing the PSA by the prostate volume.
2.6. Prostate Biopsy Procedure
All patients had digitally guided transrectal prostate biopsy as day cases. Intravenous levofloxacin 500mg and metronidazole 500mg were administered 60 minutes before the procedure and continued orally for five days afterwards. Caudal block was used as a form of anaesthesia. The procedure was done with the patient in left lateral position using a high speed Gallini spring-loaded 18-G trucut needle and transrectal digital guidance. Twelve cores were taken from each patient; six cores from each lobe at the apex, middle and lower portions of the prostate. Three cores were initially taken on either side of the midline, then 3 more cores laterally in a systematic fashion. Prostate biopsy tissue specimen was stored in 10% buffered formalin and examined microscopically after haematoxylin-eosin staining.
Data was collated using a structured profoma. Data included the bio demographics, clinical details like LUTS, DRE findings, prostate volume, and serum total PSA, %FPSA, PSA density, indication for biopsy and histopathological report.
2.7. Data Analysis
The analysis was in 3 subsets; PSAD, %FPSA and the combination (PSAD+%FPSA). Results were analysed using SPSS version 20. Charts and tables were used to express the data. Measures of central tendency was determined to get the mean prostate volume, mean PSA value. The receiver operating characteristic (ROC) curve was used to determine the predictive power of PSAD, %FPSA, and the combination (PSAD+%FPSA) in prostate cancer detection. P value <0.05 was considered significant.
2.8. Level of Involvement of the Authors
The prostate biopsy as well as the data collation were done by the researchers with the help of the other trained members of the urology division. The researchers did 100% of the prostate biopsies.
2.9. Ethical Considerations
Ethical approval for the study was obtained from the tertiary health center research and ethics committee. Patients were counseled by the authors on the purpose and nature of the study and a written informed consent obtained from them willingly and freely (Appendix I). Only consenting patients were enrolled. Subjects were at liberty to opt out of the study at any stage without any consequence in terms of care or treatment.
2.10. Definition of Some Terms
A. Sensitivity.
This is the ability the measuring instrument has to identify correctly those who have the disease or condition. It is expressed as a percentage
=Persons with the disease who test positive / Total number of persons with the disease X100
=True positive/True positive + False Negative
B. Specificity.
This is the ability the measuring instrument has to identify correctly those who do not have the disease. Also expressed in percentage
=Persons without the disease (condition tested negative by screening test) /Total number of persons without the disease X 100
=True Negative/True Negative+ False positive
C. Positive predictive value.
The proportion of positive tests that identify diseased persons
=True positive/True positive + False positive
D. Negative predictive value.
The proportion of negative test which correctly identify non diseased persons
=True Negative/True Negative + false Negative
3. Results
3.1. Socio-demography of the Subjects
A total of 42 men who met the inclusion criteria and gave consent were recruited for the study during the period of January 2018 to March 2019. The age range of the subjects (
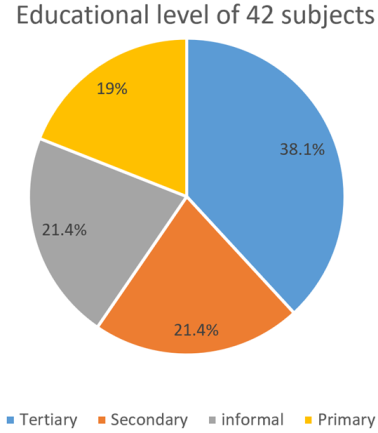
Table 1) was 50-90 years with a mean age of 67.93 ± 7.11 years. Majority of the subjects, 33 (78.6%) had some form of education (Primary, secondary and tertiary), while 9 (21.4%) had no formal education. Among those who had education, 16 (38%) had tertiary level of education, while secondary and primary education accounted for 9 (21.4%) and 8 (19%) respectively as in
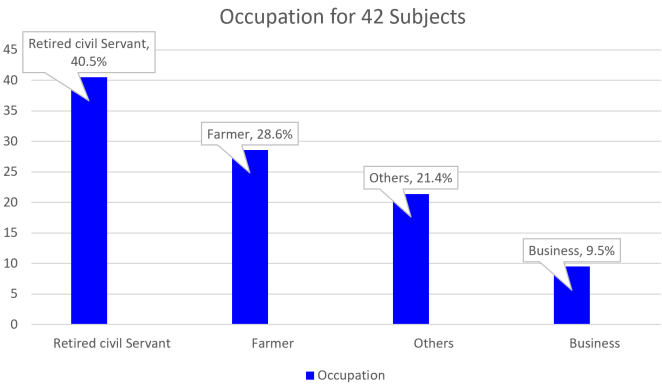
Figure 1. They were predominantly retired civil servants as in
Figure 2.
Table 1. Age distribution of 42 Subjects.
Age group | Frequency | Percentage |
50-60 | 5 | 11.9 |
61-70 | 21 | 50.0 |
>70 | 16 | 38.1 |
Total | 42 | 100.0 |
Figure 1. Educational levels of 42 Subjects.
Figure 2. Occupation of the 42 Subjects.
3.2. PSA Variables
The mean value for PSA in these subjects with grey zone PSA was 7.32 ± 1.73, with an average prostate volume of 73.68 ± 38.13. The mean values of the other PSA variables are as shown in
table 2.
Table 2. Mean and Standard deviation of continuous variables in 42 patients.
Variables | Mean ± SD |
Age | 67.93 ± 7.11 |
Prostate Volume | 73.68 ± 38.13 |
PSA | 7.32 ± 1.73 |
FPSA | 1.90 ± 1.58 |
PSA Density | 0.13 ± 0.10 |
%FPSA | 26.42 ± 24.47 |
Combination (PSAD+%FPSA) | 26.55 ± 24.45 |
PSA = Prostate Specific Antigen
PSAD = Prostate Specific Antigen Density
FPSA = Free Prostate specific antigen
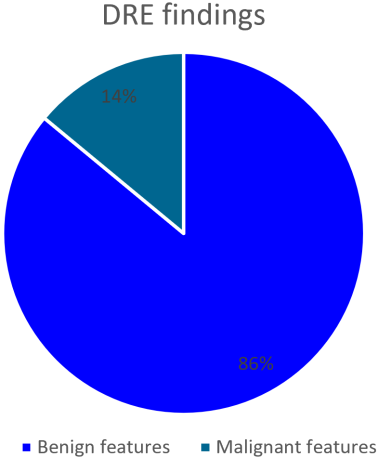
Digital rectal examination.
Thirty six (86%) had benign features on digital rectal examination, while 6 (14%) had malignant features on digital rectal examination as shown in
figure 3.
Figure 3. Distribution of Digital Rectal Examination (DRE) findings for 42 subjects.
3.3. Histological Diagnosis
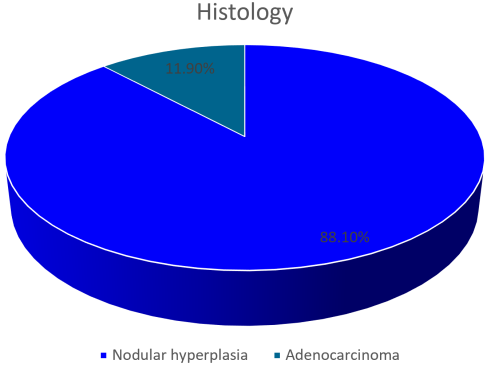
Majority of the subjects 37 (88.1%) had nodular hyperplasia on histology, while the remaining 5 (11.9%) had adenocarcinoma as shown in
figure 4. The mean age for those with adenocarcinoma was 69.40 ± 1.67 years
Figure 4. Histology of 42 subjects.
3.4. PSA Variables and Prostate Cancer
The correlation between prostate cancer and PSAD was 0.103 when compared to the correlation between %FPSA versus prostate cancer (r=0.119) and the combination versus prostate cancer (r=0.120) with p values of 0.517, 0.453 and 0.451 respectively.
Table 3.
Table 3. Correlation of prostate cancer against PSAD, %FPSA, combine (PSAD+%FPSA).
Variable | r | P |
PSAD Vs prostate cancer | 0.103 | 0.517 |
%FPSA Vs prostate cancer | 0.119 | 0.453 |
(PSAD+%FPSA) Vs prostate cancer | 0.120 | 0.451 |
3.5. Determining the Cut-off Values for the PSA Variables
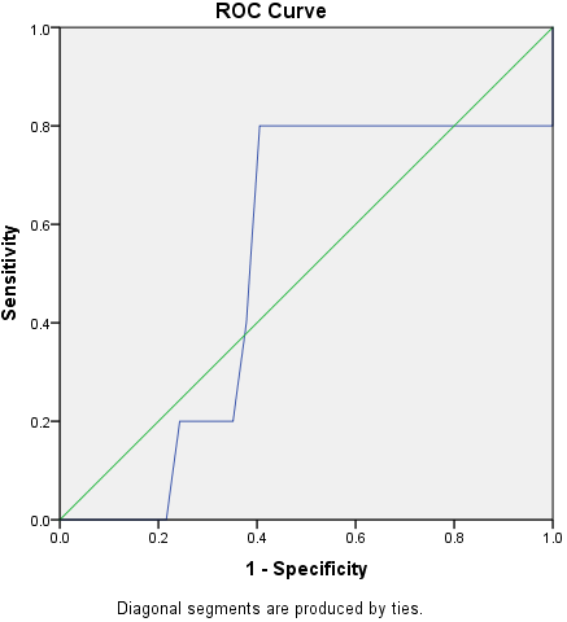
PSAD showed an area under the curve (AUC) of 0.524 (
Figure 5) with a sensitivity of 80% and specificity of 20% at a cut-off of 0.108 (
Table 4).
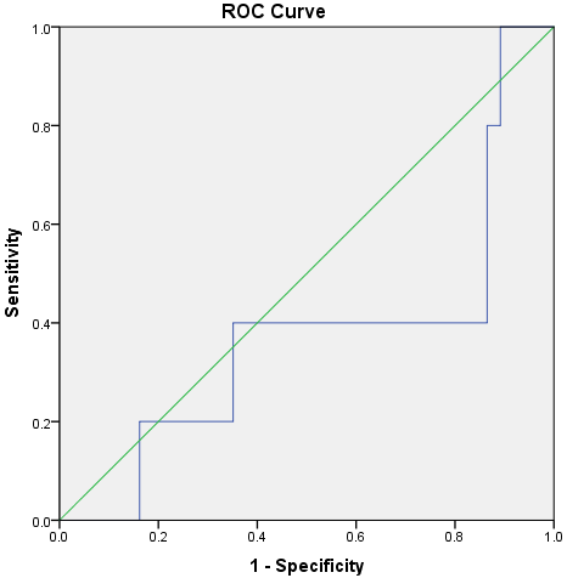
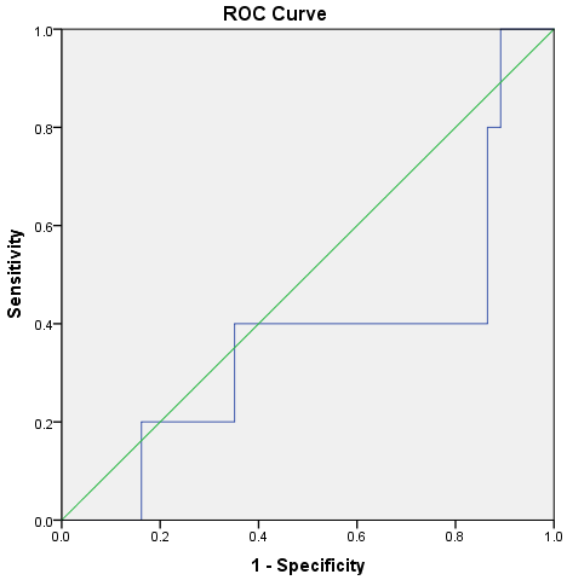
Figure 6 and
Figure 7 showed same AUC of 0.373 for both %FPSA and the combination (%FPSA+PSAD). The cut-off points were 29.40 (sensitivity: 40%, specificity: 60%) and 30.508 (sensitivity: 40%, specificity: 60%) for %FPSA and the combination (%FPSA +PSAD) respectively as shown in
Table 4.
Figure 5. ROC curve for PSAD and prostate cancer.
Figure 6. ROC curve for %FPSA and Prostate cancer.
Figure 7. ROC curve for the combination (PSAD+ %FPSA) and prostate cancer.
Table 4. Cut-off values of PSAD, %FPSA and the Combination (PSAD+%FPSA).
Variable | AUC | Cut-off Values | Specificity | Sensitivity | 1-Specificity |
PSA Density | 0.524 | 0.108 | 0.200(20%) | 0.800 (80%) | 0.405 |
%FPSA | 0.373 | 29.400 | 0.600(60%) | 0.400(40%) | 0.351 |
Combination | 0.373 | 30.508 | 0.600(60%) | 0.400(40%) | 0.351 |
AUC= Area under the curve, PSA= Prostate specific antigen
3.6. Cut-off Values of PSA Variables Versus Histopathological Report
At the cut-off value for PSAD of 0.108, four (21.1%) subjects were positive for Adenocarcinoma. For percentage FPSA, three (11.1%) were positive for adenocarcinoma at a cut-off value of 29.400. On the other hand one (7.1%) was positive for adenocarcinoma at a cut-off value of 30.508 for the combination (PSAD + %FPSA) as shown in
Tables 5, 6 and 7 respectively.
Table 5. Two-by-two table of PSAD with histopathology report.
Histopathology | PSAD: | Positive | Negative | Total |
Nodular hyperplasia | Count | 15 | 22 | 37 |
Percentage | 78.9 | 95.7 | 88.1 |
Adenocarcinoma | Count | 4 | 1 | 5 |
Percentage | 21.1 | 4.3 | 11.9 |
Total | Count | 19 | 23 | 42 |
Percentage | 100 | 100 | 100 |
Table 6. Two-by-two table of %FPSA with histopathology report.
Histopathology | %FPSA: | Positive | Negative | Total |
Nodular hyperplasia | Count | 24 | 13 | 37 |
Percentage | 88.9 | 86.7 | 88.1 |
Adenocarcinoma | Count | 3 | 2 | 5 |
Percentage | 11.1 | 13.3 | 11.9 |
Total | Count | 27 | 15 | 42 |
Percentage | 100 | 100 | 100 |
Table 7. Two-by-two table of the combination with histopathology report.
Histopathology | Combination: | Positive | Negative | Total |
Nodular hyperplasia | Count | 13 | 24 | 37 |
Percentage | 92.9 | 85.7 | 88.1 |
Adenocarcinoma | Count | 1 | 4 | 5 |
Percentage | 7.1 | 14.3 | 11.9 |
Total | Count | 14 | 28 | 42 |
Percentage | 100 | 100 | 100 |
3.7. Limitation of the Study
Digitally guided transrectal biopsy was used in this study, whereas the standard is a transrectal ultrasound guided prostate biopsy. This may have led to some missed diagnoses.
4. Discussion
This study demonstrated the predictive ability of PSA density, percentage free PSA (%FPSA) and the combination (PSAD+%FPSA) in prostate cancer detection and its impact on reducing the number of unnecessary prostate biopsies as well as the attendant complications and costs, while not compromising cancer detection.
In this study, forty-two (42) patients with LUTS and PSA levels of 4-10 ng/ml were studied. Most of the patients presented in the seventh decade of life with mean age of 67.4 years. Out of these, five (12%) were diagnosed to have prostate cancer on biopsy. The mean age of those with cancer was 69.4 years. This is similar to reports from various studies which recorded the seventh decade of life as the mean age of diagnosis. Ezenwa et al
| [18] | Ezenwa E, Tijani K, Jeje A, Ogunjimi A, Ojewola R. Prevalence Of Prostate Cancer Among Nigerians With Intermediate Total Prostate Specific Antigen Levels (4-10ng/ml): Experience At Lagos University Teaching Hospital, Nigeria. J internet Urol. 2012; 9(3): 1. |
[18]
reported the 7
th decade of life as the age range for the diagnosis of prostate cancer in Nigeria. Similarly Osegbe
4 and Udeh et al
| [10] | Udeh EI, Nnabugwu II, Ozoemena FO, Ugwumba FO, Aderibigbe ASO, Ohayi SR, et al. Prostate-specific antigen density values among patients with symptomatic prostatic enlargement in Nigeria. world J surg oncol. 2016; 14: 174. https://doi.org/10.1186/s12957-016-0921-6 |
[10]
reported 68.3 and 65.57 as the mean age for prostate cancer respectively.
The prevalence of prostate cancer for men with PSA in the grey zone in this study was 12%. This is similar to another study done among blacks in Nigeria by Ezenwa et al
| [18] | Ezenwa E, Tijani K, Jeje A, Ogunjimi A, Ojewola R. Prevalence Of Prostate Cancer Among Nigerians With Intermediate Total Prostate Specific Antigen Levels (4-10ng/ml): Experience At Lagos University Teaching Hospital, Nigeria. J internet Urol. 2012; 9(3): 1. |
[18]
who found a prevalence of 13.3% for prostate cancer with PSA in the intermediate level. The lower prevalence rate in these studies, compared to others is probably attributable to the missed diagnoses of prostate cancer since digital guided prostate biopsy were done and not TRUS biopsy.
| [18] | Ezenwa E, Tijani K, Jeje A, Ogunjimi A, Ojewola R. Prevalence Of Prostate Cancer Among Nigerians With Intermediate Total Prostate Specific Antigen Levels (4-10ng/ml): Experience At Lagos University Teaching Hospital, Nigeria. J internet Urol. 2012; 9(3): 1. |
[18]
Other studies which utilized TRUS biopsy, reported a higher prevalence. Catalona et al
| [12] | Catalona WJ, Partin AW, Slawin KM, Brawer MK, Flanigan RC, Patel A, et al. Use of the Percentage of Free Prostate-Specific Antigen to Enhance Differentiation of Prostate Cancer From Benign Prostatic Disease. JAMA. 1998; 279(19): 1542-1547. https://doi.org/10.1001/jama.279.19.1542 |
[12]
reported a prevalence of 25% for prostate cancer in men with the grey zone PSA level.
In the analysis of PSAD, the mean value was 0.13ng/ml2, with a cut-off value for prostate adenocarcinoma as 0.108 ng/ml2 (sensitivity of 80% and specificity of 20%). Hence at values above 0.108ng/ml2, the likelihood of a prostate adenocarcinoma is high.
Universally, most scholars use a PSAD cut-off level of 0.15ng/ml to differentiate prostate cancer from benign prostate enlargement. This value of 0.15ng/ml was obtained from western studies.
| [30] | Heidenreich A, Bastian PJ, Bellmunt J, Bolla M, Joniau S, van der Kwast T, et al. EAU guidelines on prostate cancer. part 1: screening, diagnosis, and local treatment with curative intent-update 2013. Eur Urol. 2014; 65(1): 124–137. https://doi.org/10.1016/j.eururo.2013.09.046 |
| [31] | Hodge KK, McNeal JE, Terris MK, Stamey TA. Random systematic versus directed ultrasound guided transrectal core biopsies of the prostate. J Urol. 1989; 142: 71-74. https://doi.org/10.1016/s0022-5347(17)38664-0 |
[30, 31]
However studies among blacks have reported different figures. This has been adduced to the larger prostate size in blacks compared to those in Caucasians.
| [10] | Udeh EI, Nnabugwu II, Ozoemena FO, Ugwumba FO, Aderibigbe ASO, Ohayi SR, et al. Prostate-specific antigen density values among patients with symptomatic prostatic enlargement in Nigeria. world J surg oncol. 2016; 14: 174. https://doi.org/10.1186/s12957-016-0921-6 |
[10]
As such, PSAD estimation will be lower for our population. Therefore, in order to get a higher sensitivity and specificity for prostate cancer detection, a lower cut-off may be used. This was proven in this study, which revealed a cut-off value of 0.108 (P < 0.861) with a high sensitivity (80%) and specificity (20%). This is comparable to many studies which revealed higher values of sensitivity and specificity at a lower cut-off value. Udeh et al
| [10] | Udeh EI, Nnabugwu II, Ozoemena FO, Ugwumba FO, Aderibigbe ASO, Ohayi SR, et al. Prostate-specific antigen density values among patients with symptomatic prostatic enlargement in Nigeria. world J surg oncol. 2016; 14: 174. https://doi.org/10.1186/s12957-016-0921-6 |
[10]
reported the sensitivity and specificity of 95.88% and 28.7% respectively using a cut-off value of 0.04 and concluded that PSAD is useful for prostate cancer detection when this lower cut-off is used for Nigerian men. Catalona et al,
| [32] | Catalona WJ, Southwick PC, Slawin KM, Partin AW, Brawer MK, Flanigan RC, et al. Comparison of percent free PSA, PSA density, and age-specific PSA cutoffs for prostate cancer detection and staging. Urology. 2000; 56(2): 255–260. https://doi.org/10.1016/S0090-4295(00)00637-3 |
[32]
in a multicenter study with 773 men, suggested that the PSAD value be lowered to 0.078ng/ml/ml, a value at which 95% of the tumors would be detected.
On the other hand, in this study, the mean %FPSA was 26.42 with a cut-off value for prostate adenocarcinoma of 29.4% (sensitivity 40% and specificity of 60%). As with total PSA, the %FPSA varies widely for different studies and there is no absolute cut-off ratio that reliably distinguishes BPH from prostate cancer. Any cancer detection test should have a high specificity and sensitivity.
| [10] | Udeh EI, Nnabugwu II, Ozoemena FO, Ugwumba FO, Aderibigbe ASO, Ohayi SR, et al. Prostate-specific antigen density values among patients with symptomatic prostatic enlargement in Nigeria. world J surg oncol. 2016; 14: 174. https://doi.org/10.1186/s12957-016-0921-6 |
[10]
The higher the cut-off value for the %FPSA, the greater the sensitivity (fewer cancers are missed) and the lower the value, the greater the specificity (greater number of true negatives).
There is, therefore, the need to find a convenient trade-off between sensitivity and specificity. Fowler et al
| [22] | Fowler JE Jr, Sanders J, Bigler SA, Rigdon J, Kilambi NK, Land SA. Percent free prostate specific antigen and cancer detection in black and white men with total prostate specific antigen 2.5 to 9.9 ng./ml. J Urol. 2000; 163(5): 1467-1470. |
[22]
in their study among blacks and white men observed some variations and reported that at 95% sensitivity, the optimum %FPSA was 35.2% in blacks and 29.2%% in white men. This finding is similar to that of Ezenwa et al
| [13] | Ezenwa E V., Tijani KH, Jeje EA, Soriyan OO, Ogunjimi MA, Ojewola RW, et al. The value of percentage free prostate specific antigen (PSA) in the detection of prostate cancer among patients with intermediate levels of total PSA (4.0-10.0 ng/mL) in Nigeria. Arab J Urol. 2012; 10(4): 394–401. https://doi.org/10.1016/j.aju.2012.05.004 |
[13]
working among black men in Nigeria. He demonstrated that a cut-off of < 40% is the optimum %FPSA which had an acceptable sensitivity of 100% and specificity of 93.4%. In this study the %FPSA cut-off value was < 29.4%, but with low sensitivity and specificity compared to the above studies. This low sensitivity and specificity may be attributable to the small sample size, when compared to the other studies.
Furthermore, the need to avoid unnecessary biopsies has led some investigators to reduce the cut-off points for %FPSA in order to increase the specificity, while reducing the sensitivity. Yilmaz et al
| [21] | Yilmaz H, Ciftci S, Yavuz U, Ustuner M, Saribacak A, Dillioglugil O. Percentage of free prostate-specific antigen (PSA) is a useful method in deciding to perform prostate biopsy with higher core numbers in patients with low PSA cut-off values. Kaohsiung J Med Sci. 2015; 31(6): 315–319. https://doi.org/10.1016/j.kjms.2015.02.006 |
[21]
at a %FPSA cut-off point of < 25% had a sensitivity of 29% and specificity of 83.5%, while at a lower cut-off of %FPSA of 10%, the sensitivity was 21.7% and specificity was higher at 91.7%. Also Lee et al
| [23] | Lee R, Localio AR, Armstrong K, Malkowicz SB, Schwartz JS. A meta-analysis of the performance characteristics of the free prostate-specific antigen test. Urology. 2006; 67(4): 762–768. https://doi.org/10.1016/J.UROLOGY.2005.10.052 |
[23]
using similar criteria defined a 25% sensitivity and 85% specificity at a cut-off point of 10% when total PSA was between 4ng/ml to 10ng/ml. In another study Auprich et al
| [24] | Auprich M, Augustin H, Budäus L, Kluth L, Mannweiler S, Shariat SF, et al. A comparative performance analysis of total prostate-specific antigen, percentage free prostate-specific antigen, prostate-specific antigen velocity and urinary prostate cancer gene 3 in the first, second and third repeat prostate biopsy. BJUI. 2012; 109(11): 1627–1635. https://doi.org/10.1111/j.1464-410X.2011.10584.x |
[24]
reported a 65.1% specificity with a %FPSA cut-off point of 15%. These findings support the need for approaches to increase specificity without decreasing sensitivity of the test. The index study, however, showed a cut-off value of 29.4% with low specificity and sensitivity, suggesting the fact that %FPSA may not be very useful in detecting prostate adenocarcinoma in the grey zone. On the other hand, some variation of %FPSA cut-off points in different studies have been shown to be related to the differences in study design, sampling technique and assay manufacturers.
Furthermore, the place of combining PSAD+%FPSA was analyzed in this study. The mean combination value was 26.42 with a cut-off value of 30.508 at a sensitivity of 40% and specificity of 60%. Studies which used a combination of both the %FPSA and PSAD in order to predict cancer in the diagnostic grey zone are difficult to come by in the literatures. However Gregorio et al
| [29] | Gregorio EP, Grando JP, Saqueti EE, Almeida SH, Moreira HA, Rodrigues MA. Comparison between PSA density, free PSA percentage and PSA density in the transition zone in the detection of prostate cancer in patients with serum PSA between 4 and 10 ng/ml. Int. Braz J Urol. 2007; 33(2): 151-160. https://doi.org/10.1590/s1677-55382007000200004 |
[29]
studied the predictive value of the isolated parameters when compared to the isolated total PSA. He alluded that a combination of these parameters (PSAD of the transition zone, % FPSA, Transition zone volume and age) may promote a high accuracy of prostate cancer detection.
Furthermore, in this study, to determine the predictive ability of PSAD, %FPSA and the combination (PSAD+%FPSA), the ROC curves for each parameter was plotted. The area under the curves show 0.524 for PSAD, 0.373 for %FPSA and 0.373 for the combination (PSAD+%FPSA). PSAD was the highest of the three parameters and the ROC curve is more to the left suggesting that it is the most predictive of the three parameters, with a cut-off value of 0.108 ng/ml2, though not statistically significant (P< 0.861).
Additionally when the various cut-off values were cross tabulated using a two-by-two table, with the histopathological report of adenocarcinoma, the PSAD showed the highest positive predictive value of 21.1% at the cut-off value of 0.108ng/ml2, compared to 11.1% for %FPSA at a cut-off value of 29.40% and 7.1% for the combination (PSAD + %FPSA) at a cut-off value of 30.508.
These findings from the study agree with other reports in the literature which showed that PSAD was more predictive of prostate cancer in patients with intermediate level PSA (4-10ng/ml).
| [25] | Sasaki R, Habuchi T, Sato K, Akao T, Kakinuma H, Zhang LQ, et al. The clinical utility of measuring total PSA, PSA density, gamma-seminoprotein and gamma-seminoprotein/total PSA in prostate cancer prediction. Jpn J Clin Oncol. 2000; 30(8): 337–342. |
| [26] | Zheng XY, Xie LP, Wang YY, Ding W, Yang K, Shen HF et al. The use of prostate specific antigen (PSA) Density in detecting prostate cancer in chinese men with PSA levels of 4-10ng/ml. J Cancer Res Clin Oncol.2008; 134(11): 1207-1210. https://doi.org/10.1007/s00432-008-0400-8 |
| [29] | Gregorio EP, Grando JP, Saqueti EE, Almeida SH, Moreira HA, Rodrigues MA. Comparison between PSA density, free PSA percentage and PSA density in the transition zone in the detection of prostate cancer in patients with serum PSA between 4 and 10 ng/ml. Int. Braz J Urol. 2007; 33(2): 151-160. https://doi.org/10.1590/s1677-55382007000200004 |
| [33] | Bazinet M, Meshref AW, Trudel C, Aronson S, Péloquin F, Nachabe M, et al. Prospective evaluation of prostate-specific antigen density and systematic biopsies for early detection of prosttic carcinoma. Urology. 1994; 44(1): 150-151. https://doi.org/10.1016/S0090-4295(94)80260-2 |
| [34] | Allan RW, Sanderson H, Epstein JI. Correlation of minute (0.5 mm or less) focus of prostate adenocarcinoma on needle biopsy with radical prostatectomy specimen: Role of prostate specific antigen density. J Urol. 2003; 170(2 Pt 1): 370-372. |
[25, 26, 29, 33, 34]
On the other hand, some studies have reported variability in the predictive power of PSAD and %FPSA in men with PSA within the diagnostic grey zone (4ng/ml-10ng/ml). Sasaki et al
| [25] | Sasaki R, Habuchi T, Sato K, Akao T, Kakinuma H, Zhang LQ, et al. The clinical utility of measuring total PSA, PSA density, gamma-seminoprotein and gamma-seminoprotein/total PSA in prostate cancer prediction. Jpn J Clin Oncol. 2000; 30(8): 337–342. |
[25]
suggested that %FPSA does not provide additional information for the diagnosis and staging of prostate cancer when total PSA and PSAD are available. Zheng et al
| [26] | Zheng XY, Xie LP, Wang YY, Ding W, Yang K, Shen HF et al. The use of prostate specific antigen (PSA) Density in detecting prostate cancer in chinese men with PSA levels of 4-10ng/ml. J Cancer Res Clin Oncol.2008; 134(11): 1207-1210. https://doi.org/10.1007/s00432-008-0400-8 |
[26]
analyzed 237 cases within the grey zone of 4ng/ml to 10 ng/ml and reported that PSAD was a good predictor of prostate cancer at sensitivity and specificity of 90% and 33.7% respectively and a cut-off point of 0.13ng/ml
2. However Aslan et al,
| [27] | Aslan G, Irer B, Kefi A, Çelebi I, Yörükoǧlu K, Esen A. The value of PSA, free-to-total PSA ratio and PSA density in the prediction of pathologic stage for clinically localized prostate cancer. Int Urol Nephrol. 2005; 37(3): 511–514. https://doi.org/10.1007/s11255-005-0921-x |
[27]
found that %FPSA was a good predictor for the detection and staging of prostate cancer with a PPV of 56% when cut-off value was 15%. Similarly another study concluded that PSAD did not perform better than %FPSA when the total PSA was in the range of 4ng/ml to 10ng/ml, but was more useful when total PSA is less than 4ng/ml.
| [28] | Carsten S, Greta S, Marc H, Andre L, Andreas R, Michael L, et al. The Ratio of Prostate-Specific Antigen (PSA) to Prostate Volume (PSA Density) as a Parameter to Improve the Detection of Prostate Carcinoma in PSA Values in the Range of < 4 ng/mL. Am cancer Soc. 2005; 104(5): 993–1003. |
[28]
4.1. Conclusion
The most predictive parameter for prostate cancer in the grey zone is the PSAD from this study at a cut-off level of 0.108ng/ml2, sensitivity of 80% and specificity of 20%. It showed an improved positive predictive value which will have an impact on reducing the number of unnecessary biopsies with their attendant complications, while not compromising cancer detection when used compared to the other parameters (%FPSA, and the combination).
4.2. Recommendations
PSA density is the most predictive of the three parameters (PSAD, %FPSA and the combination) and may be useful in the assessment of men with LUTS and PSA within the grey area (4-10ng/ml).
A reduced cut-off for the PSAD should be considered for native African men because Africans have a comparatively larger prostate size compared to Caucasians.
| [10] | Udeh EI, Nnabugwu II, Ozoemena FO, Ugwumba FO, Aderibigbe ASO, Ohayi SR, et al. Prostate-specific antigen density values among patients with symptomatic prostatic enlargement in Nigeria. world J surg oncol. 2016; 14: 174. https://doi.org/10.1186/s12957-016-0921-6 |
[10]
.
Abbreviations
AJCC | American Joint Committee on Cancer |
BPH | Benign Prostatic Hyperplasia |
CaP | Cancer of the Prostate |
DNA | Deoxyribonuclueic Acid |
DRE | Digital Rectal Examination |
FPSA | Free Prostate Specific Antigen |
GWAS | Genome-wide Association Studies |
LUTS | Lower Urinary Tract Symptoms |
PIN | Prostatic Intraepithelial Neoplasia |
PPV | Positive Predictive Value |
PSA | Prostate Specific Antigen |
PSAD | PSA Density |
ROC | Receiver Operating Characteristic Curve |
TNM | Tumour Node Metastasis |
TRUS | Transrectal Ultrasound |
Data Declaration
All proforma, data and materials for the study are in the archive of the tertiary heaIth centre.
Author Contributions
Magnus Felix E: Conceptualization, Data curation, Funding acquisition, Investigation, Methodology, Project administration, Resources, Visualization, Writing – original draft, Writing – review & editing
Obiatuegwu Kenenna: Conceptualization, Data curation, Formal Analysis, Funding acquisition, Investigation, Supervision, Validation, Writing – original draft, Writing – review & editing
Atim Terkaa: Supervision, Writing – review & editing
Otabor Christopher: Formal Analysis, Software
Dakum Nuhu: Project administration, Supervision, Validation, Writing – review & editing
Funding
This study was sponsored and funded by the authors only.
Conflicts of Interest
The authors declare no conflicts of interest.
Appendix
Figure 8. Ethical clearance approval letter.
References
| [1] |
Yeboah E. The prostate gland. In: Badoe E, Archampong E, da Rocha-Afodu J. (editors). Principles and Practice of Surgery including Pathology in the tropics. 4th ed. Accra: Ghana publishing co-operation.; 2009. p. 917–952.
|
| [2] |
Jonathan I. Pathology of prostatic Neoplasia. In: Louis RK, Alan WP, Andrew CN, Craig AP.(editors). campbell-walsh urology. 10th ed. philadelphia: WB saunders CO; 2012. p. 2726–2734.
|
| [3] |
Brawley OW. Trends in prostate cancer in the United States. J Natl Cancer Inst - Monogr. 2012; (45): 152–156.
https://doi.org/10.1007/s00345-012-0824-2
|
| [4] |
Osegbe DN. Prostate cancer in Nigerians: Facts and nonfacts. J Urol. 1997; 157(4): 1340–1343.
https://doi.org/10.1016/s0022-5347(01)63068-4
|
| [5] |
Eke N, Sapira MK. Prostate Cancer in Port Harcourt Nigeria Features and Outcomes. Nig J Surg Res. 2002; 4(1): 34–44.
https://doi.org/10.4314/njsr.v4i1.12167
|
| [6] |
Oranusi CK, Mbieri UT, Oranusi IO, Nwofor AME. Prostate cancer awareness and screening among male public servants in Anambra state, Nigeria. African J Urol. 2012; 18(2): 72–74.
https://doi.org/10.1016/J.AFJU.2012.04.016
|
| [7] |
Carvalhal GF, Smith DS, Mager DE, Ramos C, Catalona WJ. Digital rectal examination for detecting prostate cancer at prostate specific antigen levels of 4 ng./ml. or less. J Urol. 1999; 161(3): 835–839.
https://doi.org/10.1016/S0022-5347(01)61785-3
.
|
| [8] |
Börgermann C, Kliner S, Swoboda A, Luboldt H-J, Rübben H. Parameters to improve the specificity of the prostate-specific antigen : Early detection of prostate cancer. Urologe. 2001; 50(9): 1095-10100.
https://doi.org/10.1007/s00120-011-2577-8
.
|
| [9] |
Kochañska-Dziurowicz AA, Mielniczuk MR, Stojko A, Kaletka J. The clinical utility of measuring free-to-total prostate-specific antigen (PSA) ratio and PSA density in differentiating between benign prostatic hyperplasia and prostate cancer. Br J Int. 1998; 81(6): 834–838.
https://doi.org/10.1046/j.1464-410x.1998.00643.x
|
| [10] |
Udeh EI, Nnabugwu II, Ozoemena FO, Ugwumba FO, Aderibigbe ASO, Ohayi SR, et al. Prostate-specific antigen density values among patients with symptomatic prostatic enlargement in Nigeria. world J surg oncol. 2016; 14: 174.
https://doi.org/10.1186/s12957-016-0921-6
|
| [11] |
Benson MC, Whang IS, Pantuck A, Ring K, Kaplan SA, Olsson CA, et al. Prostate specific antigen density: a means of distinguishing benign prostatic hypertrophy and prostate cancer. J Urol. 1992; 147(3 Pt 2): 815–816.
https://doi.org/10.1016/s0022-5347(17)37393-7
|
| [12] |
Catalona WJ, Partin AW, Slawin KM, Brawer MK, Flanigan RC, Patel A, et al. Use of the Percentage of Free Prostate-Specific Antigen to Enhance Differentiation of Prostate Cancer From Benign Prostatic Disease. JAMA. 1998; 279(19): 1542-1547.
https://doi.org/10.1001/jama.279.19.1542
|
| [13] |
Ezenwa E V., Tijani KH, Jeje EA, Soriyan OO, Ogunjimi MA, Ojewola RW, et al. The value of percentage free prostate specific antigen (PSA) in the detection of prostate cancer among patients with intermediate levels of total PSA (4.0-10.0 ng/mL) in Nigeria. Arab J Urol. 2012; 10(4): 394–401.
https://doi.org/10.1016/j.aju.2012.05.004
|
| [14] |
Chen CS, Wang SS, Li JR, Cheng CL, Yang CR, Chen WM, et al. PSA density as a better predictor of prostate cancer than percent-free PSA in a repeat biopsy. J Chinese Med Assoc. 2011; 74(12): 552–555.
|
| [15] |
Carsten S, Greta S, Marc H, Andre L, Andreas R, Michael L, et al. The Ratio of Prostate-Specific Antigen (PSA) to Prostate Volume (PSA Density) as a Parameter to Improve the Detection of Prostate Carcinoma in PSA Values in the Range of < 4 ng/mL. Am Cancer Soc. 2005; 104(5): 993–1003.
|
| [16] |
Amayo W, Obara A. Serum prostate specific antigen levels in men with benign prostatic hyperplasia and cancer of prostate. East African Medical Journal. 2004; 81(1): 22-26.
https://doi.org/10.4314/eamj.v81i1.8790
|
| [17] |
Cooner WH, Mosley BR, Rutherford CL, Beard JH, Pond HS, Terry WJ, et al. Prostate cancer detection in a clinical urological practice by ultrasonography, digital rectal examination and prostate specific antigen. J Urol. 1990; 143(6): 1146-1152.
https://doi.org/10.1016/s0022-5347(17)40211-4
|
| [18] |
Ezenwa E, Tijani K, Jeje A, Ogunjimi A, Ojewola R. Prevalence Of Prostate Cancer Among Nigerians With Intermediate Total Prostate Specific Antigen Levels (4-10ng/ml): Experience At Lagos University Teaching Hospital, Nigeria. J internet Urol. 2012; 9(3): 1.
|
| [19] |
Miele ME. Percent free PSA as an additional measure in a prostate cancer screen. Clin Lab Sci. 2001; 14(2): 102–107.
|
| [20] |
Stephen L. Can Percent Free Prostate-Specific Antigen Reduce the Need for Prostate Biopsy? [Internet]. Effective clinical practice. 1999 [cited 2016 Aug 20]. Available from:
http://ecp.acponline.org/novdec99/lieberman.htm
|
| [21] |
Yilmaz H, Ciftci S, Yavuz U, Ustuner M, Saribacak A, Dillioglugil O. Percentage of free prostate-specific antigen (PSA) is a useful method in deciding to perform prostate biopsy with higher core numbers in patients with low PSA cut-off values. Kaohsiung J Med Sci. 2015; 31(6): 315–319.
https://doi.org/10.1016/j.kjms.2015.02.006
|
| [22] |
Fowler JE Jr, Sanders J, Bigler SA, Rigdon J, Kilambi NK, Land SA. Percent free prostate specific antigen and cancer detection in black and white men with total prostate specific antigen 2.5 to 9.9 ng./ml. J Urol. 2000; 163(5): 1467-1470.
|
| [23] |
Lee R, Localio AR, Armstrong K, Malkowicz SB, Schwartz JS. A meta-analysis of the performance characteristics of the free prostate-specific antigen test. Urology. 2006; 67(4): 762–768.
https://doi.org/10.1016/J.UROLOGY.2005.10.052
|
| [24] |
Auprich M, Augustin H, Budäus L, Kluth L, Mannweiler S, Shariat SF, et al. A comparative performance analysis of total prostate-specific antigen, percentage free prostate-specific antigen, prostate-specific antigen velocity and urinary prostate cancer gene 3 in the first, second and third repeat prostate biopsy. BJUI. 2012; 109(11): 1627–1635.
https://doi.org/10.1111/j.1464-410X.2011.10584.x
|
| [25] |
Sasaki R, Habuchi T, Sato K, Akao T, Kakinuma H, Zhang LQ, et al. The clinical utility of measuring total PSA, PSA density, gamma-seminoprotein and gamma-seminoprotein/total PSA in prostate cancer prediction. Jpn J Clin Oncol. 2000; 30(8): 337–342.
|
| [26] |
Zheng XY, Xie LP, Wang YY, Ding W, Yang K, Shen HF et al. The use of prostate specific antigen (PSA) Density in detecting prostate cancer in chinese men with PSA levels of 4-10ng/ml. J Cancer Res Clin Oncol.2008; 134(11): 1207-1210.
https://doi.org/10.1007/s00432-008-0400-8
|
| [27] |
Aslan G, Irer B, Kefi A, Çelebi I, Yörükoǧlu K, Esen A. The value of PSA, free-to-total PSA ratio and PSA density in the prediction of pathologic stage for clinically localized prostate cancer. Int Urol Nephrol. 2005; 37(3): 511–514.
https://doi.org/10.1007/s11255-005-0921-x
|
| [28] |
Carsten S, Greta S, Marc H, Andre L, Andreas R, Michael L, et al. The Ratio of Prostate-Specific Antigen (PSA) to Prostate Volume (PSA Density) as a Parameter to Improve the Detection of Prostate Carcinoma in PSA Values in the Range of < 4 ng/mL. Am cancer Soc. 2005; 104(5): 993–1003.
|
| [29] |
Gregorio EP, Grando JP, Saqueti EE, Almeida SH, Moreira HA, Rodrigues MA. Comparison between PSA density, free PSA percentage and PSA density in the transition zone in the detection of prostate cancer in patients with serum PSA between 4 and 10 ng/ml. Int. Braz J Urol. 2007; 33(2): 151-160.
https://doi.org/10.1590/s1677-55382007000200004
|
| [30] |
Heidenreich A, Bastian PJ, Bellmunt J, Bolla M, Joniau S, van der Kwast T, et al. EAU guidelines on prostate cancer. part 1: screening, diagnosis, and local treatment with curative intent-update 2013. Eur Urol. 2014; 65(1): 124–137.
https://doi.org/10.1016/j.eururo.2013.09.046
|
| [31] |
Hodge KK, McNeal JE, Terris MK, Stamey TA. Random systematic versus directed ultrasound guided transrectal core biopsies of the prostate. J Urol. 1989; 142: 71-74.
https://doi.org/10.1016/s0022-5347(17)38664-0
|
| [32] |
Catalona WJ, Southwick PC, Slawin KM, Partin AW, Brawer MK, Flanigan RC, et al. Comparison of percent free PSA, PSA density, and age-specific PSA cutoffs for prostate cancer detection and staging. Urology. 2000; 56(2): 255–260.
https://doi.org/10.1016/S0090-4295(00)00637-3
|
| [33] |
Bazinet M, Meshref AW, Trudel C, Aronson S, Péloquin F, Nachabe M, et al. Prospective evaluation of prostate-specific antigen density and systematic biopsies for early detection of prosttic carcinoma. Urology. 1994; 44(1): 150-151.
https://doi.org/10.1016/S0090-4295(94)80260-2
|
| [34] |
Allan RW, Sanderson H, Epstein JI. Correlation of minute (0.5 mm or less) focus of prostate adenocarcinoma on needle biopsy with radical prostatectomy specimen: Role of prostate specific antigen density. J Urol. 2003; 170(2 Pt 1): 370-372.
|
Cite This Article
-
APA Style
E, M. F., Kenenna, O., Terkaa, A., Christopher, O., Nuhu, D., et al. (2025). The Predictive Value of Prostate Specific Antigen Density, Percentage Free Prostate Specific Antigen and the Combination for Prostate Cancer Detection in Grey Zone. International Journal of Clinical Urology, 9(1), 36-48. https://doi.org/10.11648/j.ijcu.20250901.17
 Copy
|
Copy
|
 Download
ACS Style
E, M. F.; Kenenna, O.; Terkaa, A.; Christopher, O.; Nuhu, D., et al. The Predictive Value of Prostate Specific Antigen Density, Percentage Free Prostate Specific Antigen and the Combination for Prostate Cancer Detection in Grey Zone. Int. J. Clin. Urol. 2025, 9(1), 36-48. doi: 10.11648/j.ijcu.20250901.17
Copy
|
Download
AMA Style
E MF, Kenenna O, Terkaa A, Christopher O, Nuhu D, et al. The Predictive Value of Prostate Specific Antigen Density, Percentage Free Prostate Specific Antigen and the Combination for Prostate Cancer Detection in Grey Zone. Int J Clin Urol. 2025;9(1):36-48. doi: 10.11648/j.ijcu.20250901.17
Copy
|
Download
-
@article{10.11648/j.ijcu.20250901.17,
  author = {Magnus Felix E and Obiatuegwu Kenenna and Atim Terkaa and Otabor Christopher and Dakum Nuhu and Ramyil Venyir},
  title = {The Predictive Value of Prostate Specific Antigen Density, Percentage Free Prostate Specific Antigen and the Combination for Prostate Cancer Detection in Grey Zone},
  journal = {International Journal of Clinical Urology},
  volume = {9},
  number = {1},
  pages = {36-48},
  doi = {10.11648/j.ijcu.20250901.17},
  url = {https://doi.org/10.11648/j.ijcu.20250901.17},
  eprint = {https://article.sciencepublishinggroup.com/pdf/10.11648.j.ijcu.20250901.17},
  abstract = {Introduction: Prostate cancer is a common malignancy affecting men beyond the middle age. In advanced countries, the life time risk of developing microscopic prostate cancer in men is 30%. However, it is slow-growing and the risk of developing clinical disease is 16%, while the lifetime risk is 3%. It is not common in those below 50 years, but after this age there is a steady increase in its incidence. The objective of this study was to determine the predictive value of prostate specific antigen density (PSAD), percentage free Prostate specific antigen and the combination (PSAD+%FPSA) for cancer detection in the grey zone at a tertiary health center in north central Nigeria. Methodology: A prospective study which was carried out over one year and three months. Each subject had a clinical evaluation involving relevant history, physical examination with digital rectal examination of the prostate gland, followed by blood sampling for both total and free PSA. These samples for PSA were sent to the chemical pathology laboratory. The percentage free PSA was calculated by finding the ratio between free PSA and total PSA and multiplying the result by 100. Also, a transabdominal ultrasound scan was done to determine the prostate volume. The PSA density was calculated by dividing the PSA by the total prostate volume. All patients had digitally guided transrectal prostate biopsy. The analysis were in 3 subsets; PSAD, %FPSA and the combination (PSAD+%FPSA). Results were analysed using SPSS version 20. P value Results: Forty two men with mean age of 67.93 ± 7.11years who had PSA in the grey zone were recruited. Only 5(12%) had diagnosis of prostate adenocarcinoma. Mean age of those with adenocarcinoma was 69.40 ± 1.67years. There was no statistically significant correlation between prostate adenocarcinoma and the variables; PSAD, %FPSA and the combination (PSAD+%FPSA), with P values of 0.517, 0.453 and 0.451 respectively. However when the ROC curve was drawn, the AUC was highest for PSAD at 0.524 with a cut-off value of 0.108ng/ml2. While the AUC and cut-off was 0.373, 29.40 and 0.373, 30.50 for %FPSA and the combination (PSAD+%FPSA) respectively. Additionally, using a two-by-two table, the positive predictive value for adenocarcinoma was 21.1% for PSAD, compared to 11.9% for %FPSA and 7.1% for the combination. Conclusion: The study showed that PSAD was the most predictive of the 3 parameters. A PSAD cut-off value of 0.108 (sensitivity of 80% and specificity of 20%) is suggestive of prostate adenocarcinoma in patients with PSA in the grey zone.},
 year = {2025}
}
Copy
|
Download
-
TY  - JOUR
T1  - The Predictive Value of Prostate Specific Antigen Density, Percentage Free Prostate Specific Antigen and the Combination for Prostate Cancer Detection in Grey Zone
AU  - Magnus Felix E
AU  - Obiatuegwu Kenenna
AU  - Atim Terkaa
AU  - Otabor Christopher
AU  - Dakum Nuhu
AU  - Ramyil Venyir
Y1  - 2025/02/26
PY  - 2025
N1  - https://doi.org/10.11648/j.ijcu.20250901.17
DO  - 10.11648/j.ijcu.20250901.17
T2  - International Journal of Clinical Urology
JF  - International Journal of Clinical Urology
JO  - International Journal of Clinical Urology
SP  - 36
EP  - 48
PB  - Science Publishing Group
SN  - 2640-1355
UR  - https://doi.org/10.11648/j.ijcu.20250901.17
AB  - Introduction: Prostate cancer is a common malignancy affecting men beyond the middle age. In advanced countries, the life time risk of developing microscopic prostate cancer in men is 30%. However, it is slow-growing and the risk of developing clinical disease is 16%, while the lifetime risk is 3%. It is not common in those below 50 years, but after this age there is a steady increase in its incidence. The objective of this study was to determine the predictive value of prostate specific antigen density (PSAD), percentage free Prostate specific antigen and the combination (PSAD+%FPSA) for cancer detection in the grey zone at a tertiary health center in north central Nigeria. Methodology: A prospective study which was carried out over one year and three months. Each subject had a clinical evaluation involving relevant history, physical examination with digital rectal examination of the prostate gland, followed by blood sampling for both total and free PSA. These samples for PSA were sent to the chemical pathology laboratory. The percentage free PSA was calculated by finding the ratio between free PSA and total PSA and multiplying the result by 100. Also, a transabdominal ultrasound scan was done to determine the prostate volume. The PSA density was calculated by dividing the PSA by the total prostate volume. All patients had digitally guided transrectal prostate biopsy. The analysis were in 3 subsets; PSAD, %FPSA and the combination (PSAD+%FPSA). Results were analysed using SPSS version 20. P value Results: Forty two men with mean age of 67.93 ± 7.11years who had PSA in the grey zone were recruited. Only 5(12%) had diagnosis of prostate adenocarcinoma. Mean age of those with adenocarcinoma was 69.40 ± 1.67years. There was no statistically significant correlation between prostate adenocarcinoma and the variables; PSAD, %FPSA and the combination (PSAD+%FPSA), with P values of 0.517, 0.453 and 0.451 respectively. However when the ROC curve was drawn, the AUC was highest for PSAD at 0.524 with a cut-off value of 0.108ng/ml2. While the AUC and cut-off was 0.373, 29.40 and 0.373, 30.50 for %FPSA and the combination (PSAD+%FPSA) respectively. Additionally, using a two-by-two table, the positive predictive value for adenocarcinoma was 21.1% for PSAD, compared to 11.9% for %FPSA and 7.1% for the combination. Conclusion: The study showed that PSAD was the most predictive of the 3 parameters. A PSAD cut-off value of 0.108 (sensitivity of 80% and specificity of 20%) is suggestive of prostate adenocarcinoma in patients with PSA in the grey zone.
VL  - 9
IS  - 1
ER  -
Copy
|
Download