This study investigates optimal hedging ratios for Islamic and conventional stock markets during the COVID-19 pandemic using the DCC (Dynamic Conditional Correlation), ADCC (Asymmetric Dynamic Conditional Correlation), and GO-GARCH (Generalized Orthogonal GARCH) models. The effectiveness of various financial assets as hedges is evaluated, and findings indicate that the DJCOM (Dow Jones Commodity), VISTOXX (Euro STOXX 50 Volatility Index), and VIX (Chicago Board Options Exchange Volatility Index) indices exhibit superior effectiveness across both market types, particularly DJCOM showing exceptional performance during the COVID-19 period. The hedging analysis indicates that the hedge ratios vary and depend upon the hedge instrument included in the portfolio. Furthermore, the empirical results indicate that the global impact of the pandemic diminishes the viability of one of the six assets as a safe haven instrument. In conclusion, these findings provide valuable insights for investors and portfolio managers aiming to utilize Gold, Brent, VISTOXX, VIX, CDS (Credit Default Swap), and DJCOM for portfolio rebalancing to mitigate risks associated with volatile Islamic and conventional stock returns. These conclusions contribute significantly to helping investors adjust their investment strategies more effectively and adapt to changing market conditions.
| Published in | International Journal of Economic Behavior and Organization (Volume 12, Issue 1) |
| DOI | 10.11648/j.ijebo.20241201.11 |
| Page(s) | 1-24 |
| Creative Commons |
This is an Open Access article, distributed under the terms of the Creative Commons Attribution 4.0 International License (http://creativecommons.org/licenses/by/4.0/), which permits unrestricted use, distribution and reproduction in any medium or format, provided the original work is properly cited. |
| Copyright |
Copyright © The Author(s), 2024. Published by Science Publishing Group |
COVID-19, Islamic and Conventional Stock Markets, ADCC and GO-GARCH Models, Rolling Estimation Procedure, Hedging Effectiveness
Authors (Year) | Timespan | Objective | Methodology | Finding Results |
|---|---|---|---|---|
[8] | 1999 - 2020 | Examine the reaction of the US stock to the COVID-19 pandemic | Approach to quantify | The influence of the COVID-19 pandemic on the US stock market is unprecedented, and is comparable with the previous infectious disease outbreak, the Spanish Flu. |
[1] | 1979 - 2009 | Examine to evaluate the COVID-19 pandemic effect on the Chinese stock market | Panel data | The daily increase in confirmed cases and the total number of deaths caused by COVID-19 have a significant negative impact on the stock returns of all companies. |
[26] | 2019 - 2020 | Examines the impact of the COVID-19 pandemic and related deaths on the US stock market | GARCH | The reported number of deaths in Italy and France has a negative impact on US stock market returns, but has a positive effect on the VIX returns. |
[27] | 01/2020 - 04/2020 | Investigate the direct and indirect impact of the COVID-19 pandemic on implied stock market volatility across Europe, Asia, the US, and Australia | Panel data | Their results show that Google-based anxiety about the contagious effects of COVID-19 would lead to increased risk aversion in the stock market. |
[29] | 01/2020 - 03/2020 | Examine the connectedness between the COVID-19 pandemic, oil price volatility shock, the stock market, geopolitical risk, and economic policy uncertainty in the US | Wavelet-based Granger causality tests | The unprecedented impact of the COVID-19 pandemic on these elements leads to the development of low-frequency bands, and the impact of the COVID-19 pandemic on the geopolitical risk is substantially greater than on the US economic uncertainty. |
[24] | 1995 - 2020 | Examines the relative significance of COVID-19 infections and oil price news in influencing oil prices. | Panel data | They concluded that when oil prices are used as the threshold, news about the COVID-19 pandemic and negative oil price will affect oil prices under high volatility |
[35] | 2006 - 2020 | Examine the return and volatility spillover between the COVID-19 pandemic in 2020, the crude oil market, and the stock market | Time-domain approach | The impact of COVID-19 on The results show that the oil and stock markets exceeds that of the 2008 financial crisis. The crude oil and stock markets changed pattern before and after COVID-19 was announced. companies and oil is 0.20. |
[18] | 2019 - 2020 | Examine the direct effects and spill-overs of COVID-19 on stock markets | Panel data | The COVID-19 pandemic has negative impacts on stock market returns in the short term. |
[3] | 01/2020 - 04/2020 | Examines the stock markets’ response to the COVID-19 pandemic. | Panel data | Empirical results that the stock market returns continue to decline as the number of confirmed cases increase. |
[22] | 2019 - 2020 | Investigate the stock market oscillations during the corona crash | Autoregressive model | The autocorrelation of the S&P 500 index returns increased in magnitude and remained negative in periods of extreme market volatility and when attention to the COVID-19 increased. |
[16] | 03/2020 - 04/2020 | Examine the impacts of COVID-19 on the spillovers between US and Chinese stock sectors. | Copula functions | The risk spillover is higher from the US to China before COVID-19 and from China to the US during COVD-19 spread, which is significantly intensified between March 2020 and April 2020 |
[34] | 02/2020 - 23/2020 | Examine the impact of global pandemic of COVID-19 on financial markets | Correlation analysis | The global financial market risks have increased substantially in response to the pandemic. Individual stock market reactions are clearly linked to the severity of the outbreak in each country |
[9] | Examine the effect of news shocks related to local epidemic conditions and information diffusion through Twitter | Panel data | Empirical results that a large market price of contagion risk. | |
[28] | 2016 - 2020 | Examine the role of gold as a safe haven or hedge against crude oil price risks | VARMA-GARCH | The gold is found to exhibit a significant safe haven against oil price risks. The optimal portfolio and hedging ratios support this evidence. |
[23] | 2018 - 20200 | Examine the impacts of COVID-19 on the multifractality of gold and oil prices based on upward and downward trends | A-MF-DFA | Gold and oil markets have been inefficient, particularly during the outbreak. The efficiency of gold and oil markets is sensitive to scales, market trends, and to the pandemic outbreak, highlighting the investor sentiment effect. |
[31] | 03/2020 - 04/2020 | Investigate the impact of COVID-19 on emerging stock markets | Panel data | The negative impact has gradually fallen and begun to taper off by mid-April. The highest impact is in Asian and the lowest in European emerging markets |
[5] | 01/2020 - 04/2020 | Examine the effects of COVID-19 on the U.S. stock market volatility at the industry level. | Markov Switching (MS) regime AR | Changes in the volatility are found to be more sensitive to COVID-19 news than economic indicators. while changes in systematic risk vary across industry |
[33] | 01/2020 - 04/2020 | Examine if government response to COVID-19 mitigates international stock market volatility | CAPM | significant increase in stock market volatility in countries where governments take rigorous actions to curb the spread of COVID-19, such as information campaigns and cancellation of public events |
[17] | 01/2020 - 04/2020 | Investigate whether COVID-19 news coverage leads to shifts in volatility | GARCH | The majority of industries they examined did not exhibit significant shifts in volatility as a result of media coverage and news sentiment |
3.1. Dynamic Conditional Correlation Model
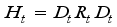 (1)
(1)  is a
is a  conditional covariance matrix,
  is the conditional correlation matrix, and
  is a diagonal matrix with time-varying standard deviations on the diagonal.
  (2)
(2)  (3)
(3)  can be defined as a univariate GARCH model, as follows:
  (4)
(4)  is the conditional covariance matrix.
  (5)
(5)  is the
  unconditional correlation matrix of the standardized residuals
  . The parameters
  and
and  are scalar parameters to capture the effects of previous shocks and previous dynamic conditional correlations on the current dynamic conditional correlation. These parameters are non-negative.
  < 1. The correlation estimator is given as follows:
  (6)
(6) 3.2. Asymmetric Dynamic Conditional Correlation Model
 (7)
(7)  is equal to one if
  < 0 and 0 otherwise. For this specification, a positive value for d means that negative residuals tend to increase the variance more than positive ones. The asymmetric effect or “leverage effect” is designed to capture an often observed characteristic of financial assets that an unexpected drop in asset prices tends to increase volatility more than an unexpected increase in asset prices of the same magnitude. This can be interpreted to mean that bad news increases volatility more than good news.
  (8)
(8)  and are zero-threshold standardized errors which are equal to
  when less than zero and zero otherwise.
  and
and  are the unconditional matrices of
  and
and  , respectively.
 3.3. Go-GARCH Model
 (9)
(9)  denotes a set of unobserved independent factors
  . A is an invertible and time-invariant n x n and can be decomposed into an unconditional covariance matrix Σ and an orthogonal matrix U.
  (10)
(10)  (11)
(11)  and
and  . is a diagonal matrix with elements , ,…, being the conditional variances of the factors. The factor conditional variance can be modeled using the GARCH process (i=1, 2,…,n). Furthermore, the unconditional distribution of the factors satisfies
  and
and  . It follows that the returns can be expressed as:
  (12)
(12)  is:
is:  (13)
(13) 4.1. Data
 , where
  is the closing price index and
  is the level of return in percentage on day t. Such transformation permit to make data stationary.
 4.2. Preliminary Statistics
Index | EMRG | DJIEMG | GOLD | Brent | VISTOXX | VIX | CDSEU | DJCOM |
|---|---|---|---|---|---|---|---|---|
Observations | 3325 | 3325 | 3325 | 3325 | 3325 | 3325 | 3325 | 3325 |
min | -9.002713 | -9.165188 | -9.811288 | -64.36989 | -43.43765 | -35.05885 | -71.44897 | -8.466831 |
Max | 9.457768 | 10.799563 | 8.588524 | 41.20225 | 47.06665 | 76.82450 | 70.71890 | 6.465763 |
Q1 | -0.532325 | -0.489329 | -0.475257 | -1.04343 | -3.91658 | -4.10659 | -1.13978 | -0.505258 |
Q3 | 0.604016 | 0.594403 | 0.564616 | 1.06612 | 3.12116 | 3.29005 | 1.04426 | 0.001855 |
mean | -0.000812 | 0.006543 | 0.024475 | -0.02531 | 0.01304 | 0.01027 | 0.00922 | 0.544344 |
Median | 0.054883 | 0.053588 | 0.007002 | 0.00000 | -0.31299 | -0.35921 | -0.04274 | 0.000000 |
St. Dev. | 1.21168 | 1.20007 | 1.13785 | 2.864475 | 6.722422 | 7.59118 | 5.496346 | 1.097497 |
Skewness | -0.631321 | -0.5115845 | -0.2117925 | -2.583544 | 0.709325 | 1.09971 | -0.09354688 | -0.4977709 |
kurtosis | 9.139432 | 9.610997 | 6.346226 | 101.2491 | 4.090621 | 6.581375 | 34.88968 | 5.411888 |
JB Test | 11812 | 12963 | 5614.5 | 1425706 | 2602.2 | 6682.2 | 168871 | 4202.7 |
KPSS Test | 0.07122 | 0.15241 | 0.1271 | 0.05027 | 0.016769 | 0.021951 | 0.27613 | 0.065877 |
Q(12) | 175.93 | 158.33 | 30.0050 | 176.8 | 35.01 | 49.662 | 361.68 | 26.752 |
Q²(12) | 4687.5 | 3609 | 558.18 | 925.83 | 470.44 | 285.76 | 984.05 | 1466 |
EMRG | DJIEMG | GOLD | Brent | VISTOXX | VIX | CDSEU | DJCOM | |
|---|---|---|---|---|---|---|---|---|
EMRG | 1,0000 | 0,9641 | 0,1297 | 0,3316 | -0,5085 | -0,3975 | -0,1735 | 0,4991 |
DJIEM | 0,9641 | 1,0000 | 0,1349 | 0,3208 | -0,4850 | -0,3742 | -0,1675 | 0,4768 |
GOLD | 0,1297 | 0,1349 | 1,0000 | 0,1574 | 0,0030 | 0,0119 | -0,0037 | 0,3952 |
Brent | 0,3316 | 0,3208 | 0,1574 | 1,0000 | -0,2423 | -0,1939 | -0,0875 | 0,5925 |
VISTOXX | -0,5085 | -0,4850 | 0,0030 | -0,2423 | 1,0000 | 0,5437 | 0,1472 | -0,3294 |
VIX | -0,3975 | -0,3742 | 0,0119 | -0,1939 | 0,5437 | 1,0000 | 0,0760 | -0,3088 |
CDSEU | -0,1735 | -0,1675 | -0,0037 | -0,0875 | 0,1472 | 0,0760 | 1,0000 | -0,1107 |
DJCOM | 0,4991 | 0,4768 | 0,3952 | 0,5925 | -0,3294 | -0,3088 | -0,1107 | 1,0000 |
EMRG | DJIEMG | GOLD | Brent | VISTOXX | VIX | CDSEU | DJCOM | |
|---|---|---|---|---|---|---|---|---|
EMRG | 1,00000 | 0,93683 | 0,23279 | 0,08600 | 0,25563 | 0,20702 | 0,03998 | 0,45266 |
DJIEM | 0,93683 | 1,00000 | 0,21065 | 0,07593 | 0,23011 | 0,17783 | 0,02963 | 0,40574 |
GOLD | 0,23279 | 0,21065 | 1,00000 | 0,04859 | 0,06968 | 0,13239 | 0,01192 | 0,29272 |
Brent | 0,08600 | 0,07593 | 0,04859 | 1,00000 | 0,06088 | 0,02279 | 0,00487 | 0,45868 |
VISTOXX | 0,25563 | 0,23011 | 0,06968 | 0,06088 | 1,00000 | 0,33273 | 0,02446 | 0,19139 |
VIX | 0,20702 | 0,17783 | 0,13239 | 0,02279 | 0,33273 | 1,00000 | 0,05131 | 0,12444 |
CDSEU | 0,03998 | 0,02963 | 0,01192 | 0,00487 | 0,02446 | 0,05131 | 1,00000 | 0,00759 |
DJCOM | 0,45266 | 0,40574 | 0,29272 | 0,45868 | 0,19139 | 0,12444 | 0,00759 | 1,00000 |
4.3. Specifications of the Multivariate GARCH Models
ModelParameters | AR DCC MVT | AR ADCC MVT | ||||||
|---|---|---|---|---|---|---|---|---|
[EMRG].mu | 0.048445 | 0.016871 | 2.87142 | 0.004086 | 0.013129 | 0.017488 | 0.75078 | 0.452785 |
[EMRG].ar1 | 0.192489 | 0.016902 | 11.38831 | 0 | 0.202301 | 0.016382 | 12.34877 | 0 |
[EMRG].omega | 0.012677 | 0.004038 | 3.13973 | 0.001691 | 0.013923 | 0.005896 | 2.36157 | 0.018198 |
[EMRG].alpha1 | 0.086566 | 0.013534 | 6.39593 | 0 | 0.06763 | 0.018585 | 3.63901 | 0.000274 |
[EMRG].beta1 | 0.903837 | 0.014397 | 62.77859 | 0 | 0.933397 | 0.019578 | 47.67578 | 0 |
[EMRG].eta11 | 0.759509 | 0.12365 | 6.14241 | 0 | ||||
[EMRG].shape | 8.596386 | 1.165556 | 7.37535 | 0 | 10.268792 | 1.616223 | 6.35357 | 0 |
[DJIEMG].mu | 0.054954 | 0.016373 | 3.35628 | 0.00079 | 0.022377 | 0.019413 | 1.15265 | 0.249055 |
[DJIEMG].ar1 | 0.182782 | 0.017021 | 10.73856 | 0 | 0.192733 | 0.019448 | 9.91014 | 0 |
[DJIEMG].omega | 0.01198 | 0.003712 | 3.22727 | 0.00125 | 0.014915 | 0.005311 | 2.80836 | 0.00498 |
[DJIEMG].alpha1 | 0.086087 | 0.012938 | 6.65371 | 0 | 0.077198 | 0.015605 | 4.94703 | 0.000001 |
[DJIEMG].beta1 | 0.905374 | 0.013355 | 67.79041 | 0 | 0.925401 | 0.016259 | 56.91636 | 0 |
[DJIEMG].eta11 | 0.674315 | 0.088121 | 7.65211 | 0 | ||||
[DJIEMG].shape | 7.660236 | 0.952307 | 8.04387 | 0 | 8.746924 | 1.243623 | 7.03342 | 0 |
[Gold].mu | 0.038627 | 0.013266 | 2.91176 | 0.003594 | 0.041031 | 0.014416 | 2.8463 | 0.004423 |
[Gold].ar1 | -0.033837 | 0.014426 | -2.3456 | 0.018997 | -0.035387 | 0.013526 | -2.6162 | 0.008891 |
[Gold].omega | 0.004985 | 0.001795 | 2.77641 | 0.005496 | 0.005898 | 0.001975 | 2.98705 | 0.002817 |
[Gold].alpha1 | 0.035426 | 0.002905 | 12.19453 | 0 | 0.051996 | 0.003287 | 15.82105 | 0 |
[Gold].beta1 | 0.963346 | 0.000509 | 1892.87488 | 0 | 0.958689 | 0.000399 | 2405.15399 | 0 |
[Gold].eta11 | -0.163236 | 0.09512 | -1.71611 | 0.086142 | ||||
[Gold].shape | 3.978882 | 0.283165 | 14.05147 | 0 | 3.968481 | 0.27861 | 14.24385 | 0 |
[brent].mu | 0.030326 | 0.027266 | 1.11222 | 0.266042 | 0.006544 | 0.025507 | 0.25656 | 0.797516 |
[brent].ar1 | 0.014392 | 0.016324 | 0.88162 | 0.377985 | 0.01535 | 0.015496 | 0.99056 | 0.321901 |
[brent].omega | 0.046606 | 0.014304 | 3.25816 | 0.001121 | 0.01835 | 0.005797 | 3.16524 | 0.00155 |
[brent].alpha1 | 0.086077 | 0.010185 | 8.45171 | 0 | 0.066044 | 0.009655 | 6.84023 | 0 |
[brent].beta1 | 0.910413 | 0.00963 | 94.53619 | 0 | 0.942755 | 0.008546 | 110.31571 | 0 |
[brent].eta11 | 0.534944 | 0.093381 | 5.7286 | 0 | ||||
[brent].shape | 5.028454 | 0.464343 | 10.82918 | 0 | 5.569366 | 0.569939 | 9.77187 | 0 |
[VISTOXX].mu | -0.370061 | 0.092188 | -4.0142 | 0.00006 | -0.233841 | 0.094043 | -2.48654 | 0.012899 |
[VISTOXX].ar1 | -0.013765 | 0.017532 | -0.78514 | 0.432369 | -0.003403 | 0.017896 | -0.19018 | 0.849172 |
[VISTOXX].omega | 3.49017 | 1.092188 | 3.19558 | 0.001396 | 0.299425 | 0.078114 | 3.83317 | 0.000127 |
[VISTOXX].alpha1 | 0.109208 | 0.021902 | 4.98621 | 0.000001 | 0.07268 | 0.012207 | 5.95401 | 0 |
[VISTOXX].beta1 | 0.822107 | 0.039275 | 20.93233 | 0 | 0.89933 | 0.018775 | 47.9016 | 0 |
[VISTOXX].eta11 | -0.999997 | 0.194851 | -5.13211 | 0 | ||||
[VISTOXX].shape | 4.418959 | 0.333477 | 13.25118 | 0 | 4.642665 | 0.356682 | 13.01626 | 0 |
[VIX].mu | -0.42083 | 0.092353 | -4.55674 | 0.000005 | -0.244628 | 0.09754 | -2.50797 | 0.012143 |
[VIX].ar1 | -0.073668 | 0.017065 | -4.317 | 0.000016 | -0.072438 | 0.017361 | -4.17257 | 0.00003 |
[VIX].omega | 7.119345 | 1.353151 | 5.26131 | 0 | 0.494089 | 0.093281 | 5.29678 | 0 |
[VIX].alpha1 | 0.176969 | 0.02886 | 6.13198 | 0 | 0.106796 | 0.012436 | 8.58737 | 0 |
[VIX].beta1 | 0.718084 | 0.038646 | 18.58084 | 0 | 0.852163 | 0.019242 | 44.28732 | 0 |
[VIX].eta11 | -0.999999 | 0.128811 | -7.7633 | 0 | ||||
[VIX].shape | 4.034258 | 0.297853 | 13.54445 | 0 | 4.380689 | 0.351934 | 12.44746 | 0 |
[CDS.Europe].mu | -0.111316 | 0.028215 | -3.9453 | 0.00008 | -0.108217 | 0.028017 | -3.86261 | 0.000112 |
[CDS.Europe].ar1 | 0.013576 | 0.014986 | 0.90594 | 0.36497 | 0.017239 | 0.012927 | 1.33363 | 0.182324 |
[CDS.Europe].omega | 1.55403 | 0.585659 | 2.65347 | 0.007967 | 0.553858 | 0.160519 | 3.45041 | 0.00056 |
[CDS.Europe].alpha1 | 0.293871 | 0.07317 | 4.01627 | 0.000059 | 0.557251 | 0.124117 | 4.48973 | 0.000007 |
[CDS.Europe].beta1 | 0.705129 | 0.104753 | 6.73134 | 0 | 0.760249 | 0.052292 | 14.5384 | 0 |
[CDS.Europe].eta11 | -0.166651 | 0.076833 | -2.16901 | 0.030082 | ||||
[CDS.Europe].shape | 2.395906 | 0.080181 | 29.88139 | 0 | 2.1 | 0.000471 | 4459.08495 | 0 |
[DJCommodity].mu | 0.013809 | 0.013283 | 1.03962 | 0.298518 | 0.00827 | 0.014135 | 0.58503 | 0.558525 |
[DJCommodity].ar1 | -0.004118 | 0.017281 | -0.23831 | 0.81164 | -0.003423 | 0.022074 | -0.15509 | 0.876754 |
[DJCommodity].omega | 0.005734 | 0.002493 | 2.29975 | 0.021462 | 0.004267 | 0.001544 | 2.76376 | 0.005714 |
[DJCommodity].alpha1 | 0.058619 | 0.012184 | 4.81111 | 0.000002 | 0.056574 | 0.003026 | 18.69414 | 0 |
[DJCommodity].beta1 | 0.937775 | 0.01271 | 73.78257 | 0 | 0.953399 | 0.001258 | 757.92517 | 0 |
[DJCommodity].eta11 | 0.339999 | 0.072835 | 4.66807 | 0.000003 | ||||
[DJCommodity].shape | 6.476929 | 0.694829 | 9.32161 | 0 | 6.476799 | 0.671969 | 9.63854 | 0 |
[Joint]dcca1 | 0.014222 | 0.001788 | 7.95414 | 0 | 0.013506 | 0.001546 | 8.7378 | 0 |
[Joint]dccb1 | 0.973011 | 0.004817 | 201.98061 | 0 | 0.971798 | 0.004523 | 214.86176 | 0 |
[Joint]dccg1 | 0.001439 | 0.000827 | 1.73938 | 0.081968 | ||||
[Joint]mshape | 5.991387 | 0.186795 | 32.07468 | 0 | 5.715703 | 0.171173 | 33.39138 | 0 |
 (14)
(14) 
 .
.  (15)
(15)  is the conditional covariance between asset
  and
and  at time t, and
  is the conditional variance of asset
  at time t. It is to be noted that a long position in one dollar in asset
  can be hedged by a short position in
  dollars of asset
  .
.  (16)
(16)  is the variance of unhedged assets and
  represents the variance of portfolio. This method compares the variance of the hedged portfolio to that of an un-hedged portfolio. The three GARCH models are compared on the basis of the hedge ratios produced from each model which states that the higher the hedge ratio is, the higher the hedging effectiveness of the mode.
 5.1. Impact of COVID-19 on Hedging Strategy
EMRG | Period | Gold | Brent | VISTOXX | VIX | CDSEU | DJCOM |
|---|---|---|---|---|---|---|---|
DCC/ADCC | Before COVID | 0.9997 | 0.9957 | 0.9999 | 0.9980 | 0.9994 | 0.9993 |
During COVID | 0.9990 | 0.9988 | 1 | 0.9998 | 1 | 0.9998 | |
DCC/GOGARCH | Before COVID | 0.4399 | -0.3972 | 0.7858 | -0.4746 | 0.7574 | 0.5733 |
During COVID | 0.3153 | -0.3092 | 0.9196 | -0.5482 | 0.4271 | 0.9005 | |
ADCC/GOGARCH | Before COVID | 0.4380 | -0.4307 | 0.7863 | -0.4720 | 0.7584 | 0.5667 |
During COVID | 0.2798 | -0.3186 | 0.9196 | -0.5490 | 0.4271 | 0.9029 | |
DJIEM | Period | Gold | Brent | VISTOXX | VIX | CDSEU | DJCOM |
DCC/ADCC | Before COVID | 0.9991 | 0.9954 | 0.9999 | 0.9967 | 1 | 0.9989 |
During COVID | 0.9965 | 0.9984 | 1 | 0.9999 | 1 | 0.9998 | |
DCC/GOGARCH | Before COVID | 0.4359 | -0.3049 | -0.5048 | -0.5225 | 0.7614 | -0.2355 |
During COVID | 0.5275 | -0.2172 | -0.5358 | -0.5421 | 0.4792 | 0.30496 | |
ADCC/GOGARCH | Before COVID | 0.4151 | -0.3417 | -0.5056 | -0.5377 | 0.7614 | -0.2603 |
During COVID | 0.4731 | -0.2330 | -0.5358 | -0.5377 | 0.4792 | 0.3107 |
EMRG | Period | Gold | Brent | VISTOXX | VIX | CDSEU | DJCOM |
|---|---|---|---|---|---|---|---|
DCC/ADCC | Before COVID | 0.9997 | 0.9961 | 0.9993 | 0.9798 | 0.9994 | 0.9988 |
During COVID | 0.9995 | 0.9979 | 1 | 0.9946 | 1 | 0.9994 | |
DCC/GOGARCH | Before COVID | 0.6072 | 0.3270 | 0.1291 | 0.0415 | 0.6745 | 0.7255 |
During COVID | 0.5881 | 0.2102 | 0.4998 | 0.5431 | 0.2600 | 0.1653 | |
ADCC/GOGARCH | Before COVID | 0.6084 | 0.3752 | 0.1196 | 0.0653 | 0.6750 | 0.7170 |
During COVID | 0.5756 | 0.2239 | 0.4998 | 0.5714 | 0.2600 | 0.1831 | |
DJIEM | Period | Gold | Brent | VISTOXX | VIX | CDSEU | DJCOM |
DCC/ADCC | Before COVID | 0.9994 | 0.9963 | 0.9995 | 0.9911 | 1 | 0.9987 |
During COVID | 0.9984 | 0.9985 | 1 | 0.9992 | 1 | 0.9997 | |
DCC/GOGARCH | Before COVID | 0.6183 | 0.4451 | 0.1084 | -0.2003 | 0.5442 | 0.5092 |
During COVID | 0.6084 | 0.3162 | 0.4117 | 0.4115 | 0.3645 | 0.7108 | |
ADCC/GOGARCH | Before COVID | 0.6105 | 0.4620 | 0.0981 | -0.1774 | 0.5442 | 0.4877 |
During COVID | 0.5911 | 0.3319 | 0.4117 | 0.4191 | 0.3645 | 0.7126 |
Period | Refit=20 | Refit=40 | Refit=60 | ||||||||||
|---|---|---|---|---|---|---|---|---|---|---|---|---|---|
mean | min | max | HE | mean | min | max | HE | mean | min | max | HE | ||
EMERG /Gold | |||||||||||||
DCC | After | 0.1253935 | -0.5575603 | 0.9237533 | 0.04954837 | 0.1253201 | -0.5410122 | 0.9237533 | 0.04923517 | 0.1253824 | -0.5410122 | 0.922848 | 0.04908256 |
During | 0.05656799 | -0.4956466 | 0.5395996 | 0.03272476 | 0.05707719 | -0.4956466 | 0.5453409 | 0.03264153 | 0.05837086 | -0.4956466 | 0.5453409 | 0.03250792 | |
ADCC | After | 0.1273156 | -0.5506768 | 0.9292186 | 0.05037021 | 0.1270794 | -0.5330709 | 0.9292186 | 0.04997689 | 0.1271566 | -0.5330709 | 0.9231039 | 0.04982197 |
During | 0.06389841 | -0.4834687 | 0.5745333 | 0.03357669 | 0.06365808 | -0.4834687 | -0.4834687 | 0.03339999 | 0.06487872 | -0.4834687 | 0.572112 | 0.03320575 | |
GOGARH | After | 0.1647109 | -0.6770023 | 0.2818023 | 0.07517399 | 0.1650192 | -0.6776378 | 0.2816662 | 0.07515297 | 0.3221641 | -0.1091047 | 1.716869 | 0.07502418 |
During | 0.07041624 | -0.4291153 | 0.2513056 | 0.0433674 | 0.0674483 | -0.4658975 | 0.2501365 | 0.0430959 | 0.1766807 | -0.1090858 | 0.8578254 | 0.04275875 | |
EMERG / Brent | |||||||||||||
DCC | After | 0.1482027 | -0.1181236 | 0.58407 | 0.1079452 | 0.1484365 | -0.1181236 | 0.5811174 | 0.1078748 | 0.1484333 | -0.1181236 | 0.5811174 | 0.108142 |
During | 0.1023957 | -0.0489724 | 0.3969809 | 0.1330395 | 0.1016825 | -0.0450557 | 0.3914664 | 0.1325385 | 0.102114 | -0.04524345 | 0.3914664 | 0.1327833 | |
ADCC | After | 0.1580188 | -0.0660094 | 0.6027581 | 0.1179227 | 0.1583303 | -0.0660094 | 0.6027581 | 0.1179014 | 0.1582889 | -0.06600948 | 0.6027581 | 0.1181526 |
During | 0.1065404 | -0.0404016 | 0.4056502 | 0.1410226 | 0.1059835 | -0.0366335 | 0.4002637 | 0.1416252 | 0.1063258 | -0.03683126 | 0.4002637 | 0.1410931 | |
GOGARH | After | 0.544149 | 0.3056887 | 1.329559 | 0.1644118 | 0.544406 | 0.306984 | 1.32713 | 0.1644726 | 0.545266 | 0.3069238 | 1.32524 | 0.1647495 |
During | 0.7715292 | 0.2687125 | 3.211972 | 0.1322184 | 0.8865007 | 0.2703791 | 3.248455 | 0.1464095 | 0.7770776 | 0.2704375 | 2.885044 | 0.1294281 | |
EMERG /VISTOXX | |||||||||||||
DCC | After | -0.0727382 | -0.2079442 | -0.0119064 | 0.2658239 | -0.0727995 | -0.2077739 | -0.0119064 | 0.2657156 | -0.0729090 | -0.2077739 | -0.0138341 | 0.266136 |
During | -0.0820221 | -0.196254 | -0.0216592 | 0.256139 | -0.0822618 | -0.196254 | -0.0216592 | 0.255773 | -0.0822959 | -0.1937993 | -0.0218531 | 0.2560182 | |
ADCC | After | -0.0724855 | -0.207944 | -0.0119058 | 0.2639487 | -0.0725453 | -0.2077733 | -0.0119058 | 0.2638442 | -0.0726533 | -0.2077733 | -0.0138352 | 0.2642484 |
During | -0.0820215 | -0.1962523 | -0.0216593 | 0.2561356 | -0.0822614 | -0.1962523 | -0.0216593 | 0.2557708 | -0.0822956 | -0.1937993 | -0.0218529 | 0.2560163 | |
GOGARH | After | -0.3891325 | -0.9140428 | -0.1641372 | 0.3767996 | -0.3894688 | -0.9063057 | -0.1642104 | 0.3774238 | -1.032392 | -4.107811 | -0.4064148 | 0.3783915 |
During | -0.5734326 | -1.464668 | -0.2167204 | 0.3131182 | -0.5724954 | -1.463568 | -0.21676 | 0.313153 | -0.6962901 | -2.605662 | -0.2720079 | 0.3131702 | |
EMERG /VIX | |||||||||||||
DCC | After | -0.0527599 | -0.1539912 | -0.0129938 | 0.1767879 | -0.0528648 | -0.1566418 | -0.0131460 | 0.1769473 | -0.0529334 | -0.1566418 | -0.0129938 | 0.1772304 |
During | -0.0706809 | -0.2004566 | -0.0228395 | 0.1760439 | -0.0708160 | -0.2004566 | -0.0228395 | 0.1758449 | -0.0708803 | -0.201622 | -0.0228703 | 0.1763806 | |
ADCC | After | -0.0519697 | -0.1497146 | -0.0125410 | 0.1716141 | -0.0520389 | -0.1512673 | -0.0127442 | 0.171622 | -0.0521855 | -0.1512673 | -0.0125410 | 0.1724517 |
During | -0.0684743 | -0.1955395 | -0.0221866 | 0.1644959 | -0.0686095 | -0.1955395 | -0.0221866 | 0.1643596 | -0.0685506 | -0.1953112 | -0.0221801 | 0.1645275 | |
GOGARH | After | -0.8412791 | -6.939782 | -0.3343132 | 0.2450262 | -0.3152685 | -0.6319149 | -0.1127918 | 0.2454567 | -0.3159241 | -0.6309794 | -0.1128476 | 0.2470849 |
During | -0.497231 | -2.149104 | -0.226922 | 0.2195331 | -0.5548234 | -1.745479 | -0.1741954 | 0.220251 | -0.5572266 | -1.745331 | -0.1742133 | 0.219813 | |
EMERG/CDS | |||||||||||||
DCC | After | -0.0604298 | -0.4564774 | 0.01157692 | 0.05124584 | -0.0602432 | -0.4564774 | 0.00993399 | 0.05082786 | -0.0609028 | -0.4317619 | 0.01157692 | 0.05156118 |
During | -0.0330437 | -0.0907255 | 0.001381608 | 0.05785379 | -0.0324585 | -0.0851274 | 0.001381608 | 0.05607442 | -0.0327240 | -0.09072553 | 0.001586288 | 0.0561486 | |
ADCC | After | -0.0606921 | -0.4564781 | 0.01157985 | 0.05153206 | -0.0606228 | -0.4564781 | 0.009929958 | 0.05134827 | -0.0609002 | -0.4317623 | 0.01157985 | 0.05155706 |
During | -0.0330442 | -0.0907256 | 0.00138160 | 0.0578543 | 0.03245848 | -0.0851271 | 0.00138160 | 0.05607447 | -0.0327239 | -0.09072562 | 0.00158628 | 0.05614845 | |
GOGARH | After | -0.2056799 | -0.8881027 | 0.01283549 | 0.08619358 | -0.2081404 | -0.8836188 | 0.01483905 | 0.08788171 | -0.4877729 | -6.002909 | 0.7445222 | 0.08983233 |
During | -0.4673315 | -2.439468 | -0.0111134 | 0.07272392 | -0.4668329 | -2.425539 | -0.0111130 | 0.07219926 | -0.1588782 | -0.2445048 | -0.1234449 | 0.06937778 | |
EMERG / DJCOM | |||||||||||||
DCC | After | 0.4404277 | 0.1078664 | 1.139088 | 0.175865 | 0.4404082 | 0.1101507 | 1.120637 | 0.1759935 | 0.4386107 | 0.1078664 | 1.139088 | 0.175646 |
During | 0.4841356 | 0.2489972 | 1.06964 | 0.2305234 | 0.484931 | 0.2488555 | 1.083011 | 0.2294946 | 0.4886133 | 0.2511547 | 1.083011 | 0.230238 | |
ADCC | After | 0.4465692 | 0.1095779 | 1.169864 | 0.1810106 | 0.4467187 | 0.1116368 | 1.152013 | 0.181257 | 0.4452534 | 0.1095779 | 1.169864 | 0.1811691 |
During | 0.4897615 | 0.2517685 | 1.089403 | 0.2357125 | 0.4902504 | 0.2530267 | 1.09521 | 0.2345078 | 0.4936277 | 0.2555537 | 1.09521 | 0.2347869 | |
GOGARH | After | 0.3857491 | -0.0726011 | 1.467995 | 0.1963463 | 0.3841245 | -0.0632842 | 1.446893 | 0.1944028 | 0.5031068 | 0.1670578 | 1.238322 | 0.261998 |
During | 0.5245704 | 0.1217508 | 2.133469 | 0.2485045 | 0.5202301 | 0.1192563 | 2.176903 | 0.2447087 | 0.5297793 | 0.1329954 | 2.091725 | 0.2507806 | |
Period | Refit=20 | Refit=40 | Refit=60 | ||||||||||
|---|---|---|---|---|---|---|---|---|---|---|---|---|---|
mean | min | max | HE | mean | min | max | HE | mean | min | max | HE | ||
EMERGI/Gold | |||||||||||||
DCC | After | 0.1090521 | -0.5584573 | 0.9042251 | 0.04301913 | 0.1091821 | -0.5411037 | 0.9042251 | 0.04272829 | 0.1094117 | -0.5411037 | 0.8994416 | 0.04250408 |
During | 0.05053687 | -0.5452059 | 0.4676115 | 0.03099718 | 0.05063183 | -0.5452059 | 0.4674059 | 0.03091046 | 0.05166628 | -0.5452059 | 0.4674059 | 0.0308164 | |
ADCC | After | 0.1144333 | -0.520215 | 0.9432188 | 0.04442046 | 0.1143198 | -0.4998328 | 0.9432188 | 0.0440693 | 0.1146183 | -0.4998328 | 0.9345973 | 0.04384985 |
During | 0.06473859 | -0.5168169 | 0.5331401 | 0.03227069 | 0.0641584 | -0.5168169 | 0.5250554 | 0.03206948 | 0.06512852 | -0.5168169 | 0.5250554 | 0.03188764 | |
GOGARH | After | 0.1672197 | -0.7267276 | 0.2947581 | 0.07807873 | 0.1676144 | -0.7269752 | 0.2958532 | 0.07812925 | 0.3185111 | -0.1099623 | 1.710215 | 0.07792813 |
During | 0.06516291 | -0.4753626 | 0.2405457 | 0.03584738 | 0.06243263 | -0.4734287 | 0.238185 | 0.03533289 | 0.148134 | -0.1046194 | 0.6773584 | 0.03482657 | |
EMERGI/ Brent | |||||||||||||
DCC | After | 0.1355979 | -0.1115375 | 0.578278 | 0.09618132 | 0.1357971 | -0.1115375 | 0.5768561 | 0.09613164 | 0.135912 | -0.1115375 | 0.5768561 | 0.09655278 |
During | 0.09438912 | -0.074127 | 0.3499186 | 0.1313219 | 0.09292833 | -0.0699495 | 0.3374801 | 0.1282162 | 0.09304135 | -0.06978898 | 0.3374801 | 0.1281579 | |
ADCC | After | 0.1463778 | -0.0746724 | 0.5867216 | 0.106584 | 0.1466813 | -0.0718266 | 0.5861432 | 0.1066308 | 0.1467184 | -0.07172784 | 0.5861432 | 0.1070608 |
During | 0.1001269 | -0.0653264 | 0.3638451 | 0.1420573 | 0.09864944 | -0.0611167 | 0.3515256 | 0.139148 | 0.098803 | -0.06089404 | 0.3515256 | 0.138852 | |
GOGARH | After | 0.6226952 | 0.2272767 | 2.166856 | 0.2063217 | 0.623915 | 0.2286328 | 2.169126 | 0.2069113 | 0.3797136 | 0.1853231 | 1.84579 | 0.2080019 |
During | 0.8178667 | 0.2415211 | 3.634977 | 0.1514792 | 0.9505528 | 0.2438711 | 3.739604 | 0.1743954 | 0.2773682 | 0.09053353 | 0.7716691 | 0.1546882 | |
EMERGI/VISTOXX | |||||||||||||
DCC | After | -0.0676959 | -0.2120372 | -0.0088755 | 0.235609 | -0.0677876 | -0.2120372 | -0.0088755 | 0.2357443 | -0.0678029 | -0.2083173 | -0.0098348 | 0.2357171 |
During | -0.0759901 | -0.1729815 | -0.0252313 | 0.2270737 | -0.0762037 | -0.1729815 | -0.0252313 | 0.2269169 | -0.0761802 | -0.1719136 | -0.0253441 | 0.226832 | |
ADCC | After | -0.0674776 | -0.2110872 | -0.0088765 | 0.234003 | -0.067565 | -0.2110872 | -0.0088765 | 0.2341337 | -0.0675842 | -0.2083172 | -0.0098347 | 0.234119 |
During | -0.0252311 | -0.1729813 | -0.0759897 | 0.2270713 | -0.0762033 | -0.1729813 | -0.0252311 | 0.2269151 | -0.0761801 | -0.1719131 | -0.0253459 | 0.2268323 | |
GOGARH | After | -0.9851581 | -3.880605 | -0.2432455 | 0.3504824 | -0.9855668 | -3.880668 | -0.2432123 | 0.3511828 | -0.3845946 | -1.67563 | -0.1786607 | 0.3521706 |
During | -0.6127465 | -2.195504 | -0.2724677 | 0.2772851 | -0.6128958 | -2.195645 | -0.2770663 | 0.2773269 | -0.548929 | -1.220483 | -0.2277916 | 0.276857 | |
EMERGI/VIX | |||||||||||||
DCC | After | -0.0494423 | -0.1558218 | -0.012523 | 0.1592096 | -0.0496335 | -0.1558218 | -0.012523 | 0.1598795 | -0.0496037 | -0.1529795 | -0.012523 | 0.1595965 |
During | -0.0676679 | -0.1766011 | -0.0261365 | 0.1656378 | -0.0678034 | -0.1766011 | -0.0261365 | 0.1656479 | -0.0677088 | -0.1768002 | -0.0260693 | 0.1655693 | |
ADCC | After | -0.0475119 | -0.1513178 | -0.0116341 | 0.1480236 | -0.0476793 | -0.1513178 | -0.0116341 | 0.1485063 | -0.0476554 | -0.1448227 | -0.0116341 | 0.1481624 |
During | -0.0644872 | -0.169118 | -0.024955 | 0.1507272 | -0.0646281 | -0.169118 | -0.024955 | 0.1508002 | -0.0644833 | -0.1687302 | -0.0248419 | 0.1505505 | |
GOGARH | After | -0.8377176 | -5.959565 | -0.187957 | 0.243772 | -0.8377396 | -5.954266 | -0.1877426 | 0.2440667 | -0.3171623 | -1.250762 | -0.1305108 | 0.245597 |
During | -0.4536477 | -2.063812 | -0.191883 | 0.1864881 | -0.4530088 | -2.063757 | -0.1941658 | 0.1867634 | -0.5024366 | -1.348443 | -0.1980499 | 0.1859668 | |
EMERGI/CDS | |||||||||||||
DCC | After | -0.0578985 | -0.4677504 | 0.01412011 | 0.04767914 | -0.0580313 | -0.4677504 | 0.0127981 | 0.04778934 | -0.0582072 | -0.4416967 | 0.01412011 | 0.04774828 |
During | -0.0296534 | -0.0740437 | 0.001017602 | 0.04437142 | -0.0292489 | -0.0703525 | 0.001017602 | 0.04311903 | -0.0294363 | -0.07404378 | 0.001292259 | 0.04358022 | |
ADCC | After | -0.0578983 | -0.4677505 | 0.01412043 | 0.04767921 | -0.0580314 | -0.4677505 | 0.01279814 | 0.04778944 | -0.0582067 | -0.4416968 | 0.01412043 | 0.04774807 |
During | -0.0296531 | -0.0740438 | 0.001017598 | 0.04437088 | -0.0292477 | -0.0703516 | 0.00101759 | 0.04311621 | 0.02943386 | -0.07404385 | 0.001292274 | 0.0435742 | |
GOGARH | After | -0.2155762 | -1.615089 | 0.015997 | 0.09625207 | -0.497818 | -7.073178 | 1.362618 | 0.0980953 | -0.5124872 | -7.051554 | 1.074514 | 0.1009827 |
During | -0.4696971 | -1.957906 | -0.0119884 | 0.07199738 | -0.1555586 | -0.2111425 | -0.126121 | 0.07160619 | -0.1540816 | -0.1997818 | -0.126121 | 0.06960183 | |
EMERGI/ DJCOM | |||||||||||||
DCC | After | 0.3872718 | 0.0879061 | 1.024225 | 0.1429442 | 0.3871942 | 0.09136539 | 1.011351 | 0.1430415 | 0.3855939 | 0.09097076 | 1.024225 | 0.1429278 |
During | 0.4364399 | 0.2164672 | 0.8717894 | 0.1902203 | 0.4379817 | 0.2162639 | 0.891294 | 0.1905297 | 0.4393717 | 0.2188126 | 0.891294 | 0.1894795 | |
ADCC | After | 0.3946111 | 0.08787634 | 1.097266 | 0.1483376 | 0.394737 | 0.09135561 | 1.097266 | 0.1485609 | 0.393426 | 0.09097547 | 1.04762 | 0.1486701 |
During | 0.4397417 | 0.2164866 | 0.8814217 | 0.1936781 | 0.8928631 | 0.216444 | 0.4408137 | 0.1938112 | 0.8928631 | 0.2200192 | 0.4413857 | 0.1916031 | |
GOGARH | After | 0.4495758 | -1.760897 | 0.5596919 | 0.1952896 | 0.4484473 | -1.757034 | 0.559932 | 0.1942433 | 0.4466807 | -1.115232 | 0.5594586 | 0.1941507 |
During | 0.4421234 | 0.2557971 | 0.4887852 | 0.2537099 | 0.4411454 | 0.2537975 | 0.4889719 | 0.2538102 | 0.4394398 | 0.2490086 | 0.4831024 | 0.2515211 | |
5.2. Impact of COVID-19 on Hedge and Safe Haven Properties
 are initially extracted and transferred from the VAR-DCC models with innovations assumed follow bivariate t-student distribution, to be subsequently regressed on dummy variables representing market turmoil to test whether there are changes in hedge and safe haven properties of altenatives during COVID-19 period. We have willingly considered to adopt the regression models for the simple reason that we have realized it a bit odd to carry out an analysis dealing with the impact of presence of extreme returns on the correlation. We estimate and test the significance of the parametrers of the following linear regression model:
  (17)
(17)  represent dummy variables that capture extreme movements in the underlying stock markets at the 10%, 5% and 1% quantiles of the most negative stock returns.
  QUOTE (m0) is zero, or might also represent strong hedging instruments if
  QUOTE (m0) is statistically significante and negative. In the other hand, alternative asset is considered as a weak safe haven tools against movements in the other asset if the
  QUOTE m1 ,
  QUOTE m2 and coefficients are not significantly different from zero. Asset is a Strong safe haven if these coefficients turn out to be statistically significant and negative. A negative correlation of asset and stock in extreme market conditions implies that the price of asset increases in such conditions thereby compensating investors for losses incurred with stock investments.
 EMERG | EMERGI | |||||||||||
|---|---|---|---|---|---|---|---|---|---|---|---|---|
Gold | Brent | VISTOXX | VIX | CDS | DJ COMM | Gold | Brent | VISTOXX | VIX | CDS | DJ COMM | |
Before COVID-19 | ||||||||||||
| 0.1325*** | 0.3183*** | -0.5219*** | -0.4336*** | -0.2096*** | 0.4264*** | 0.1195*** | 0.3038*** | -0.4904*** | -0.4118*** | -0.2091*** | 0.3930*** |
| 0.0073 | 0.0129. | -0.0084* | -0.0341* | 0.0043 | 0.0123* | -0.0038 | 0.0148. | -0.0106** | -0.0111*** | 0.0061 | 0.01617* |
| 0.0529 | -0.0121 | 0.0081. | 0.0023 | 0.0121 | -0.0008 | 0.0228* | -0.0052 | 0.0043 | 0.0064. | 0.0093 | -0.0008 |
| -0.005 | -0.0136. | 0.0097* | 0.0063*** | 0.0191* | -0.0174** | -0.0114 | -0.0223** | 0.0147*** | 0.0052. | 0.0190* | -0.0236*** |
During COVID-19 | ||||||||||||
| 0.0620*** | 0.3296*** | -0.5214*** | -0.4349*** | -0.2700*** | 0.4864*** | 0.0637*** | 0.3150*** | -0.4901*** | -0.4225*** | -0.2341*** | 0.4465*** |
| -0.0342 | -0.0163 | -0.0068 | -0.0023 | 0.0106 | -0.0076 | -0.0108 | -0.0381 | 0.0078 | 0.0084 | -0.0027 | -0.015 |
| 0.0720. | -0.0328 | 0.0331** | 0.0178* | -0.0247 | -0.0118 | 0.0254 | -0.0147 | 0.031. | 0.0134 | 0.0055 | -0.0035 |
| -0.0519. | -0.0007 | -0.0105 | -0.0035 | 0.0119 | 0.0004 | -0.0231 | 0.011 | -0.0211 | -0.0081 | -0.0068 | 0.0046 |
Test de Show | 44.56*** | 17.54*** | 0.9287 | 8.2189*** | 40.6925*** | 86.3413*** | 29.8364*** | 3.4981** | 0.9343 | 14.93002*** | 16.0074*** | 40.2937*** |
 QUOTE (m0) is zero, or might also represent strong hedging instruments if
  QUOTE (m0) is statistically significante and negative. In the other hand, alternative asset is considered as a weak safe haven tools against movements in the other asset if the
  QUOTE m1 ,
  QUOTE m2 and coefficients are not significantly different from zero. Asset is a Strong safe haven if these coefficients turn out to be statistically significant and negative. A negative correlation of asset and stock in extreme market conditions implies that the price of asset increases in such conditions thereby compensating investors for losses incurred with stock investments. Zghal et al. (2018) and Zghal and Ghorbel (2020) analysis the impact of data frequency on safe haven and hedge properties of various assets among which we can cite VIX, Bitcoin and CDS.
 | [1] | Alawadhi, M., Al-Saifi, K., Al-Awadhi, A,. Alhammadi, S., (2020). ‘Death and contagious infectious diseases: Impact of the COVID-19 virus on stock market returns’. Journal of Behavioral and Experimental Finance (27). |
| [2] | Arouri, M. Jouini, J. Nguyen, D. K., (2011). ‘Volatility spillovers between oil prices and stock sector returns: Implications for portfolio management’. Journal of International Money and Finance 30, pp- 1387-1405. |
| [3] | Ashraf, B. N., (2020). ‘Stock markets’ reaction to COVID-19: Cases or fatalities?’’. Int. Business and Finance, 54, 101249. |
| [4] | Ashraf, B., (2020). ‘Stock markets’ reaction to COVID-19: cases or fatalities?’School of Finance, Jiangxi University of Finance and Economics, Nanchang (330013), China. |
| [5] | Baek, S., Mohanty, S. K., Glambosky, M., (2020). ‘COVID-19 and stock market volatility: An industry level analysis’. Finance Research Letters. 37, 101748. |
| [6] | Baker, S, R,. Bloom, N., Davis, S. J., Terry, S. J,. (2020). ‘COVID-Induced Economic Uncertainty’. NBER Working Paper (26983) National Bureau of Economic Research. |
| [7] | Cappiello, L., Engle, R. F., Sheppard, K., (2006). ‘Asymmetric correlations in the dynamics of global equity and bond returns’. Journal of Financial Econometrics, 4(4): 537-572. |
| [8] | Carlsson-Szlezak, Philipp, Reeves, M., & Swartz, P., (2020). ‘Understanding the Economic Shock of Coronavirus.’ Harvard Business Review. |
| [9] | Close Q. He, J. Liu, S. Wang, J. Yu., (2020). ‘The impact of COVID-19 on stock markets’ Econ. Pol. Stud. 8, pp. 228-275. |
| [10] | Elgin C., Basbug G., Yalaman, A. (2020) Economic policy responses to a pandemic: developing the COVID-19 economic stimulus index. COVID Econ., Vetted Real Time Papers. 2020; 3: 40–53. [Google Scholar]. |
| [11] | Engle, R. F., (2002). ‘Dynamic conditional correlation: A simple class of multivariate generalized autoregressive conditional heteroskedasticity models’. Journal of Business and Economic Statistics 20, 339-350. |
| [12] | Fallahgoul, H., (2020). 'Inside the Mind of Investors During the COVID-19 Pandemic: Evidence from the StockTwits Data Forthcoming', Journal of Financial Data Science. |
| [13] | Gil-Alana, L. A., & Monge, M., (2020). ‘Crude Oil Prices and COVID-19: Persistence of the Shock’. Energy RESEARCH LETTERS, 1(1). |
| [14] | Glosten, L. R., Jagannathan, R., Runkle. D. E., (1993). ‘On the relation between the expected value and the volatility of the nominal excess return on stocks’. Journal of Finance 48, 1779-1801. |
| [15] | Hamma, W., Jarboui, A., Ghorbel, A., (2014), 'Effect of Oil Price Volatility on Tunisian Stock Market at Sector-level and Effectiveness of Hedging Strategy'. Procedia Economics and Finance. Vol-13, PP109-127. |
| [16] | Hanif. W, Mensi. W, and Vinh, X., (2020). ‘Impacts of COVID-19 outbreak on the spillovers between US and Chinese stock sectors’. Financ Res Lett. 40, 101922. |
| [17] | Haroon, O., Rizvi, S. A. R., (2020). ‘COVID-19: media coverage and financial markets behavior—A sectoral inquiry’. J. Behav. Exp. Finance 27 |
| [18] | He, Q., Liu, J., Wang, S., & Yu, J., (2020). ‘The impact of COVID-19 on stock markets’. Economic and Political Studies, 8: 3, 275-288. |
| [19] | Kroner, K. F., and Sultan, J., (1993). ‘Time dynamic varying distributions and dynamic hedging with foreign currency futures’, Journal of Financial and Quantitative Analysis, 28, 535–551. |
| [20] | Kroner, K. F., Ng, V. K., (1998). ‘Modeling asymmetric movements of asset prices’. Review of Financial Studies 11, 844–871. |
| [21] | Ku, Y. H. H., Chen, H. C., Chen, K. H., (2007). ‘On the application of the dynamic conditional correlation model in estimating optimal time-varying hedge ratios’. Appl. Econ. Lett. 14, 503–509. |
| [22] | Lyócsa, Š., Molnár, P., (2020). ‘Stock market oscillations during the corona crash: The role of fear and uncertainty’. Finance Research Letters, 36. |
| [23] | Mensi, W., Sensoy, A., Vod, X. V., Kange, S. V., (2020). ‘Impact of COVID-19 outbreak on asymmetric multifractality of gold and oil prices’. Resources Policy, 69, 101829. |
| [24] | Narayan, P. K. (2020). ‘Oil price news and COVID-19—Is there any connection?’. Energy RESEARCH LETTERS, |
| [25] | Nicolaa, M, Alsafi., Z, Sohrabi., C, Kerwan., A, Al-Jabird., A, Iosifidis., C, Agha., M, Agha., R., (2020). ‘The socio-economic implications of the coronavirus pandemic (COVID-19): A review’. International Journal of Surgery, 78, P185-193. |
| [26] | Onali, E. (2020).’COVID-19 and Stock Market Volatility’. Available at SSRN: |
| [27] | Papadamou, S., Fassa, A. P., Kenourgios, D., Dimitriou, D., (2020). ‘Direct and Indirect Effects of COVID-19 Pandemic on Implied Stock Market Volatility: Evidence from Panel Data Analysis’. MPRA Paper No. 100020. |
| [28] | Salisu, A. A., Ogbonna, A. E., & Adewuyi, A., (2020). ‘Google trends and the predictability of precious metals’. Resources Policy, 65, 101542. |
| [29] | Sharif, A., Aloui, A,., Yarovaya, L,. (2020). 'COVID-19 pandemic, oil prices, stock market, geopolitical risk and policy uncertainty nexus in the US economy: Fresh evidence from the wavelet-based approach. International Review of Finance, Vol54. |
| [30] | Shehzad, K., Xiaoxing, L. and Kazouz, H. (2020). ‘COVID-19’s disasters are perilous than Global Financial Crisis: A rumor or fact?’. Finance Research Letters, In Press, |
| [31] | Topcu, M., Gulal, O. S., (2020). ‘The impact of COVID-19 on emerging stock markets’. Finance Research Letters, 36, 101691. |
| [32] | Van der Weide, R., (2002), Sep. ‘GO-GARCH: a multivariate generalized orthogonal GARCH model’. J. Appl. Econom. 17 (5), 549–564. |
| [33] | Zaremba, A., Kizys, R., Aharon, D. Y., & Demir, E. (2020). ‘Infected Markets: Novel Coronavirus, Government Interventions, and Stock Return Volatility around the Globe’. Finance Research Letters, 35, 101597. |
| [34] | Zhang, D., Hu, M., & Ji, Q. (2020). ‘Financial markets under the global pandemic of COVID-19’. Finance Research Letters, vol 36. 101528. |
| [35] | Zhang, W., Hamori, S., (2020). ‘Crude oil market and stock markets during the COVID-19 pandemic: Evidence from the US, Japan, and Germany’. International Review of Financial Analysis, 74. |
APA Style
Hamma, W., Ghorbel, A., Jarboui, A. (2024). The Impact of COVID-19 Epidemic on the Hedging Islamic and Conventional Stock Markets with Financial Assets . International Journal of Economic Behavior and Organization, 12(1), 1-24. https://doi.org/10.11648/j.ijebo.20241201.11
ACS Style
Hamma, W.; Ghorbel, A.; Jarboui, A. The Impact of COVID-19 Epidemic on the Hedging Islamic and Conventional Stock Markets with Financial Assets . Int. J. Econ. Behav. Organ. 2024, 12(1), 1-24. doi: 10.11648/j.ijebo.20241201.11
AMA Style
Hamma W, Ghorbel A, Jarboui A. The Impact of COVID-19 Epidemic on the Hedging Islamic and Conventional Stock Markets with Financial Assets . Int J Econ Behav Organ. 2024;12(1):1-24. doi: 10.11648/j.ijebo.20241201.11
@article{10.11648/j.ijebo.20241201.11,
  author = {Wajdi Hamma and Ahmed Ghorbel and Anis Jarboui},
  title = {The Impact of COVID-19 Epidemic on the Hedging Islamic and Conventional Stock Markets with Financial Assets
},
  journal = {International Journal of Economic Behavior and Organization},
  volume = {12},
  number = {1},
  pages = {1-24},
  doi = {10.11648/j.ijebo.20241201.11},
  url = {https://doi.org/10.11648/j.ijebo.20241201.11},
  eprint = {https://article.sciencepublishinggroup.com/pdf/10.11648.j.ijebo.20241201.11},
  abstract = {This study investigates optimal hedging ratios for Islamic and conventional stock markets during the COVID-19 pandemic using the DCC (Dynamic Conditional Correlation), ADCC (Asymmetric Dynamic Conditional Correlation), and GO-GARCH (Generalized Orthogonal GARCH) models. The effectiveness of various financial assets as hedges is evaluated, and findings indicate that the DJCOM (Dow Jones Commodity), VISTOXX (Euro STOXX 50 Volatility Index), and VIX (Chicago Board Options Exchange Volatility Index) indices exhibit superior effectiveness across both market types, particularly DJCOM showing exceptional performance during the COVID-19 period. The hedging analysis indicates that the hedge ratios vary and depend upon the hedge instrument included in the portfolio. Furthermore, the empirical results indicate that the global impact of the pandemic diminishes the viability of one of the six assets as a safe haven instrument. In conclusion, these findings provide valuable insights for investors and portfolio managers aiming to utilize Gold, Brent, VISTOXX, VIX, CDS (Credit Default Swap), and DJCOM for portfolio rebalancing to mitigate risks associated with volatile Islamic and conventional stock returns. These conclusions contribute significantly to helping investors adjust their investment strategies more effectively and adapt to changing market conditions.
},
 year = {2024}
}
TY  - JOUR
T1  - The Impact of COVID-19 Epidemic on the Hedging Islamic and Conventional Stock Markets with Financial Assets

AU  - Wajdi Hamma
AU  - Ahmed Ghorbel
AU  - Anis Jarboui
Y1  - 2024/04/02
PY  - 2024
N1  - https://doi.org/10.11648/j.ijebo.20241201.11
DO  - 10.11648/j.ijebo.20241201.11
T2  - International Journal of Economic Behavior and Organization
JF  - International Journal of Economic Behavior and Organization
JO  - International Journal of Economic Behavior and Organization
SP  - 1
EP  - 24
PB  - Science Publishing Group
SN  - 2328-7616
UR  - https://doi.org/10.11648/j.ijebo.20241201.11
AB  - This study investigates optimal hedging ratios for Islamic and conventional stock markets during the COVID-19 pandemic using the DCC (Dynamic Conditional Correlation), ADCC (Asymmetric Dynamic Conditional Correlation), and GO-GARCH (Generalized Orthogonal GARCH) models. The effectiveness of various financial assets as hedges is evaluated, and findings indicate that the DJCOM (Dow Jones Commodity), VISTOXX (Euro STOXX 50 Volatility Index), and VIX (Chicago Board Options Exchange Volatility Index) indices exhibit superior effectiveness across both market types, particularly DJCOM showing exceptional performance during the COVID-19 period. The hedging analysis indicates that the hedge ratios vary and depend upon the hedge instrument included in the portfolio. Furthermore, the empirical results indicate that the global impact of the pandemic diminishes the viability of one of the six assets as a safe haven instrument. In conclusion, these findings provide valuable insights for investors and portfolio managers aiming to utilize Gold, Brent, VISTOXX, VIX, CDS (Credit Default Swap), and DJCOM for portfolio rebalancing to mitigate risks associated with volatile Islamic and conventional stock returns. These conclusions contribute significantly to helping investors adjust their investment strategies more effectively and adapt to changing market conditions.

VL  - 12
IS  - 1
ER  -
Department of Finance (FESGS), Faculty of Economics and Management, University of Sfax, Sfax, Tunisia
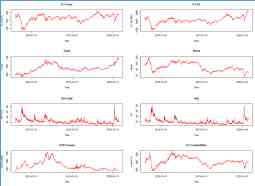
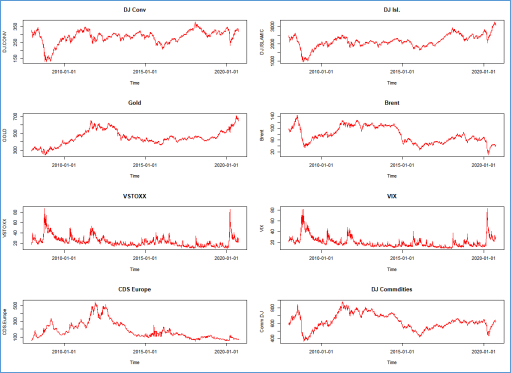
Figure 1. Plots of daily price indices (Period from December 27, 2007 to September 24, 2020).
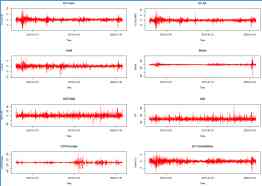
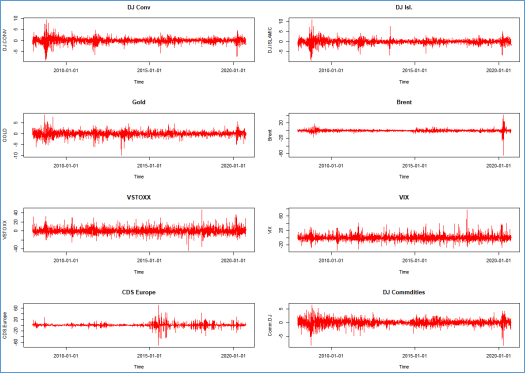
Figure 2. Plot of daily squared return of sample variables (Period from December 27, 2007 to September 24, 2020).
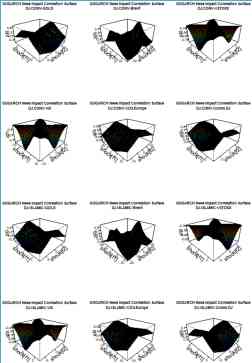
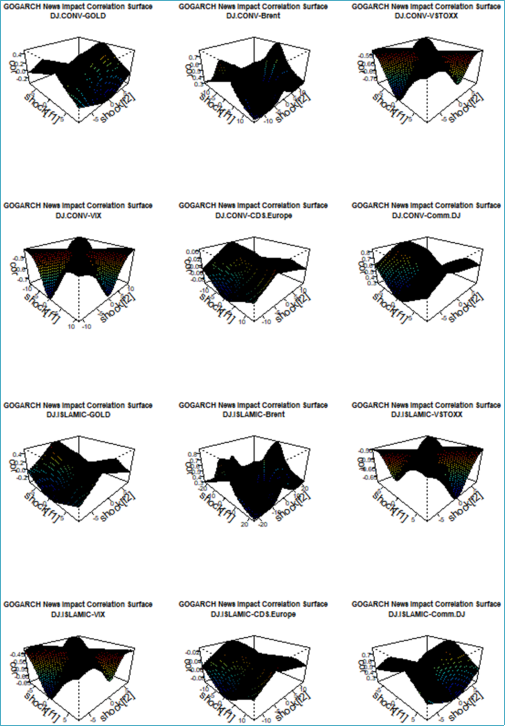
Figure 3. News impact correlation surface (GOGARCH).
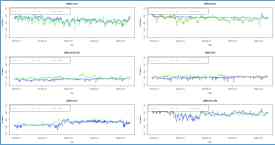
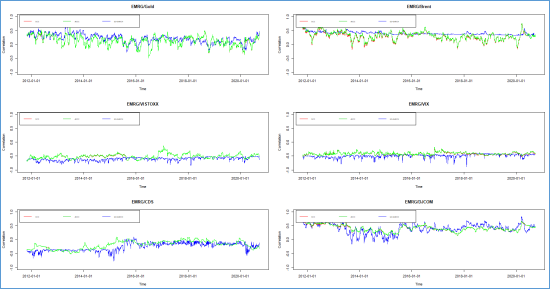
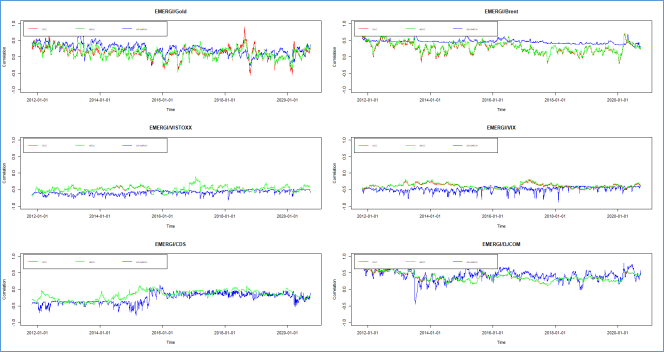
Figure 4. Rolling one- step ahead Conditional correlation forecast between EMERG and each of alternatives assets obtained from DCC, ADCC and GOGARCH models.
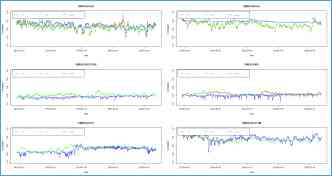
Figure 5. Rolling one- step ahed Conditional correlation forecast between EMERGI and each of alternatives assets obtained from DCC, ADCC and GOGARCH models (refit=20).
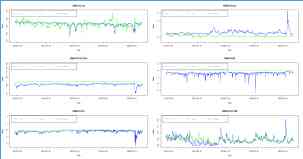
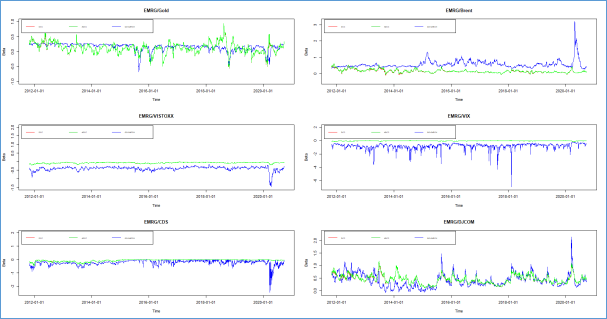
Figure 6. Time series plot of optimal hedge ratio of various alternatives for EMER index obtained with three MGARCH versions.
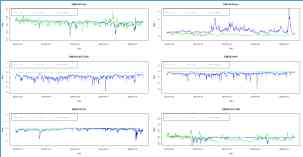
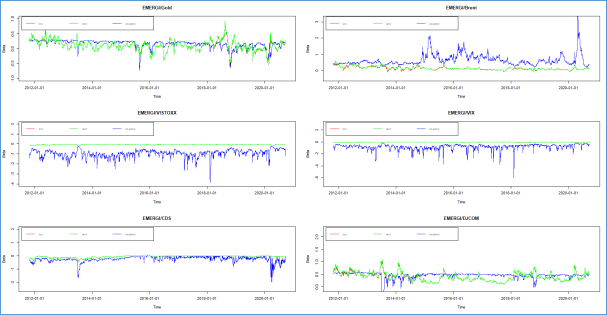
Figure 7. Time series plot of optimal hedge ratio of various alternatives for EMERGI index obtained with three MGARCH versions.
Table 1. Previous researches on the relationship between the stock markets and the COVID-19 pandemic.
Table 2. Summary statistics for daily returns.
Table 3. Pearson correlations matrix between daily returns.
Table 4. Pearson correlations matrix between daily squared returns.
Table 5. DCC and ADCC parameter estimates.
Table 6. Correlations between hedge ratios before and during COVID-19 period.
Table 7. Correlations between correlations obtained with three MGARCH versions before and during COVID-19 period.
Table 8. Summary statistics of hedge ratios (![]() ) and hedge effectiveness (HE) for EMRG -MVT distribution.) and hedge effectiveness (HE) for EMRG -MVT distribution.
) and hedge effectiveness (HE) for EMRG -MVT distribution.) and hedge effectiveness (HE) for EMRG -MVT distribution.
Table 9. Summary statistics of hedge ratios (![]() ) and hedge effectiveness (HE) for EMERGI -MVT distribution.) and hedge effectiveness (HE) for EMERGI -MVT distribution.
) and hedge effectiveness (HE) for EMERGI -MVT distribution.) and hedge effectiveness (HE) for EMERGI -MVT distribution.
Table 10. Hedge and safe haven properties of alternatives with emerging markets.
Information