This study investigates the efficacy of rooftop rainwater harvesting (RWH) at Addis Ababa Science and Technology University (AASTU) as a sustainable water and energy conservation strategy. The research aims to optimize water resource allocation by prioritizing harvested rainwater for non-domestic applications, thereby reducing pressure on conventional domestic water supplies. Utilizing ground measurements and ArcGIS spatial analysis, the total rooftop catchment area was quantified as 68,195.74 m2. Annual harvestable rainwater potential, derived from Ethiopian Meteorology Agency (EMA) rainfall data (Akaki station), was estimated at 662,273.4 m3. Concurrently, irrigation demand for AASTU’s landscaping—calculated through crop water requirement assessments and standardized crop coefficients was determined to be 184,830.33 m3/year. The results demonstrate a substantial surplus of harvestable rainwater, underscoring RWH’s viability in meeting institutional non-potable demands. These findings advocate for rooftop RWH systems as a critical component of integrated water management strategies, offering a scalable model to mitigate resource scarcity in urban academic environments. The study provides actionable insights for policymakers and institutional stakeholders to advance sustainable water stewardship practices.
| Published in | International Journal of Energy and Environmental Science (Volume 10, Issue 4) |
| DOI | 10.11648/j.ijees.20251004.11 |
| Page(s) | 55-72 |
| Creative Commons |
This is an Open Access article, distributed under the terms of the Creative Commons Attribution 4.0 International License (http://creativecommons.org/licenses/by/4.0/), which permits unrestricted use, distribution and reproduction in any medium or format, provided the original work is properly cited. |
| Copyright |
Copyright © The Author(s), 2025. Published by Science Publishing Group |
Rooftop Rainwater Harvesting (RWH), Non-domestic Water Use, Water Scarcity Solutions, GIS and Ground Measurement, Sustainable Water Management
Regular part | Area(A | Internal | 2Ai | External | 2Ae | Total Area | |||
|---|---|---|---|---|---|---|---|---|---|
L | W | L | W | L | W | At=A-2Ai+2Ae | |||
44.5 | 25.6 | 1139.2 | 13.8 | 9.15 | 252.54 | 6 | 4.2 | 50.4 | 937.06 |
Building Type | Sample and Code | Measured (m2) | GIS (m2) |
|---|---|---|---|
Dormitory | ®-1 | 937.06 | 989.9912 |
Rectangular type (7) | ®-2 | 939.57 | 961.1096 |
(L)-1 | 523.2 | ||
L-shape (8) | 489.7866 | ||
(L)-2 | 525.1 | 474.5807 | |
(L)-3 | 523.5 | 518.0995 | |
White House Type (14) | (W)-1 | 780.82 | 973.9228 |
(W)-2 | 780.82 | 1097.238 | |
(W)-3 | 985 | 985.0242 | |
(W)-4 | 1061 | 1094.501 | |
Clinic Type (7) | (CT)-1 | 238.68 | 257.9339 |
(CT)-2 | 237.15 | 264.1241 | |
(CT)-3 | 236.36 | 483.0348 | |
Cafe type (3) | (CF)-1 | 1580.315 | 1570.403 |
Class Type (12) | (CL)-1 | 693.06 | 257.9339 |
(CL)-2 | 686.928 | 264.1241 | |
(CL)-3 | 696.35 | 483.0348 | |
Administration Type (4) | (AT)-1 | 684 | 644.9455 |
(AT)-2 | 684.1 | 655.488 | |
Lecture Theatre (7) | (LT)-1 | 614.76 | 481.7134 |
(LT-2) | 621.36 | 488.8686 | |
Museum Type (6) | (MT)-1 | 437.9 | 429.1614 |
(MT)-2 | 440.8 | 459.2833 | |
Circular Lounge (3) | ©-1 | 480.81 | 257.9339 |
©-2 | 490.625 | 264.1241 | |
Laboratory (5) | (Lab)-1 | 648.74 | 554.01341 |
(Lab)-2 | 641.68 | 497.95144 | |
Library (3) | (Lib)-1 | 2086.92 | 2246.371 |
(Lib)-2 | 2088.8 | 2271.984 | |
Laundry (10) | (Lau)-1 | 163.48 | 148.2076 |
(Lau)-2 | 163.35 | 155.3525 | |
(Lau)-3 | 161.66 | 159.6115 | |
Metal work (2) | (Mw)-1 | 1256.96 | 1185.741 |
R. L | Type | Quantity | Washed cars per week | Frequency | Need water in Litter | Required demand per week in (L) |
|---|---|---|---|---|---|---|
1 | Ambulance type | 10 | 3 | 3 | 30 | 270 |
2 | Land Cruses Type | 28 | 6 | 2 | 30 | 360 |
3 | Services bus | 7 | 7 | 3 | 100 | 2100 |
Total | 45 | 16 | 110 | 2730 |
Year | Types of plants | Quantity in Numbers |
|---|---|---|
2016 | Yellow wood | 800 |
Olive | 2100 | |
Dire Dawa tree (pistachio) | 2300 | |
Ebony | 500 | |
NIMI | 1250 | |
Jacaranda | 1650 | |
Shewashew | 2000 | |
Grave Lia | 3000 | |
Bottlebrush | 1350 | |
Amedula | 2000 | |
Spatodia | 2150 | |
Deciduous | 900 | |
2015 | All type | 3000 |
2014 | All type | 5000 |
Tot | 28000 |
year | Jan | Feb | Mar | Apr | May | June | July | Aug | Sep | Oct | Nov | Dec | Sum |
|---|---|---|---|---|---|---|---|---|---|---|---|---|---|
2006 | 0.95 | 2.54 | 2.69 | 3.1 | 1.58 | 3.69 | 9.52 | 9.34 | 5.66 | 2.1 | 0.9 | 0.9 | 42.970 |
2007 | 1.97 | 1.36 | 1.7 | 4.13 | 2.95 | 5.28 | 8.68 | 8.03 | 5.53 | 1.09 | 0.94 | 0.87 | 42.530 |
2008 | 0.87 | 0.93 | 0.89 | 2.04 | 2.01 | 4.67 | 8.18 | 8.14 | 6.38 | 0.23 | 2.16 | 0 | 36.500 |
2009 | 1.94 | 0 | 0.32 | 3.96 | 1.54 | 2.12 | 7.84 | 10.4 | 2.38 | 1.06 | 0.13 | 0.54 | 32.230 |
2010 | 0 | 2.28 | 4.07 | 5.67 | 3.07 | 5.49 | 11.15 | 5.48 | 5.14 | 0.17 | 0.49 | 0.25 | 43.260 |
2011 | 0 | 0.09 | 1.46 | 0.69 | 4.15 | 2 | 6.59 | 9.81 | 6.48 | 0 | 0.16 | 0 | 31.430 |
2012 | 0 | 0 | 0.97 | 2.03 | 0.87 | 2.69 | 7.35 | 7.87 | 4.1 | 0 | 0 | 0 | 25.880 |
2013 | 0 | 0 | 2.48 | 2.97 | 2.37 | 3.6 | 5.79 | 7.82 | 4.75 | 0.66 | 0 | 0.01 | 30.450 |
2014 | 0 | 1.41 | 2.45 | 0.46 | 0 | 1.75 | 5.89 | 9.08 | 3.84 | 1.69 | 0 | 0 | 26.570 |
2015 | 0 | 0 | 0.44 | 0 | 3.11 | 5.27 | 6.06 | 7.98 | 2.26 | 0 | 0.48 | 0 | 25.600 |
2016 | 0 | 0 | 1.4 | 6.15 | 4.33 | 3.52 | 7.55 | 5.93 | 3.77 | 0.52 | 0.3 | 0 | 33.470 |
Avg | 0.52 | 0.78 | 1.72 | 2.84 | 2.36 | 3.64 | 7.69 | 8.18 | 4.57 | 0.68 | 0.51 | 0.23 | 33.720 |
Latitude | Jan July | Feb Aug | Mar Sept | Apr Oct | May Nov | Jun Dec | July Jan | Aug Feb | Sep Mar | Oct Apr | Nov May | Dec June |
|---|---|---|---|---|---|---|---|---|---|---|---|---|
60o | 0.15 | 0.20 | 0.26 | 0.32 | 0.38 | 0.41 | 0.40 | 0.34 | 0.28 | 0.22 | 0.17 | 0.13 |
55 | 0.17 | 0.21 | 0.26 | 0.32 | 0.36 | 0.39 | 0.38 | 0.33 | 0.28 | 0.23 | 0.18 | 0.16 |
50 | 0.19 | 0.23 | 0.27 | 0.31 | 0.34 | 0.36 | 0.35 | 0.32 | 0.28 | 0.24 | 0.20 | 0.18 |
45 | 0.20 | 0.23 | 0.27 | 0.30 | 0.34 | 0.35 | 0.34 | 0.32 | 0.28 | 0.24 | 0.21 | 0.20 |
40 | 0.22 | 0.24 | 0.27 | 0.30 | 0.32 | 0.34 | 0.33 | 0.31 | 0.28 | 0.25 | 0.22 | 0.21 |
35 | 0.23 | 0.25 | 0.27 | 0.29 | 0.31 | 0.32 | 0.32 | 0.30 | 0.28 | 0.25 | 0.23 | 0.22 |
30 | 0.24 | 0.25 | 0.27 | 0.29 | 0.31 | 0.32 | 0.31 | 0.30 | 0.28 | 0.26 | 0.24 | 0.23 |
25 | 0.24 | 0.26 | 0.27 | 0.29 | 0.30 | 0.31 | 0.31 | 0.29 | 0.28 | 0.26 | 0.25 | 0.24 |
20 | 0.25 | 0.26 | 0.27 | 0.28 | 0.29 | 0.30 | 0.30 | 0.29 | 0.28 | 0.26 | 0.25 | 0.25 |
15 | 0.26 | 0.26 | 0.27 | 0.28 | 0.29 | 0.29 | 0.29 | 0.28 | 0.28 | 0.27 | 0.26 | 0.25 |
10 | 0.26 | 0.27 | 0.27 | 0.28 | 0.28 | 0.29 | 0.29 | 0.28 | 0.28 | 0.27 | 0.26 | 0.26 |
5 | 0.27 | 0.27 | 0.27 | 0.28 | 0.28 | 0.28 | 0.28 | 0.28 | 0.28 | 0.27 | 0.27 | 0.27 |
0 | 0.27 | 0.27 | 0.27 | 0.27 | 0.27 | 0.27 | 0.27 | 0.27 | 0.27 | 0.27 | 0.27 | 0.27 |
Month | Jan | Feb | Mar | Apr | May | June | July | Aug | Sep | Oct | Nov | Dec |
|---|---|---|---|---|---|---|---|---|---|---|---|---|
P (at latitude 8) | 0.26 | 0.27 | 0.27 | 0.28 | 0.28 | 0.28 | 0.28 | 0.28 | 0.28 | 0.27 | 0.26 | 0.26 |
Jan | Feb | Mar | Apr | May | June | July | Aug | Sep | Oct | Nov | Dec | |
|---|---|---|---|---|---|---|---|---|---|---|---|---|
mean | 0.522 | 0.783 | 1.716 | 2.836 | 2.363 | 3.643 | 7.691 | 8.170 | 4.572 | 0.636 | 0.479 | 0.234 |
med | 0.00 | 0.089 | 1.458 | 2.97 | 2.368 | 3.597 | 7.545 | 8.026 | 4.750 | 0.232 | 0.157 | 0.000 |
Plants | Kc | Area b/n plants (m2) | Eto (mm/d) | Etc (m/d) | Qtot (m3/d) |
|---|---|---|---|---|---|
Deciduous tree | 0.73 | 12.5 | 5.3 | 0.00387 | 0.048363 |
Olive tree | 0.6 | 12.5 | 5.3 | 0.00318 | 0.03975 |
Dire dawa tree | 0.58 | 12.5 | 5.3 | 0.00307 | 0.038425 |
Month | Jan | Feb | Mar | Apr | May | June | July | Aug | Sep | Oct | Nov | Dec |
|---|---|---|---|---|---|---|---|---|---|---|---|---|
T min | 12.3 | 14.6 | 17.6 | 17.3 | 15.8 | 18.5 | 17.7 | 17.4 | 15.7 | 14.5 | 14.6 | 12.2 |
T max | 29.2 | 29.4 | 32.0 | 27.0 | 51.3 | 30.4 | 24.5 | 23.9 | 27.9 | 26.1 | 25.9 | 25.8 |
T mean | 20.7 | 22.0 | 24.8 | 22.1 | 33.6 | 24.4 | 21.1 | 20.6 | 21.8 | 20.3 | 20.3 | 19.0 |
P | 0.264 | 0.27 | 0.27 | 0.28 | 0.28 | 0.286 | 0.286 | 0.28 | 0.28 | 0.27 | 0.264 | 0.264 |
ET0 (mm/d) | 4.63 | 4.89 | 5.24 | 5.09 | 6.56 | 5.50 | 5.06 | 4.90 | 5.05 | 4.68 | 4.57 | 4.42 |
KC | 0.60 | 0.60 | 0.60 | 0.60 | 0.60 | 0.60 | 0.60 | 0.60 | 0.60 | 0.60 | 0.60 | 0.60 |
ETC (mm/m) | 83.4 | 88.1 | 94.3 | 91.6 | 118.2 | 99.0 | 91.2 | 88.2 | 90.9 | 84.3 | 82.3 | 79.5 |
RF (mm/m) | 16.2 | 21.9 | 53.2 | 85.1 | 73.2 | 109.3 | 238.4 | 253.3 | 137.1 | 19.7 | 14.4 | 7.2 |
plant no | 23000 | 23000 | 23000 | 23000 | 23000 | 23000 | 23000 | 23000 | 23000 | 23000 | 23000 | 23000 |
Area (m2) | 12.5 | 12.5 | 12.5 | 12.5 | 12.5 | 12.5 | 12.5 | 12.5 | 12.5 | 12.5 | 12.5 | 12.5 |
Irrigation water Dm (mm/m) | 75.27 | 77.14 | 67.67 | 49.10 | 81.53 | 44.39 | 0 | 0 | 22.34 | 74.43 | 75.10 | 75.92 |
Qtotal (m3)or Ig | 21641.28 | 22176.71 | 19455.37 | 14116.99 | 23440.25 | 12760.9 | 0 | 0 | 6422.62 | 23398.02 | 21592.32 | 21825.87 |
AASTU | Addis Ababa Science and Technology University |
ArcGIS | Aeronautical Reconnaissance Coverage Geographic Information System |
EMA | Ethiopian Meteorology Agency |
ETc | Crop Evapotranspiration |
ETo | Reference Evapotranspiration |
GIS | Geographic Information Systems |
GSO | General Statistics Office |
Jan | Feb | Mar | Apr | May | June | July | Aug | Sep | Oct | Nov | Dec |
|---|---|---|---|---|---|---|---|---|---|---|---|
0.95 | 2.54 | 2.69 | 3.10 | 1.58 | 3.69 | 9.52 | 9.34 | 5.66 | 2.10 | 0.90 | 0.90 |
1.97 | 1.36 | 1.70 | 4.13 | 2.95 | 5.28 | 8.68 | 8.03 | 5.53 | 1.09 | 0.94 | 0.87 |
0.87 | 0.93 | 0.89 | 2.04 | 2.01 | 4.67 | 8.18 | 8.14 | 6.38 | 0.23 | 2.16 | 0.00 |
1.94 | 0.00 | 0.32 | 3.96 | 1.54 | 2.12 | 7.84 | 10.40 | 2.38 | 1.06 | 0.13 | 0.54 |
0.00 | 2.28 | 4.07 | 5.67 | 3.07 | 5.49 | 11.15 | 5.48 | 5.14 | 0.17 | 0.49 | 0.25 |
0.00 | 0.09 | 1.46 | 0.69 | 4.15 | 2.00 | 6.59 | 9.81 | 6.48 | 0.00 | 0.16 | 0.00 |
0.00 | 0.00 | 0.97 | 2.03 | 0.87 | 2.69 | 7.35 | 7.87 | 4.10 | 0.00 | 0.00 | 0.00 |
0.00 | 0.00 | 2.48 | 2.97 | 2.37 | 3.60 | 5.79 | 7.82 | 4.75 | 0.66 | 0.00 | 0.01 |
0.00 | 1.41 | 2.45 | 0.46 | 0.00 | 1.75 | 5.89 | 9.08 | 3.84 | 1.69 | 0.00 | 0.00 |
0.00 | 0.00 | 0.44 | 0.00 | 3.11 | 5.27 | 6.06 | 7.98 | 2.26 | 0.00 | 0.48 | 0.00 |
0.00 | 0.00 | 1.40 | 6.15 | 4.33 | 3.52 | 7.55 | 5.93 | 3.77 | 0.00 | 0.00 | 0.00 |
5.74 | 8.61 | 18.87 | 31.20 | 25.99 | 38.58 | 84.60 | 89.87 | 50.29 | 6.99 | 5.27 | 2.57 |
0.52 | 0.78 | 1.72 | 2.84 | 2.36 | 3.64 | 7.69 | 8.17 | 4.57 | 0.64 | 0.48 | 0.23 |
0.99 | 1.27 | 1.87 | 3.08 | 2.16 | 1.87 | 2.68 | 2.46 | 2.11 | 1.05 | 1.08 | 0.45 |
Length | width | Area | Internal area | area*1 | External Area | area*2 | Tot Area | Avg A | AtRF | ||||||
|---|---|---|---|---|---|---|---|---|---|---|---|---|---|---|---|
BLd | NS | L | W | L | w | ||||||||||
R (7) | 1 | 44.5 | 26 | 1139 | 13.8 | 9.15 | 126 | 252.5 | 6 | 4.2 | 25 | 50.4 | 937 | ||
2 | 44.4 | 26 | 1132 | 13.5 | 9.1 | 123 | 245.7 | 6.1 | 4.35 | 27 | 53.1 | 940 | 939 | 6575 | |
3 | 45 | 25 | 1143 | 13.6 | 9.25 | 126 | 251.6 | 6 | 4.1 | 25 | 49.2 | 941 | |||
4 | 44.3 | 26 | 1139 | 13.7 | 9 | 123 | 246.6 | 6 | 4 | 24 | 48 | 940 | |||
L (8) | 1 | 44.6 | 12 | 535.2 | 4 | 1.5 | 6 | 12 | 0 | 0 | 523 | ||||
2 | 45 | 12 | 535.5 | 4 | 1.3 | 5.2 | 10.4 | 0 | 0 | 525 | 524 | 4191 | |||
3 | 44.5 | 12 | 534 | 4.3 | 1.5 | 5.7 | 10.5 | 0 | 0 | 524 | |||||
W (14) | 1 | 36.4 | 33 | 1183 | 19.2 | 13.5 | 259 | 259.2 | 6.5 | 4 | 26 | 52 | |||
19 | 1.3 | 25 | 49.9 | 1026 | |||||||||||
2 | 35.9 | 33 | 1192 | 19 | 13.2 | 251 | 250.8 | 6.8 | 3.8 | 23 | 45 | ||||
19 | 1.3 | 24 | 47 | 1033 | |||||||||||
3 | 36.2 | 31 | 1122 | 18 | 12.9 | 232 | 232.2 | 6.4 | 3.5 | 24 | 48 | 1026 | 14366 | ||
0 | 0 | 0 | 18 | 1.25 | 24 | 47 | 985 | ||||||||
4 | 37 | 34 | 1240 | 19.4 | 14 | 272 | 271.6 | 7 | 3.75 | 23 | 45.8 | ||||
19 | 1.28 | 24 | 47 | 1061 | |||||||||||
Lib (3) | 1 | 56.1 | 37 | 2087 | |||||||||||
2 | 56 | 37 | 2089 | 2088 | 6264 | ||||||||||
CL (12) | 1 | 33.4 | 27 | 895.1 | 27.1 | 4.1 | 111 | 222.2 | 3.2 | 3.15 | 10 | 20.2 | 693 | ||
2 | 33.6 | 27 | 893.8 | 27 | 4.2 | 113 | 226.8 | 3.2 | 3.12 | 10 | 20 | 687 | |||
3 | 33.5 | 27 | 894.5 | 27.2 | 4 | 109 | 217.6 | 3.3 | 3 | 9.8 | 19.5 | 696 | 697 | 8363 | |
4 | 34 | 27 | 924.8 | 27.5 | 4.25 | 117 | 233.8 | 3.2 | 3.2 | 10 | 20.2 | 711 | |||
AT (4) | 1 | 43.2 | 15 | 643.7 | 4.8 | 4.2 | 20 | 40.3 | 684 | ||||||
2 | 43.1 | 15 | 646.5 | 4.7 | 4 | 19 | 37.6 | 684 | 684 | 2052 | |||||
LT (7) | 1 | 27.6 | 15 | 416.8 | 17 | 6 | 99 | 99 | 516 | ||||||
2 | 27.5 | 15 | 418 | 16 | 6.2 | 102 | 102 | 520 | 518 | 3624 | |||||
Lab (5) | 1 | 28 | 12 | 324.8 | 12 | 4 | 46 | 92.8 | |||||||
20 | 14.7 | 288 | 576 | ||||||||||||
15 | 10.5 | 152 | 305 | 649 | |||||||||||
2 | 28 | 12 | 330.4 | 11 | 4.5 | 50 | 99 | ||||||||
19 | 14.6 | 282 | 564 | 324 | 1622 | ||||||||||
15 | 10.6 | 155 | 310 | 642 | |||||||||||
MT (6) | 1 | 29 | 15 | 437.9 | |||||||||||
2 | 29 | 15 | 440.8 | 439.4 | 2636 | ||||||||||
CF (3) | 1 | 48.7 | 32 | 1580 | 1580 | 4741 | |||||||||
CT (7) | 1 | 15.6 | 15 | 238.7 | |||||||||||
2 | 15.5 | 15 | 237.2 | 237.4 | 1662 | ||||||||||
3 | 15.6 | 15 | 236.4 | ||||||||||||
Lau (10) | 1 | 13.4 | 12 | 163.5 | |||||||||||
2 | 13.5 | 12 | 163.4 | 162.8 | 1628 | ||||||||||
3 | 13.7 | 12 | 161.7 | ||||||||||||
C (3) | radius | rad | |||||||||||||
1 | 12.4 | 3.1 | 482.8 | ||||||||||||
2 | 12.5 | 3.1 | 490.6 | 486.7 | 1460 | ||||||||||
Mw (2) | 1 | 45.6 | 26 | 1186 | 1186 | 2371 | |||||||||
year | Jan | Feb | Apr | May | June | July | Aug | Sep | Oct | Nov | Dec | sum |
|---|---|---|---|---|---|---|---|---|---|---|---|---|
2006 | 0.00 | 0.00 | 0.00 | 0.00 | 1.75 | 5.79 | 5.48 | 2.26 | 0.00 | 0.00 | 0.00 | 5.74 |
2007 | 0.00 | 0.00 | 0.46 | 0.87 | 2.00 | 5.89 | 5.93 | 2.38 | 0.00 | 0.00 | 0.00 | 8.61 |
2008 | 0.00 | 0.00 | 0.69 | 1.54 | 2.12 | 6.06 | 7.82 | 3.77 | 0.00 | 0.00 | 0.00 | 31.20 |
2009 | 0.00 | 0.00 | 2.03 | 1.58 | 2.69 | 6.59 | 7.87 | 3.84 | 0.00 | 0.00 | 0.00 | 25.99 |
2010 | 0.00 | 0.00 | 2.04 | 2.01 | 3.52 | 7.35 | 7.98 | 4.10 | 0.17 | 0.13 | 0.00 | 40/07 |
2011 | 0.00 | 0.09 | 2.97 | 2.37 | 3.60 | 7.55 | 8.03 | 4.75 | 0.23 | 0.16 | 0.00 | 84.60 |
2012 | 0.00 | 0.93 | 3.10 | 2.95 | 3.69 | 7.84 | 8.14 | 5.14 | 0.66 | 0.48 | 0.01 | 89.87 |
2013 | 0.87 | 1.36 | 3.96 | 3.07 | 4.67 | 8.18 | 9.08 | 5.53 | 1.06 | 0.49 | 0.25 | 50.29 |
2014 | 0.95 | 1.41 | 4.13 | 3.11 | 5.27 | 8.68 | 9.34 | 5.66 | 1.09 | 0.90 | 0.54 | 6.99 |
2015 | 1.94 | 2.28 | 5.67 | 4.15 | 5.28 | 9.52 | 9.81 | 6.38 | 1.69 | 0.94 | 0.87 | 5.27 |
2016 | 1.97 | 2.54 | 6.15 | 4.33 | 5.49 | 11.15 | 10.40 | 6.48 | 2.10 | 2.16 | 0.90 | 2.57 |
mean | 0.52 | 0.78 | 2.84 | 2.36 | 3.64 | 7.69 | 8.17 | 4.57 | 0.64 | 0.48 | 0.23 | 31.92 |
med | 0.00 | 0.09 | 2.97 | 2.37 | 3.60 | 7.55 | 8.03 | 4.75 | 0.23 | 0.16 | 0.00 | 29.75 |
GIS (m2) | Measured (m2) | |
|---|---|---|
®-1 | 989.9912 | 937.06 |
®-2 | 961.1096 | 939.57 |
®-3 | 986.1535 | 940.6 |
®-4 | 952.2154 | 939.91 |
(L)-1 | 489.7866 | 523.2 |
(L)-2 | 474.5807 | 525.1 |
(L)-3 | 518.0995 | 523.5 |
(W)-1 | 973.9228 | 780.82 |
(W)-2 | 1097.238 | 780.82 |
(CT)-1 | 257.9339 | 238.68 |
(CT)-2 | 264.1241 | 237.15 |
(CT)-3 | 483.0348 | 236.36 |
(CF)-1 | 1570.403 | 1580.315 |
(CL)-1 | 257.9339 | 693.06 |
(CL)-2 | 264.1241 | 686.928 |
(CL)-3 | 483.0348 | 696.35 |
(AT)-1 | 644.9455 | 684 |
(AT)-2 | 655.488 | 684.1 |
(LT)-1 | 481.7134 | 614.76 |
(LT-2) | 488.8686 | 621.36 |
(MT)-1 | 429.1614 | 437.9 |
(MT)-2 | 459.2833 | 440.8 |
©-1 | 257.9339 | 480.81 |
©-2 | 264.1241 | 490.625 |
(Lab)-1 | 554.01341 | 648.74 |
(Lab)-2 | 497.95144 | 641.68 |
(Lib)-1 | 2246.371 | 2086.92 |
(Lib)-2 | 2271.984 | 2088.8 |
(Lau)-1 | 148.2076 | 163.48 |
(Lau)-2 | 155.3525 | 163.35 |
(Lau)-3 | 159.6115 | 161.66 |
(Mw)-1 | 1185.741 | 1256.96 |
R. N | Type | shape length | GISA (m2) | ||||||||
|---|---|---|---|---|---|---|---|---|---|---|---|
1 | (Lib)-1 | 191.2201 | 2246.371 | 31 | (W)-12 | 218.6802 | 933.4523 | 61 | (CT)-7 | 85.22457 | 436.8803 |
2 | (Lib)-2 | 191.6275 | 2271.984 | 32 | (W)-13 | 240.8009 | 963.6937 | 62 | (MT)-1 | 86.15216 | 429.1614 |
3 | (Lib)-3 | 192.16726 | 2257.623 | 33 | (W)-14 | 238.2044 | 1019.249 | 63 | (MT)-2 | 89.27046 | 459.2833 |
4 | (C)-1 | 82.084494 | 481.6573 | 34 | (L)-1 | 111.43 | 489.7866 | 64 | (MT)-3 | 93.30134 | 507.4882 |
5 | (C)-2 | 77.265187 | 438.7756 | 35 | (L)-2 | 112.0924 | 474.5807 | 65 | (MT)-4 | 87.73398 | 430.3558 |
6 | (C)-3 | 86.884574 | 589.142 | 36 | (L)-3 | 114.3008 | 518.0995 | 66 | (MT)-5 | 88.48456 | 457.0365 |
7 | (R)-1 | 225.52296 | 989.9912 | 37 | (L)-4 | 131.5234 | 669.8871 | 67 | (MT)-6 | 92.9885 | 499.0285 |
8 | (R)-2 | 241.24276 | 961.1096 | 38 | (L)-5 | 166.8979 | 1065.645 | 68 | (LT)-3 | 97.81527 | 544.3116 |
9 | (R)-3 | 229.89705 | 986.1535 | 39 | (L)-6 | 91.59983 | 398.9222 | 69 | (LT)-1 | 94.4786 | 481.7134 |
10 | (R)-4 | 237.13486 | 952.2154 | 40 | (L)-7 | 86.4952 | 361.7626 | 70 | (LT)-2 | 94.11391 | 488.8686 |
11 | (R)-5 | 238.80607 | 911.7084 | 41 | (L)-8 | 119.0793 | 576.6507 | 71 | (LT)-4 | 95.821716 | 488.00339 |
12 | (R)-6 | 242.19049 | 997.0607 | 42 | (Lau)-1 | 49.1759 | 148.2076 | 72 | (LT)-5 | 66.34447 | 239.41281 |
13 | (R)-7 | 246.55709 | 1004.525 | 43 | (Lau)-2 | 50.21239 | 155.3525 | 73 | (LT)-6 | 121.91445 | 779.91639 |
14 | (AT)-1 | 118.98633 | 644.9455 | 44 | (Lau)-3 | 50.67253 | 159.6115 | 74 | (LT)-7 | 103.42772 | 607.61888 |
15 | (AT)-2 | 122.91925 | 655.488 | 45 | (Lau)-4 | 64.60034 | 257.3866 | 75 | (Lab)-1 | 111.64659 | 554.01341 |
16 | (AT)-3 | 118.51212 | 655.9171 | 46 | (Lau)-5 | 52.38267 | 171.2589 | 76 | (Lab)-2 | 108.87459 | 497.95144 |
17 | (AT)-4 | 124.86545 | 707.9665 | 47 | (Lau)-6 | 63.57732 | 250.8794 | 77 | (Lab)-3 | 121.02697 | 704.78225 |
18 | (Mw)-1 | 147.1473 | 1185.741 | 48 | (Lau)-7 | 62.1317 | 240.8813 | 78 | (Lab)-4 | 114.28365 | 575.35789 |
19 | (Mw)-2 | 175.581 | 1601.695 | 49 | (Lau)-8 | 45.2145 | 126.835 | 79 | (Lab)-5 | 100.34921 | 469.64129 |
20 | (W)-1 | 218.6371 | 973.9228 | 50 | (Lau)-9 | 52.49583 | 170.2777 | 80 | (CL)-1 | 194.29035 | 734.38871 |
21 | (W)-2 | 221.7639 | 1097.238 | 51 | (Lau)-10 | 53.31835 | 177.0784 | 81 | (CL)-2 | 196.61837 | 795.67598 |
22 | (W)-3 | 225.7623 | 985.0242 | 52 | (CF)-1 | 162.5199 | 1570.403 | 82 | (CL)-3 | 196.25423 | 799.51836 |
23 | (W)- 4 | 237.3093 | 1094.501 | 53 | (CF)-2 | 221.9545 | 1276.438 | 83 | (CL)-4 | 210.69589 | 772.40761 |
24 | (W)-5 | 227.6591 | 981.6288 | 54 | (CF)-3 | 169.5866 | 1721.172 | 84 | (CL)-5 | 207.3078 | 772.40938 |
25 | (W)-6 | 223.3794 | 834.1333 | 55 | (CT)-1 | 64.26235 | 257.9339 | 85 | (CL)-6 | 219.98418 | 912.35979 |
26 | (W)-7 | 215.7528 | 827.1607 | 56 | (CT)-2 | 65.13307 | 264.1241 | 86 | (CL)-7 | 210.73302 | 859.20152 |
27 | (W)-8 | 215.0695 | 840.118 | 57 | (CT)-3 | 89.85337 | 483.0348 | 87 | (CL)-8 | 264.25343 | 1233.2891 |
28 | (W)-9 | 221.0157 | 937.8437 | 58 | (CT)-4 | 90.41393 | 493.3863 | 88 | (CL)-9 | 256.2666 | 1236.14 |
29 | (W)-10 | 228.213 | 1002.325 | 59 | (CT)-5 | 87.19588 | 452.3934 | 89 | (CL)-10 | 251.4571 | 1202.743 |
30 | (W)-11 | 215.7331 | 820.6643 | 60 | (CT)-6 | 63.14444 | 248.2622 | 90 | (CL)-11 | 210.048 | 852.1713 |
91 | (CL)-12 | 216.234 | 934.1595 | ||||||||
Total Area | 67786.56 | ||||||||||
No | GIS (m2)=Y | X=Y/0.9448 | No | GIS (m2)=Y | X=Y/0.9448 | No | GIS (m2)=Y | X=Y/0.9448 |
|---|---|---|---|---|---|---|---|---|
1 | 2246.37 | 2259.93 | 31 | 933.45 | 939.09 | 61 | 436.88 | 439.52 |
2 | 2271.98 | 2285.70 | 32 | 963.69 | 969.51 | 62 | 429.16 | 431.75 |
3 | 2257.62 | 2271.25 | 33 | 1019.25 | 1025.40 | 63 | 459.28 | 462.06 |
4 | 481.66 | 484.56 | 34 | 489.79 | 492.74 | 64 | 507.49 | 510.55 |
5 | 438.78 | 441.42 | 35 | 474.58 | 477.45 | 65 | 430.36 | 432.95 |
6 | 589.14 | 592.70 | 36 | 518.10 | 521.23 | 66 | 457.04 | 459.80 |
7 | 989.99 | 995.97 | 37 | 669.89 | 673.93 | 67 | 499.03 | 502.04 |
8 | 961.11 | 966.91 | 38 | 1065.65 | 1072.08 | 68 | 544.31 | 547.60 |
9 | 986.15 | 992.11 | 39 | 398.92 | 401.33 | 69 | 481.71 | 484.62 |
10 | 952.22 | 957.96 | 40 | 361.76 | 363.95 | 70 | 488.87 | 491.82 |
11 | 911.71 | 917.21 | 41 | 576.65 | 580.13 | 71 | 488.00 | 490.95 |
12 | 997.06 | 1003.08 | 42 | 148.21 | 149.10 | 72 | 239.41 | 240.86 |
13 | 1004.53 | 1010.59 | 43 | 155.35 | 156.29 | 73 | 779.92 | 784.62 |
14 | 644.95 | 648.84 | 44 | 159.61 | 160.57 | 74 | 607.62 | 611.29 |
15 | 655.49 | 659.44 | 45 | 257.39 | 258.94 | 75 | 554.01 | 557.36 |
16 | 655.92 | 659.88 | 46 | 171.26 | 172.29 | 76 | 497.95 | 500.96 |
17 | 707.97 | 712.24 | 47 | 250.88 | 252.39 | 77 | 704.78 | 709.04 |
18 | 1185.74 | 1192.90 | 48 | 240.88 | 242.34 | 78 | 575.36 | 578.83 |
19 | 1601.70 | 1611.36 | 49 | 126.84 | 127.60 | 79 | 469.64 | 472.48 |
20 | 973.92 | 979.80 | 50 | 170.28 | 171.31 | 80 | 734.39 | 738.82 |
21 | 1097.24 | 1103.86 | 51 | 177.08 | 178.15 | 81 | 795.68 | 800.48 |
22 | 985.02 | 990.97 | 52 | 1570.40 | 1579.88 | 82 | 799.52 | 804.34 |
23 | 1094.50 | 1101.11 | 53 | 1276.44 | 1284.14 | 83 | 772.41 | 777.07 |
24 | 981.63 | 987.55 | 54 | 1721.17 | 1731.56 | 84 | 772.41 | 777.07 |
25 | 834.13 | 839.17 | 55 | 257.93 | 259.49 | 85 | 912.36 | 917.87 |
26 | 827.16 | 832.15 | 56 | 264.12 | 265.72 | 86 | 859.20 | 864.39 |
27 | 840.12 | 845.19 | 57 | 483.03 | 485.95 | 87 | 1233.29 | 1240.73 |
28 | 937.84 | 943.50 | 58 | 493.39 | 496.36 | 88 | 1236.14 | 1243.60 |
29 | 1002.33 | 1008.38 | 59 | 452.39 | 455.12 | 89 | 1202.74 | 1210.00 |
30 | 933.45 | 939.09 | 60 | 248.26 | 249.76 | 90 | 852.17 | 857.32 |
91 | 934.16 | 939.80 | ||||||
sum | 67786.56 | 68195.74 |
| [1] | UNESCO, United Nations World Water Assessment Programme, The United Nations World Water Development Report, 2023. |
| [2] | UNICEF, WHO/UNICEF, Progress on Household Drinking Water, Sanitation and Hygiene 2021, Geneva: World Health Organization., 2021. |
| [3] | WHO, World Health Organization, Water-related diseases, WHO Fact Sheet, 2020. |
| [4] | Fewkes, The use of rainwater for potable supply: Water quality and health risks,” Water and Environment Journal, vol. 24, no. 1, pp. 20-29, 2010. |
| [5] | R. water,, A Review of Roof and Pond Rainwater Harvesting Systems for Water. (2020). Water, 12(11), 3163. |
| [6] | B. R. Sharma, Rooftop rainwater harvesting for water conservation and environmental management. Environmental Management Journal, 12(2), 112-118., 1988. |
| [7] | F. N. Gazeta., Ethiopian Water Resources Management Proclamation No. 197/2000. Federal Negarit Gazeta., 2000. |
| [8] | UNEP, United Nations Environment Programme (UNEP), State of the World’s Freshwater Resources, Nairobi, 2023. |
| [9] | W. i. Data, A look at global freshwater distribution and how we can save it., World Economic Forum., 2023. |
| [10] | T. G. a. J. L. M. Rahman, Recent advances in rooftop rainwater harvesting systems: A review,” Journal of Sustainable Water Systems, vol. 13, no. 1, pp. 45-61, 2024. |
| [11] | E. M. Institute, Ethiopian Meteorological Institute, Climate Summary Report for Addis Ababa: 2022-2023,, Addis Ababa:: EMI Publications, 2023. |
| [12] |
C.-D. (n.d.), Retrieved from
https://en.climate-data.org/africa/ethiopia/addis-ababa/addis-abeba-532/ Addis Abeba Climate (Ethiopia), 2024. |
| [13] | N. Okello and R. M. Chemweno, Assessing rooftop rainwater harvesting potential using Google Earth Pro and ArcGIS in urban Uganda,” Journal of Water and Environment Technology, vol. 8, no. 1, pp. 15-27, 2025. |
| [14] | Lemma and A. Bekele, Comparative analysis of evapotranspiration estimation methods in semi-arid regions of Ethiopia,” Journal of Agricultural Water Management, vol. 14, no. 1, pp. 22-35, 2023. |
| [15] | G. Teshome and L. Mekonnen, Short-term rainfall variability and its implications for urban rainwater harvesting in Addis Ababa,” Journal of Urban Hydrology, vol. 11, no. 2, pp. 34-45, 2023. |
| [16] | M. Abebe and F. Tesfaye, Evaluating statistical methods for rainfall trend analysis: Mean vs. median approaches in long-term planning,” Ethiopian Journal of Climate Research, vol. 5, no. 1, pp. 12-26, 2024. |
APA Style
Godana, J. B., Gobezu, G. T., Wondafrash, T. W., Demeku, S. (2025). Rooftop Rain Water Potential Assessment for Non-domestic Use: A Case of Addis Ababa Science and Technology University. International Journal of Energy and Environmental Science, 10(4), 55-72. https://doi.org/10.11648/j.ijees.20251004.11
ACS Style
Godana, J. B.; Gobezu, G. T.; Wondafrash, T. W.; Demeku, S. Rooftop Rain Water Potential Assessment for Non-domestic Use: A Case of Addis Ababa Science and Technology University. Int. J. Energy Environ. Sci. 2025, 10(4), 55-72. doi: 10.11648/j.ijees.20251004.11
@article{10.11648/j.ijees.20251004.11,
  author = {Jatani Bonaya Godana and Getahun Tadesse Gobezu and Tilahun Woldslassie Wondafrash and Sisay Demeku},
  title = {Rooftop Rain Water Potential Assessment for Non-domestic Use: A Case of Addis Ababa Science and Technology University
},
  journal = {International Journal of Energy and Environmental Science},
  volume = {10},
  number = {4},
  pages = {55-72},
  doi = {10.11648/j.ijees.20251004.11},
  url = {https://doi.org/10.11648/j.ijees.20251004.11},
  eprint = {https://article.sciencepublishinggroup.com/pdf/10.11648.j.ijees.20251004.11},
  abstract = {This study investigates the efficacy of rooftop rainwater harvesting (RWH) at Addis Ababa Science and Technology University (AASTU) as a sustainable water and energy conservation strategy. The research aims to optimize water resource allocation by prioritizing harvested rainwater for non-domestic applications, thereby reducing pressure on conventional domestic water supplies. Utilizing ground measurements and ArcGIS spatial analysis, the total rooftop catchment area was quantified as 68,195.74 m2. Annual harvestable rainwater potential, derived from Ethiopian Meteorology Agency (EMA) rainfall data (Akaki station), was estimated at 662,273.4 m3. Concurrently, irrigation demand for AASTU’s landscaping—calculated through crop water requirement assessments and standardized crop coefficients was determined to be 184,830.33 m3/year. The results demonstrate a substantial surplus of harvestable rainwater, underscoring RWH’s viability in meeting institutional non-potable demands. These findings advocate for rooftop RWH systems as a critical component of integrated water management strategies, offering a scalable model to mitigate resource scarcity in urban academic environments. The study provides actionable insights for policymakers and institutional stakeholders to advance sustainable water stewardship practices.},
 year = {2025}
}
TY  - JOUR
T1  - Rooftop Rain Water Potential Assessment for Non-domestic Use: A Case of Addis Ababa Science and Technology University

AU  - Jatani Bonaya Godana
AU  - Getahun Tadesse Gobezu
AU  - Tilahun Woldslassie Wondafrash
AU  - Sisay Demeku
Y1  - 2025/07/21
PY  - 2025
N1  - https://doi.org/10.11648/j.ijees.20251004.11
DO  - 10.11648/j.ijees.20251004.11
T2  - International Journal of Energy and Environmental Science
JF  - International Journal of Energy and Environmental Science
JO  - International Journal of Energy and Environmental Science
SP  - 55
EP  - 72
PB  - Science Publishing Group
SN  - 2578-9546
UR  - https://doi.org/10.11648/j.ijees.20251004.11
AB  - This study investigates the efficacy of rooftop rainwater harvesting (RWH) at Addis Ababa Science and Technology University (AASTU) as a sustainable water and energy conservation strategy. The research aims to optimize water resource allocation by prioritizing harvested rainwater for non-domestic applications, thereby reducing pressure on conventional domestic water supplies. Utilizing ground measurements and ArcGIS spatial analysis, the total rooftop catchment area was quantified as 68,195.74 m2. Annual harvestable rainwater potential, derived from Ethiopian Meteorology Agency (EMA) rainfall data (Akaki station), was estimated at 662,273.4 m3. Concurrently, irrigation demand for AASTU’s landscaping—calculated through crop water requirement assessments and standardized crop coefficients was determined to be 184,830.33 m3/year. The results demonstrate a substantial surplus of harvestable rainwater, underscoring RWH’s viability in meeting institutional non-potable demands. These findings advocate for rooftop RWH systems as a critical component of integrated water management strategies, offering a scalable model to mitigate resource scarcity in urban academic environments. The study provides actionable insights for policymakers and institutional stakeholders to advance sustainable water stewardship practices.
VL  - 10
IS  - 4
ER  -
Faculty of Engineering and Technology, Department of Hydraulic and Water Resources Engineering, Dilla University, Dilla, Ethiopia
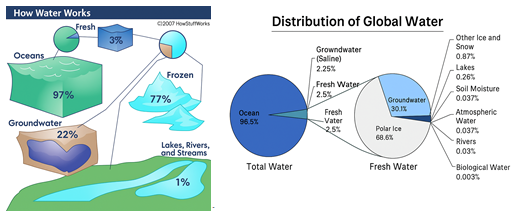
Figure 1. Distribution of global water.
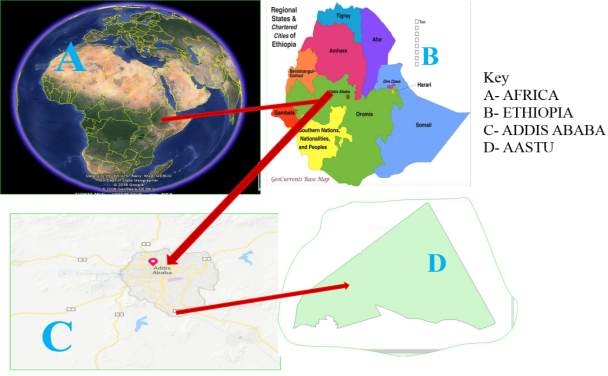
Figure 2. Addis Ababa Science Technology University location map.
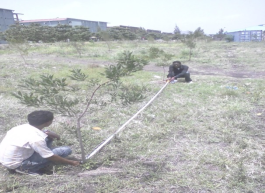
Figure 3. Measurement of distance between plants.
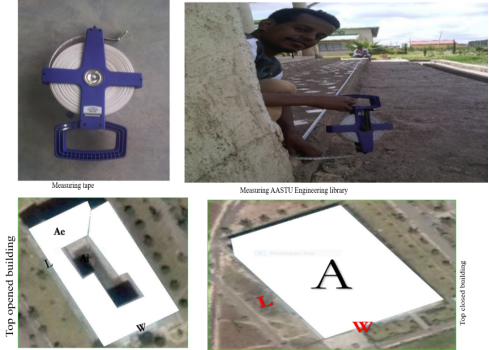
Figure 4. Measuring AASTU building’s roof top area by using ground area method and different shapes of building.
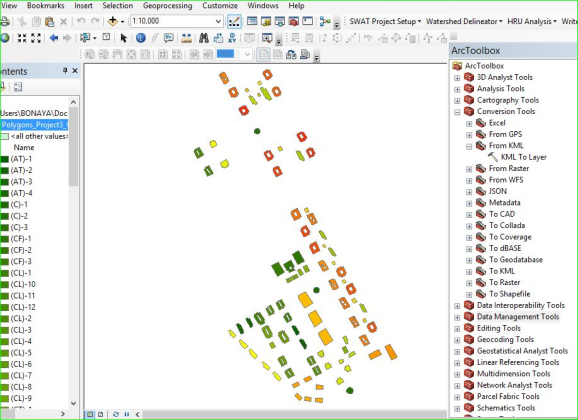
Figure 5. Google Earth delineated ArcGIS application process.
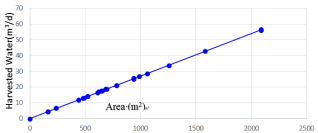
Figure 6. Rooftop potential versus area.
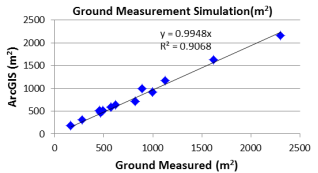
Figure 7. Ground area simulation and trend line equation.
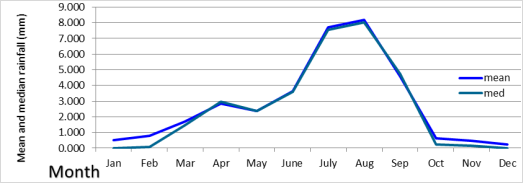
Figure 8. Mean and Median monthly rainfall at Akaki Area.
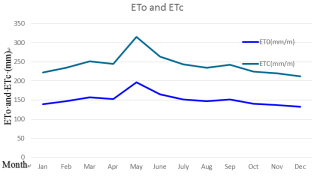
Figure 9. Monthly Crop water requirements verse reference evapotranspiration.
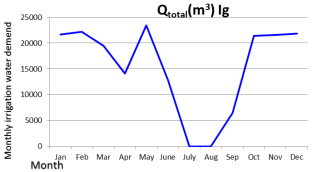
Figure 10. AASTU Monthly gross irrigation water demand.
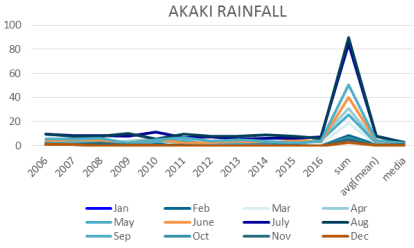
Figure 11. Akaki high and low yearly average rainfall of eleven-year graph.
Information

