The purpose of this research was to evaluate the noise pollution level in different zones of Barisal City. 7 different zones and 56 locations were selected in Barisal City based on land use. We tracked the noise levels in Barisal City using a sound level meter (REED SD-4023) from January 01, 2021, to April 30, 2021. Multiple samples were collected from each sampling site. The noise level at each location has been recorded three times per day. The Leq was determined to be 95.18 dBA, and the mean noise level was 73.86 dBA. Furthermore, the Leq and mean noise levels in Silent, Mixed, Residential, Commercial, Industrial, Road Intersection, and Village Area were 76.57 dBA and 65.48 dBA, 82.17 dBA and 75.36 dBA, 88.10 dBA and 72.35 dBA, 97.28 dBA and 69.39 dBA, 84.13 dBA and 71.89 dBA, 82.08 dBA and 71.89 dBA, and 92.69 dBA and 69.79 dBA, respectively. The hierarchy in various land uses based on mean noise level was Mixed Area > Residential Area > Industrial Area and Road Intersection > Village Area > Commercial Area > Silent Area. The three highest noise-polluted areas were Khansons Textile Ltd. (109.68 dBA), Barisal Bus Terminal (106.82 dBA), and Kaladema (101.24 dBA), whereas the three lowest noise-polluted areas were Sadar Road (59.24 dBA), Guthia Mosjid (67.35 dBA), and Jahanara Israil School and College (69.62 dBA), based on Leq. Nonetheless, we noted that the noise levels surpassed the National Standard Level at all sites examined in this study.
| Published in | International Journal of Sustainable Development Research (Volume 11, Issue 3) |
| DOI | 10.11648/j.ijsdr.20251103.13 |
| Page(s) | 166-179 |
| Creative Commons |
This is an Open Access article, distributed under the terms of the Creative Commons Attribution 4.0 International License (http://creativecommons.org/licenses/by/4.0/), which permits unrestricted use, distribution and reproduction in any medium or format, provided the original work is properly cited. |
| Copyright |
Copyright © The Author(s), 2025. Published by Science Publishing Group |
Noise Pollution, Land Use, Noise Standard, Barisal City, Bangladesh
Land Use (N) | Mean | Minimum | Maximum | Standard Deviation | Range | Median |
|---|---|---|---|---|---|---|
Silent Area (9) | 65.48 | 48.00 | 98.30 | 9.35 | 50.30 | 64.50 |
Mixed Area (9) | 75.36 | 50.50 | 117.80 | 8.44 | 67.30 | 75.20 |
Residential Area (6) | 72.35 | 50.70 | 101.80 | 9.72 | 51.10 | 72.50 |
Commercial Area (10) | 69.39 | 39.60 | 129.00 | 12.12 | 89.40 | 71.40 |
Industrial Area (10) | 71.89 | 63.66 | 94.39 | 11.02 | 30.73 | 71.95 |
Road Intersection (4) | 71.89 | 44.00 | 128.70 | 11.08 | 84.70 | 72.10 |
Village Area (8) | 69.79 | 47.70 | 109.10 | 9.12 | 61.40 | 69.70 |
Overall (56) | 73.86 | 52.30 | 102.30 | 13.31 | 50.00 | 71.40 |
(I) Land Use | (J) Land Use | Mean Difference (I-J) | Standard Error | Sig. |
|---|---|---|---|---|
Silent Area | Mixed Areas | -9.8755* | 0.28415 | .000 |
Residential Area | -6.8636* | 0.29511 | .000 | |
Commercial Area | -3.9032* | 0.2787 | .000 | |
Industrial Area | -6.4097* | 0.27861 | .000 | |
Road Intersection | -4.3099* | 0.3672 | .000 | |
Village Area | -8.3763* | 0.30034 | .000 | |
Mixed Areas | Silent Area | 9.8755* | 0.28415 | .000 |
Residential Area | 3.0119* | 0.29659 | .000 | |
Commercial Area | 5.9723* | 0.28026 | .000 | |
Industrial Area | 3.4657* | 0.28018 | .000 | |
Road Intersection | 5.5656* | 0.36839 | .000 | |
Village Area | 1.4992* | 0.30179 | .000 | |
Residential Area | Silent Area | 6.8636* | 0.29511 | .000 |
Mixed Areas | -3.0119* | 0.29659 | .000 | |
Commercial Area | 2.9604* | 0.29137 | .000 | |
Industrial Area | 0.4538 | 0.29128 | 0.119 | |
Road Intersection | 2.5537* | 0.3769 | .000 | |
Village Area | -1.5127* | 0.31213 | .000 | |
Commercial Area | Silent Area | 3.9032* | 0.2787 | .000 |
Mixed Areas | -5.9723* | 0.28026 | .000 | |
Residential Area | -2.9604* | 0.29137 | .000 | |
Industrial Area | -2.5065* | 0.27464 | .000 | |
Road Intersection | -0.4067 | 0.3642 | 0.264 | |
Village Area | -4.4731* | 0.29666 | .000 | |
Industrial Area | Silent Area | 6.4097* | 0.27861 | .000 |
Mixed Areas | -3.4657* | 0.28018 | .000 | |
Residential Area | -0.4538 | 0.29128 | 0.119 | |
Commercial Area | 2.5065* | 0.27464 | .000 | |
Road Intersection | 2.0998* | 0.36413 | .000 | |
Village Area | -1.9666* | 0.29658 | .000 | |
Road Intersection | Silent Area | 4.3099* | 0.3672 | .000 |
Mixed Areas | -5.5656* | 0.36839 | .000 | |
Residential Area | -2.5537* | 0.3769 | .000 | |
Commercial Area | 0.4067 | 0.3642 | 0.264 | |
Industrial Area | -2.0998* | 0.36413 | .000 | |
Village Area | -4.0664* | 0.38101 | 0 | |
Village Area | Silent Area | 8.3763* | 0.30034 | 0 |
Mixed Areas | -1.4992* | 0.30179 | 0 | |
Residential Area | 1.5127* | 0.31213 | 0 | |
Commercial Area | 4.4731* | 0.29666 | 0 | |
Industrial Area | 1.9666* | 0.29658 | 0 | |
Road Intersection | 4.0664* | 0.38101 | 0 |
Land Use (N) | Location | Standard (day time) | Within Standard (%) |
|---|---|---|---|
Silent Area (9) | Jahanara Israil School and College | 50 | 80% |
BM College Barisal | 0% | ||
Sher-E-Bangla Medical | 0% | ||
General Hospital Barisal | 0% | ||
Guthia Mosjid | 20% | ||
Government Hatem Ali College | 0% | ||
Barisal Zilla School | 0% | ||
Barisal University | 0% | ||
Barisal Cadet College | 0% | ||
Mean | 11.11% | ||
Mixed Areas (9) | Kownia Bilic Road | 60 | 27.38% |
Puranpara Tower | 0% | ||
Sotobotia Word 3 | 0% | ||
Nogor Bovon | 0% | ||
Ruptoli | 0% | ||
Rajbari Vasani Sarak | 0% | ||
Ray Road | 0% | ||
Port Road Bazar | 19.05% | ||
Chawk Bazar Road | 53.57% | ||
Mean | 11.11% | ||
Residential Area (6) | Kownia | 55 | 0% |
Kashipur | 0% | ||
Ruptoli Housing State | 47.56% | ||
Housing Sarak | 0% | ||
Mokbul Engineer Len | 52.44% | ||
Alekkanda Bangla Bazar | 0% | ||
Mean | 17% | ||
Commercial Area (10) | Barisal River Port BIWTA | 70 | 1.44% |
Planet Park | 0.5% | ||
Girjamohalla | 10.63% | ||
Bibir Digir Par | 15.01% | ||
Barisal Bus Tarminal | 6.75% | ||
30 Godaun | 0.43% | ||
Sadar Road | 21.41% | ||
Kalibari Road | 17.17% | ||
Sho-Road | 18.68% | ||
Balur Ghat | 7.97% | ||
Mean | 10% | ||
Industrial Area (10) | Chemist Laboratories | 75 | 14.29% |
Bengal Food Industry | 10.51% | ||
Fortune Shoes | 8.25% | ||
Khansons Textile Ltd | 2.31% | ||
Amrito Food Products | 15.2% | ||
A H Khan and Company Ltd | 2.6% | ||
M E P Company | 11.19% | ||
Meghna Petroliam Ltd. | 12.3% | ||
Repcho Pharmaceuticals | 14.35% | ||
Bahumukhi Sawmill | 9.27% | ||
Mean | 10.03% | ||
All Mean | 11.85% | ||
AC | Alternating Current |
BIWTA | Bangladesh Inland Water Transport Authority |
CA | Commercial Area |
CAPS | Center for Atmospheric Pollution Studies |
CNG | Compressed Natural Gas |
dBA | A-weighted Decibel |
DoE | Department of Environment |
GB | Gigabyte |
GIS | Geographic Information System |
Govt. | Government |
IA | Industrial Area |
Leq | Equivalent Continuous Sound Pressure Level |
Ltd | Limited |
MA | Mixed Areas |
MAX | Maximum |
MBM | Madina Bricks Manufacturing |
MIN | Minimum |
N | Number (in Terms of Quantity) |
NIHL | Noise-Induced Hearing Loss |
PC | Personal Computer |
RA | Residential Area |
REC | Record |
RIS | Road Intersections |
SA | Silent Area |
SD | Secure Digital |
Sig | Significant |
SPSS | Statistical Package for the Social Sciences |
VA | Village Area |
WHO | World Health Organization |
| [1] | Islam R, Sultana A, Reja MS, Seddique AA, Hossain MR. Multidimensional analysis of road traffic noise and probable public health hazards in Barisal city corporation, Bangladesh. Heliyon. 2024; 10(15): 1-17. |
| [2] | Islam Z, Abdullah F, Khanom M. Evaluation of traffic accessibility condition and noise pollution in Dhaka City of Bangladesh. Am J Traffic Transport Engineer 2021; 6(2): 43-51. |
| [3] | Rao PR, Rao MGS. Community Reaction to Road Traffic Noise. Applied Acoustics. 1992; 37: 51-64. |
| [4] | United Nations Environment Programme (UNEP). Frontiers 2022: Noise, Blazes and Mismatches – Emerging Issues of Environmental Concern. Nairobi: UNEP; 2022. |
| [5] | Emran MGI, Mahmud S, Khan AH, Bristy NN, Das AK, Barma R, Barma A, Mita MH, Bosunia L, Rahman M, Roy M. Factors Influencing Stress Levels Among Students: A Virtual Exploration. European Journal of Medical and Health Sciences. 2024 Dec 7;6(6):67-75. |
| [6] | Alam MJB, Rauf, AFMA, Ahmed, MF. Traffic induced noise pollution in Dhaka City. J Civil Engineer 2001; 29(1): 1-9. |
| [7] | Wongsurakiat P, Maranetra KN, Nana A, Naruman C, Aksornint M, Chalermsanyakorn T. Respiratory symptoms and pulmonary function of traffic policemen in Thonburi. J Med Assoc Thailand Chotmaihet Thangphaet 1999; 82(5): 435-43. |
| [8] | Karita K, Yano E, Jinsart W, Boudoung D, Tamura K. Respiratory symptoms and pulmonary function among traffic police in Bangkok, Thailand. Arch Environ Health 2001; 56(5): 467-70. |
| [9] | Shrestha I. Health effects of vehicular noise pollution on traffic police personnel in Kathmandu. Dissertation. Kolkata: Department of Environment Science, St Xavier’s College, 1998. |
| [10] | Shakya S. Health problems prevalent in the traffic police personnel due to vehicular air pollution in Kathmandu. Dissertation. Kathmandu: St Xavier’s College, 2001. |
| [11] | Tamura K, Jinsart W, Yano E, Karita K, Boudoung D. Particulate air pollution and chronic respiratory symptoms among traffic policemen in Bangkok. Arch Environ Health 2003; 58(4): 201-7. |
| [12] | DeToni A, Finotto L. Respiratory diseases in a group of traffic police officers: Results of a 5-year follow-up. Giornale Italiano Med Lavoro Ergonomia 2005; 27(3): 380-2. |
| [13] | Tripathi SR, Tiwari RR. Self-reported hearing quality of traffic policemen: A questionnaire-based study. Indian J Occupat Environ Med 2006; 10(2): 82-4. |
| [14] | Majumder AK. Noise induced hearing quality assessments of traffic police personnel in Dhaka City. J Environ Pollut Human Health 2018; 6(4): 121-5. |
| [15] | Majumder AK, Bhuiyan, ML, Akter, S. Status of noise pollution in different silent zone of Lalmatia residential area of Dhaka City. J SUB 2016; 6(1): 81–91. |
| [16] | Majumder AK. Health impact assessment of noise pollution on traffic policemen of Kathmandu Valley, Nepal. Stamford J Environ Hum Habitat 2012; 1: 120–32. |
| [17] | Majumder AK, Rauniyar R, Carter WS, Khanal SN, Bajracharya RM, Joshi SK. Noise induced hearing loss of Kathmandu valley traffic police: A self reported occupational health study. Bangladesh J Environ Sci 2010; 18: 77-82. |
| [18] | World Health Organization. The world health report 2002: Reducing risks, promoting healthy life. Geneva: World Health Organization, 2002. |
| [19] | Nandi SS, Dhatrak SV. Occupational noise-induced hearing loss in India. Indian J Occupat Environ Med 2008; 12(2): 53-6. |
| [20] | National Institute for Occupational Safety and Health. Criteria for a recommended standard: Occupational noise exposure. Cincinnati, OH: National Institute for Occupational Safety and Health, 1998. |
| [21] | World Health Organization. Occupational and community noise. Geneva: World Health Organization, 2001. |
| [22] | Islam, KMN, Majumder AK, Biswas, JD, Paul, B. Assessment of citizens perception towards traffic noise induced hearing loss in Dhaka City. Stamford J Civil Engineer 2011; 3(1): 22-30. |
| [23] | Berger EH, Royster LH, Rozster JD, Driscoll DP, Layne M, eds. The noise manual, 5th ed. Fairfax, VA: American Industrial Hygiene Association, 2000. |
| [24] | Goelzer B, Hansen CH, Sehrndt GA, eds. Occupational exposure to noise: Evaluation, prevention and control. Geneva: World Health Organization, 2001. |
| [25] | Murthy VK, Majumder AK, Khanal SN, Subedi DP. Assessment of traffic noise pollution in Banepa, a semi urban town of Nepal. Kathmandu Univ J Sci Engineer Technol 2007; 3(2): 12-20. |
| [26] | Bluhm G, Nordling E, Berglind N. Road traffic noise and annoyance: An increasing environmental health problem. Noise Health 2004; 6(24): 43-9. |
| [27] | Meijer H, Knipschild P, Sallé H. Road traffic noise annoyance in Amsterdam. Int Arch Occupat Environ Health 1985; 56: 285-97. |
| [28] | Ouis D. Annoyance caused by exposure to road traffic noise: An update. Noise Health 2002; 4(15): 69-79. |
| [29] | Öhrström E. Longitudinal surveys on effects of changes in road traffic noise—annoyance, activity disturbances, and psycho-social well-being. J Acoust Soc Am 2004; 115(2): 719-29. |
| [30] | De Hollander AE, van Kempen EE, Houthuijs DJ, Van Kamp I, Hoogenveen RT, Staatsen BA. Environmental noise: an approach for estimating health impacts at national and local level. Geneva: World Health Organization, 2004. |
| [31] | Majumder AK, Jilani MG. Assessing the Noise Pollution Level in Cumilla District Town, Bangladesh. GSC Advanced Research and Reviews 2025;23(3):204-217. |
| [32] | Majumder AK, Bhuiyan MTA. Assessing the Extent of Noise Pollution in Laxmipur District Town, Bangladesh. International Journal of Environmental Monitoring and Analysis 2025;13(2): 61-73. |
| [33] | Environmental Conservation Rules. Dhaka: Ministry of Environment and Forest, Government of the People’s Republic of Bangladesh, 2006. |
APA Style
Majumder, A. K., Ullah, M. A., Shiddiqua, S. (2025). Evaluation of Noise Pollution in Barisal, a Coastal City of Bangladesh. International Journal of Sustainable Development Research, 11(3), 166-179. https://doi.org/10.11648/j.ijsdr.20251103.13
ACS Style
Majumder, A. K.; Ullah, M. A.; Shiddiqua, S. Evaluation of Noise Pollution in Barisal, a Coastal City of Bangladesh. Int. J. Sustain. Dev. Res. 2025, 11(3), 166-179. doi: 10.11648/j.ijsdr.20251103.13
@article{10.11648/j.ijsdr.20251103.13,
  author = {Ahmad Kamruzzaman Majumder and Md Ahsan Ullah and Shifat Shiddiqua},
  title = {Evaluation of Noise Pollution in Barisal, a Coastal City of Bangladesh
},
  journal = {International Journal of Sustainable Development Research},
  volume = {11},
  number = {3},
  pages = {166-179},
  doi = {10.11648/j.ijsdr.20251103.13},
  url = {https://doi.org/10.11648/j.ijsdr.20251103.13},
  eprint = {https://article.sciencepublishinggroup.com/pdf/10.11648.j.ijsdr.20251103.13},
  abstract = {The purpose of this research was to evaluate the noise pollution level in different zones of Barisal City. 7 different zones and 56 locations were selected in Barisal City based on land use. We tracked the noise levels in Barisal City using a sound level meter (REED SD-4023) from January 01, 2021, to April 30, 2021. Multiple samples were collected from each sampling site. The noise level at each location has been recorded three times per day. The Leq was determined to be 95.18 dBA, and the mean noise level was 73.86 dBA. Furthermore, the Leq and mean noise levels in Silent, Mixed, Residential, Commercial, Industrial, Road Intersection, and Village Area were 76.57 dBA and 65.48 dBA, 82.17 dBA and 75.36 dBA, 88.10 dBA and 72.35 dBA, 97.28 dBA and 69.39 dBA, 84.13 dBA and 71.89 dBA, 82.08 dBA and 71.89 dBA, and 92.69 dBA and 69.79 dBA, respectively. The hierarchy in various land uses based on mean noise level was Mixed Area > Residential Area > Industrial Area and Road Intersection > Village Area > Commercial Area > Silent Area. The three highest noise-polluted areas were Khansons Textile Ltd. (109.68 dBA), Barisal Bus Terminal (106.82 dBA), and Kaladema (101.24 dBA), whereas the three lowest noise-polluted areas were Sadar Road (59.24 dBA), Guthia Mosjid (67.35 dBA), and Jahanara Israil School and College (69.62 dBA), based on Leq. Nonetheless, we noted that the noise levels surpassed the National Standard Level at all sites examined in this study.},
 year = {2025}
}
TY  - JOUR
T1  - Evaluation of Noise Pollution in Barisal, a Coastal City of Bangladesh

AU  - Ahmad Kamruzzaman Majumder
AU  - Md Ahsan Ullah
AU  - Shifat Shiddiqua
Y1  - 2025/07/14
PY  - 2025
N1  - https://doi.org/10.11648/j.ijsdr.20251103.13
DO  - 10.11648/j.ijsdr.20251103.13
T2  - International Journal of Sustainable Development Research
JF  - International Journal of Sustainable Development Research
JO  - International Journal of Sustainable Development Research
SP  - 166
EP  - 179
PB  - Science Publishing Group
SN  - 2575-1832
UR  - https://doi.org/10.11648/j.ijsdr.20251103.13
AB  - The purpose of this research was to evaluate the noise pollution level in different zones of Barisal City. 7 different zones and 56 locations were selected in Barisal City based on land use. We tracked the noise levels in Barisal City using a sound level meter (REED SD-4023) from January 01, 2021, to April 30, 2021. Multiple samples were collected from each sampling site. The noise level at each location has been recorded three times per day. The Leq was determined to be 95.18 dBA, and the mean noise level was 73.86 dBA. Furthermore, the Leq and mean noise levels in Silent, Mixed, Residential, Commercial, Industrial, Road Intersection, and Village Area were 76.57 dBA and 65.48 dBA, 82.17 dBA and 75.36 dBA, 88.10 dBA and 72.35 dBA, 97.28 dBA and 69.39 dBA, 84.13 dBA and 71.89 dBA, 82.08 dBA and 71.89 dBA, and 92.69 dBA and 69.79 dBA, respectively. The hierarchy in various land uses based on mean noise level was Mixed Area > Residential Area > Industrial Area and Road Intersection > Village Area > Commercial Area > Silent Area. The three highest noise-polluted areas were Khansons Textile Ltd. (109.68 dBA), Barisal Bus Terminal (106.82 dBA), and Kaladema (101.24 dBA), whereas the three lowest noise-polluted areas were Sadar Road (59.24 dBA), Guthia Mosjid (67.35 dBA), and Jahanara Israil School and College (69.62 dBA), based on Leq. Nonetheless, we noted that the noise levels surpassed the National Standard Level at all sites examined in this study.
VL  - 11
IS  - 3
ER  -
Department of Environmental Science, Stamford University Bangladesh, Dhaka, Bangladesh. Center for Atmospheric Pollution Studies (CAPS), Dhaka, Bangladesh
Department of Environmental Science, Stamford University Bangladesh, Dhaka, Bangladesh
Department of Botanical Science, BN Khan College, Barisal, Bangladesh
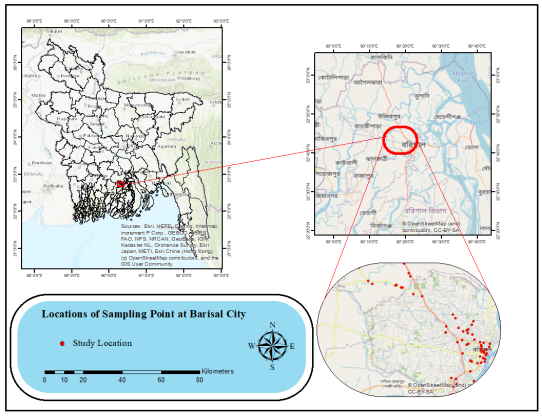
Figure 1. Sampling Points of Barisal City.
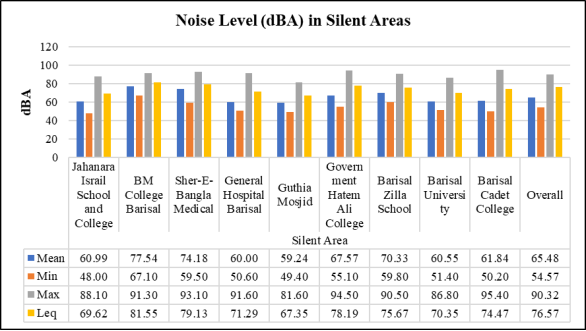
Figure 2. Noise Level (dBA) in Silent Area.
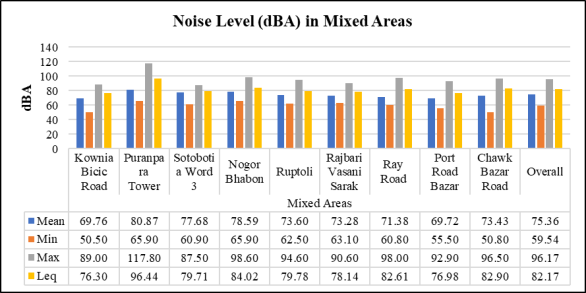
Figure 3. Noise Level (dBA) in Mixed Area.

Figure 4. Noise Level (dBA) in Residential Area.
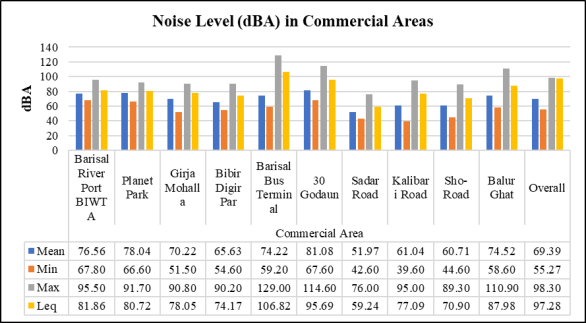
Figure 5. Noise level (dBA) in Commercial Area.
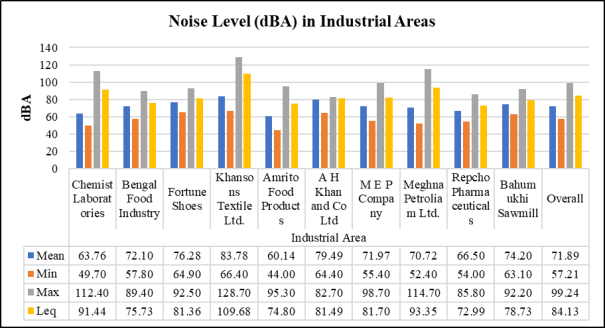
Figure 6. Noise Level (dBA) in Industrial Area.
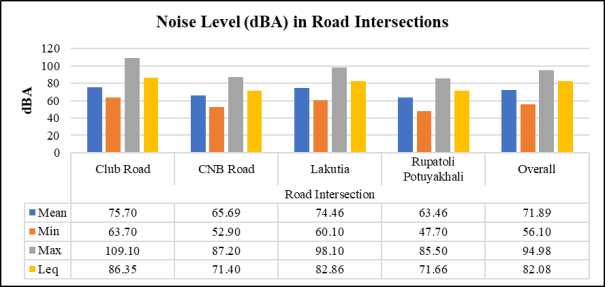
Figure 7. Noise Level (dBA) in Road Intersection.
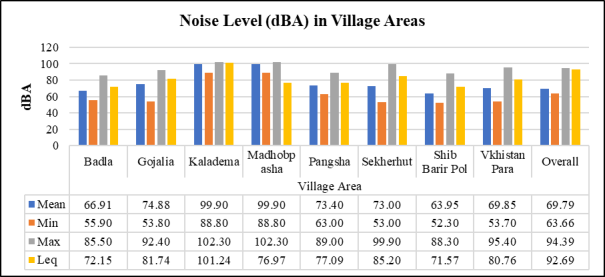
Figure 8. Noise Level (dBA) in Village Area.
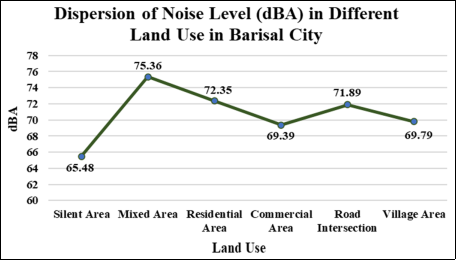
Figure 9. Dispersion of Noise Level (dBA) in Different Land Use in Barisal City.
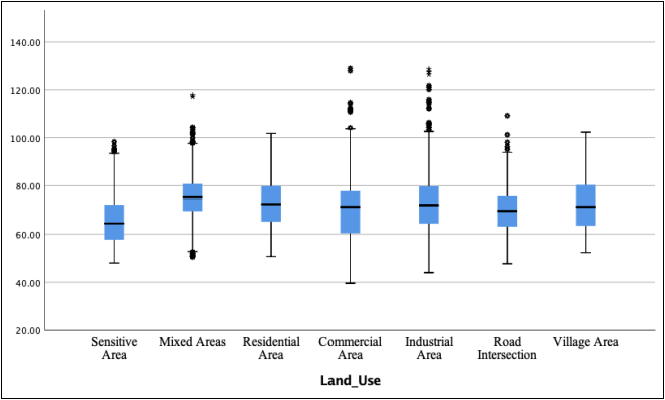
Figure 10. Mean Noise Pollution (dBA) in Barisal City.
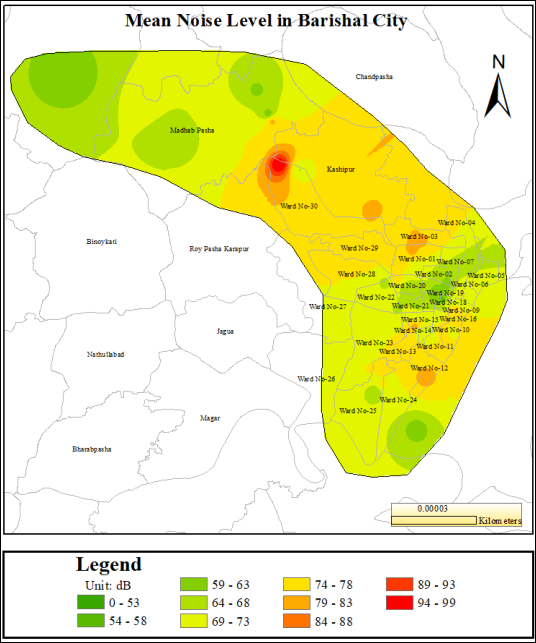
Figure 11. Spatial Map of Mean Noise Pollution.
Information

