The present research aims to evaluate the level of noise pollution in different regions in Sirajganj District Town. 7 distinct zones and 40 places were identified in Sirajganj District Town according to land use criteria. A sound level meter (REED SD-4023) was utilized to assess noise levels in Sirajganj District Town from January 1, 2021, to April 30, 2021. Multiple samples were taken at each sampling location. The noise levels were assessed regularly three times at each sampling site. The mean noise pollution level and Leq of Sirajganj District Town were found to be 73.42 dBA and 98.27 dBA, respectively. The recorded mean and Leq values were 73.61 dBA and 84.13 dBA for silent areas, 71.67 dBA and 105.35 dBA for residential areas, 73.51 dBA and 100.89 dBA for mixed areas, 71.52 dBA and 80.63 dBA for commercial areas, 74.91 dBA and 100.51 dBA for industrial areas, 73.93 dBA and 86.81 dBA for road intersections, and 74.81 dBA and 86.46 dBA for village areas, respectively. The hierarchy of various land uses according to mean noise levels is as follows: Industrial Area > Village Area > Road Intersection > Silent Area > Mixed Areas > Residential Area > Commercial Area. The three places with the greatest noise pollution levels were Jubil Building (109.32 dBA), Mowla Box Daal Mill (109 dBA), and Vasani Road (97.32 dBA). Conversely, the three areas with the lowest noise pollution levels were Sirajganj Bus Terminal (69.69 dBA), Masum Para (69.82 dBA), and DC Office (70.51 dBA), as determined by Leq. The study revealed that the noise levels at all sampling locations were above the national standard.
| Published in | International Journal of Sustainable and Green Energy (Volume 14, Issue 3) |
| DOI | 10.11648/j.ijsge.20251403.15 |
| Page(s) | 182-194 |
| Creative Commons |
This is an Open Access article, distributed under the terms of the Creative Commons Attribution 4.0 International License (http://creativecommons.org/licenses/by/4.0/), which permits unrestricted use, distribution and reproduction in any medium or format, provided the original work is properly cited. |
| Copyright |
Copyright © The Author(s), 2025. Published by Science Publishing Group |
Noise Pollution, Land Use, Cluster, Dispersion, Noise Standard, Sirajganj District Town, Bangladesh
Land Use (N) | Mean | Minimum | Maximum | Standard Deviation | Range | Median | Rank |
|---|---|---|---|---|---|---|---|
Silent Area (6) | 73.61 | 54.40 | 108.10 | 7.91 | 73.40 | 53.70 | 4 |
Residential Area (5) | 71.67 | 50.40 | 131.20 | 9.49 | 71.10 | 80.80 | 6 |
Mixed Areas (6) | 73.51 | 55.40 | 131.50 | 7.55 | 72.20 | 76.10 | 5 |
Commercial Area (7) | 71.52 | 54.80 | 105.70 | 8.06 | 71.10 | 50.90 | 7 |
Industrial Area (8) | 74.91 | 51.70 | 128.00 | 9.30 | 74.30 | 76.30 | 1 |
Road Intersection (5) | 73.93 | 52.50 | 112.50 | 10.01 | 74.10 | 60.00 | 3 |
Village Area (3) | 74.81 | 57.50 | 109.60 | 8.01 | 74.10 | 52.10 | 2 |
Overall (40) | 73.42 | 50.40 | 131.50 | 8.74 | 72.80 | 81.10 | - |
(I) Land Use | (J) Land Use | Mean Difference (I-J) | Standard Error | Sig. |
|---|---|---|---|---|
Silent Area | Residential Area | 1.9444* | 0.29344 | 0 |
Mixed Areas | 0.1037 | 0.26642 | 0.697 | |
Commercial Area | 2.0881* | 0.27331 | 0 | |
Industrial Area | -1.2990* | 0.26804 | 0 | |
Road Intersection | -0.3234 | 0.28705 | 0.26 | |
Village Area | -1.1977* | 0.35841 | 0.001 | |
Residential Area | Silent Area | -1.9444* | 0.29344 | 0 |
Mixed Areas | -1.8408* | 0.27993 | 0 | |
Commercial Area | 0.1437 | 0.28649 | 0.616 | |
Industrial Area | -3.2435* | 0.28147 | 0 | |
Road Intersection | -2.2679* | 0.29963 | 0 | |
Village Area | -3.1421* | 0.36855 | 0 | |
Mixed Areas | Silent Area | -0.1037 | 0.26642 | 0.697 |
Residential Area | 1.8408* | 0.27993 | 0 | |
Commercial Area | 1.9844* | 0.25875 | 0 | |
Industrial Area | -1.4027* | 0.25317 | 0 | |
Road Intersection | -0.4271 | 0.27322 | 0.118 | |
Village Area | -1.3014* | 0.34743 | 0 | |
Commercial Area | Silent Area | -2.0881* | 0.27331 | 0 |
Residential Area | -0.1437 | 0.28649 | 0.616 | |
Mixed Areas | -1.9844* | 0.25875 | 0 | |
Industrial Area | -3.3872* | 0.26041 | 0 | |
Road Intersection | -2.4116* | 0.27994 | 0 | |
Village Area | -3.2858* | 0.35274 | 0 | |
Industrial Area | Silent Area | 1.2990* | 0.26804 | 0 |
Residential Area | 3.2435* | 0.28147 | 0 | |
Mixed Areas | 1.4027* | 0.25317 | 0 | |
Commercial Area | 3.3872* | 0.26041 | 0 | |
Road Intersection | .9756* | 0.2748 | 0 | |
Village Area | 0.1013 | 0.34867 | 0.771 | |
Road Intersection | Silent Area | 0.3234 | 0.28705 | 0.26 |
Residential Area | 2.2679* | 0.29963 | 0 | |
Mixed Areas | 0.4271 | 0.27322 | 0.118 | |
Commercial Area | 2.4116* | 0.27994 | 0 | |
Industrial Area | -.9756* | 0.2748 | 0 | |
Village Area | -.8743* | 0.36349 | 0.016 | |
Village Area | Silent Area | 1.1977* | 0.35841 | 0.001 |
Residential Area | 3.1421* | 0.36855 | 0 | |
Mixed Areas | 1.3014* | 0.34743 | 0 | |
Commercial Area | 3.2858* | 0.35274 | 0 | |
Industrial Area | -0.1013 | 0.34867 | 0.771 | |
Road Intersection | .8743* | 0.36349 | 0.016 | |
Based on observed means: *The error term is Mean Square (Error) = 74835 * The mean difference is significant at the 0 | ||||
Land Use (N) | Location | Standard Value | Within Standard (%) |
|---|---|---|---|
Silent Area (6) | Civil Surgeon Office | 50 | 0.00% |
Collectorate School and College | 0.00% | ||
Officers’ Club | 0.00% | ||
Police Super Office | 0.00% | ||
Purto Building | 0.00% | ||
Terminal Jame Mosque | 0.00% | ||
Mean | 0.00% | ||
Residential Area (5) | Anower Building | 55 | 0.00% |
Jubil Building | 0.00% | ||
Masum Para | 4.91% | ||
Thana Para | 0.00% | ||
Vasani Road | 2.21% | ||
Mean | 1.42% | ||
Mixed Areas (6) | Apon Dental Surgery | 60 | 0.70% |
DC Office | 0.38% | ||
Sirajganj Head Post Office | 8.17% | ||
Sirajganj Police Station | 0.00% | ||
Zila Narcotics Control Office | 0.00% | ||
Zila Server Station | 0.00% | ||
Mean | 1.54% | ||
Commercial Area (7) | Bazar Station | 70 | 13.31% |
BRAC Office | 66.84% | ||
Powro New Super Market | 45.23% | ||
RFL | 1.53% | ||
Sirajganj Rail Station | 63.06% | ||
Sirajganj Bus Terminal | 82.05% | ||
Station Bazar | 23.30% | ||
Mean | 42.19% | ||
Industrial Area (8) | Ata Mill | 75 | 45.63% |
Hirajhil Flowers Mill | 37.54% | ||
M/S Himu dal Mill | 61.13% | ||
M/S Jamuna Flower Mill | 63.21% | ||
MA Daal Mill | 59.19% | ||
Mowla Box Daal Mill | 22.98% | ||
Rita Auto Rice Mill | 59.72% | ||
Roler Flower Mill | 81.28% | ||
Mean | 53.84% | ||
All Mean | 20.00% | ||
AC | Alternating Current |
CAPS | Center for Atmospheric Pollution Studies |
dBA | A-weighted Decibel |
DoE | Department of Environment |
GB | Gigabyte |
GIS | Geographic Information System |
Govt | Government |
Leq | Equivalent Continuous Sound Pressure Level |
Ltd | Limited |
MAX | Maximum |
MIN | Minimum |
N | Number (in Terms of Quantity) |
NIHL | Noise-induced Hearing Loss |
PC | Personal Computer |
REC | Record |
SD | Secure Digital |
SPSS | Statistical Package for the Social Sciences |
WHO | World Health Organization |
| [1] | Islam R, Sultana A, Reja MS, Seddique AA, Hossain MR. Multidimensional analysis of road traffic noise and probable public health hazards in Barisal city corporation, Bangladesh. Heliyon. 2024; 10(15): 1-17. |
| [2] | Islam Z, Abdullah F, Khanom M. Evaluation of traffic accessibility condition and noise pollution in Dhaka City of Bangladesh. Am J Traffic Transport Engineer 2021; 6(2): 43-51. |
| [3] | Rao PR, Rao MGS. Community Reaction to Road Traffic Noise. Applied Acoustics. 1992; 37: 51-64. |
| [4] | United Nations Environment Programme (UNEP). Frontiers 2022: Noise, Blazes and Mismatches - Emerging Issues of Environmental Concern. Nairobi: UNEP; 2022. |
| [5] | Emran MGI, Mahmud S, Khan AH, Bristy NN, Das AK, Barma R, Barma A, Mita MH, Bosunia L, Rahman M, Roy M. Factors Influencing Stress Levels Among Students: A Virtual Exploration. European Journal of Medical and Health Sciences. 2024 Dec 7; 6(6): 67-75. |
| [6] | Alam MJB, Rauf, AFMA, Ahmed, MF. Traffic induced noise pollution in Dhaka City. J Civil Engineer 2001; 29(1): 1-9. |
| [7] | Emran MGI, Ahmed KT, Khan AS, Rahman L, Momin MH, Das AK, Akter S, Saha M, Banerjee S, Ahmed T, Islam AFMM. Positive impacts of COVID-19 Lock down in Bangladesh: An online investigation. Heliyon. 2023; 9(10): 1-14. |
| [8] | Wongsurakiat P, Maranetra KN, Nana A, Naruman C, Aksornint M, Chalermsanyakorn T. Respiratory symptoms and pulmonary function of traffic policemen in Thonburi. J Med Assoc Thailand Chotmaihet Thangphaet 1999; 82(5): 435-43. |
| [9] | Karita K, Yano E, Jinsart W, Boudoung D, Tamura K. Respiratory symptoms and pulmonary function among traffic police in Bangkok, Thailand. Arch Environ Health 2001; 56(5): 467-70. |
| [10] | Shrestha I. Health effects of vehicular noise pollution on traffic police personnel in Kathmandu. Dissertation. Kolkata: Department of Environment Science, St Xavier’s College, 1998. |
| [11] | Shakya S. Health problems prevalent in the traffic police personnel due to vehicular air pollution in Kathmandu. Dissertation. Kathmandu: St Xavier’s College, 2001. |
| [12] | Tamura K, Jinsart W, Yano E, Karita K, Boudoung D. Particulate air pollution and chronic respiratory symptoms among traffic policemen in Bangkok. Arch Environ Health 2003; 58(4): 201-7. |
| [13] | DeToni A, Finotto L. Respiratory diseases in a group of traffic police officers: Results of a 5-year follow-up. Giornale Italiano Med Lavoro Ergonomia 2005; 27(3): 380-2. |
| [14] | Tripathi SR, Tiwari RR. Self-reported hearing quality of traffic policemen: A questionnaire-based study. Indian J Occupat Environ Med 2006; 10(2): 82-4. |
| [15] | Majumder AK. Noise induced hearing quality assessments of traffic police personnel in Dhaka City. J Environ Pollut Human Health 2018; 6(4): 121-5. |
| [16] | Majumder AK, Bhuiyan, ML, Akter, S. Status of noise pollution in different silent zone of Lalmatia residential area of Dhaka City. J SUB 2016; 6(1): 81-91. |
| [17] | Majumder AK. Health impact assessment of noise pollution on traffic policemen of Kathmandu Valley, Nepal. Stamford J Environ Hum Habitat 2012; 1: 120-32. |
| [18] | Majumder AK, Rauniyar R, Carter WS, Khanal SN, Bajracharya RM, Joshi SK. Noise induced hearing loss of Kathmandu valley traffic police: A self reported occupational health study. Bangladesh J Environ Sci 2010; 18: 77-82. |
| [19] | World Health Organization. The world health report 2002: Reducing risks, promoting healthy life. Geneva: World Health Organization, 2002. |
| [20] | Nandi SS, Dhatrak SV. Occupational noise-induced hearing loss in India. Indian J Occupat Environ Med 2008; 12(2): 53-6. |
| [21] | National Institute for Occupational Safety and Health. Criteria for a recommended standard: Occupational noise exposure. Cincinnati, OH: National Institute for Occupational Safety and Health, 1998. |
| [22] | World Health Organization. Occupational and community noise. Geneva: World Health Organization, 2001. |
| [23] | Islam, KMN, Majumder AK, Biswas, JD, Paul, B. Assessment of citizens perception towards traffic noise induced hearing loss in Dhaka City. Stamford J Civil Engineer 2011; 3(1): 22-30. |
| [24] | Berger EH, Royster LH, Rozster JD, Driscoll DP, Layne M, eds. The noise manual, 5th ed. Fairfax, VA: American Industrial Hygiene Association, 2000. |
| [25] | Goelzer B, Hansen CH, Sehrndt GA, eds. Occupational exposure to noise: Evaluation, prevention and control. Geneva: World Health Organization, 2001. |
| [26] | Murthy VK, Majumder AK, Khanal SN, Subedi DP. Assessment of traffic noise pollution in Banepa, a semi urban town of Nepal. Kathmandu Univ J Sci Engineer Technol 2007; 3(2): 12-20. |
| [27] | Bluhm G, Nordling E, Berglind N. Road traffic noise and annoyance: An increasing environmental health problem. Noise Health 2004; 6(24): 43-9. |
| [28] | Meijer H, Knipschild P, Sallé H. Road traffic noise annoyance in Amsterdam. Int Arch Occupat Environ Health 1985; 56: 285-97. |
| [29] | Ouis D. Annoyance caused by exposure to road traffic noise: An update. Noise Health 2002; 4(15): 69-79. |
| [30] | Öhrström E. Longitudinal surveys on effects of changes in road traffic noise-annoyance, activity disturbances, and psycho-social well-being. J Acoust Soc Am 2004; 115(2): 719-29. |
| [31] | De Hollander AE, van Kempen EE, Houthuijs DJ, Van Kamp I, Hoogenveen RT, Staatsen BA. Environmental noise: an approach for estimating health impacts at national and local level. Geneva: World Health Organization, 2004. |
| [32] | Majumder AK, Jilani MG. Assessing the Noise Pollution Level in Cumilla District Town, Bangladesh. GSC Advanced Research and Reviews. 2025; 23(3): 204-217. |
| [33] | Majumder AK, Bhuiyan MTA. Assessing the Extent of Noise Pollution in Laxmipur District Town, Bangladesh. International Journal of Environmental Monitoring and Analysis. 2025; 13(2): 61-73. |
| [34] | Majumder AK, Paul A, Ahamed MR. Assessment of Noise Pollution in Khulna City, Bangladesh. Am J Environ Sci Eng. 2025; 9(2): 86-97. |
| [35] | Majumder, AK, Mohammad, N. Evaluating the noise pollution levels in Feni District Town, Bangladesh. International Journal of Multidisciplinary Research and Development. 2025; 12(7): 52-60. |
| [36] | Majumder, AK, Sirajee, HMNH. Assessing the level of noise pollution in the town of Pabna, Bangladesh. International Journal of Academic Research and Development. 2025; 10(4): 13-21. |
| [37] | Majumder AK, Ullah MA, Shiddiqua S. Evaluation of Noise Pollution in Barisal, a Coastal City of Bangladesh. International Journal of Sustainable Development Research. 2025; 11(3): 166-179. |
| [38] | Environmental Conservation Rules. Dhaka: Ministry of Environment and Forest, Government of the People’s Republic of Bangladesh, 2006. |
APA Style
Kamruzzaman, A. M., Hossain, M. M., Hossain, T. (2025). Evaluating the Level of Noise Pollution in the Town of Sirajganj, Bangladesh. International Journal of Sustainable and Green Energy, 14(3), 182-194. https://doi.org/10.11648/j.ijsge.20251403.15
ACS Style
Kamruzzaman, A. M.; Hossain, M. M.; Hossain, T. Evaluating the Level of Noise Pollution in the Town of Sirajganj, Bangladesh. Int. J. Sustain. Green Energy 2025, 14(3), 182-194. doi: 10.11648/j.ijsge.20251403.15
@article{10.11648/j.ijsge.20251403.15,
  author = {Ahmad Majumder Kamruzzaman and Md. Masud Hossain and Tanjir Hossain},
  title = {Evaluating the Level of Noise Pollution in the Town of Sirajganj, Bangladesh
},
  journal = {International Journal of Sustainable and Green Energy},
  volume = {14},
  number = {3},
  pages = {182-194},
  doi = {10.11648/j.ijsge.20251403.15},
  url = {https://doi.org/10.11648/j.ijsge.20251403.15},
  eprint = {https://article.sciencepublishinggroup.com/pdf/10.11648.j.ijsge.20251403.15},
  abstract = {The present research aims to evaluate the level of noise pollution in different regions in Sirajganj District Town. 7 distinct zones and 40 places were identified in Sirajganj District Town according to land use criteria. A sound level meter (REED SD-4023) was utilized to assess noise levels in Sirajganj District Town from January 1, 2021, to April 30, 2021. Multiple samples were taken at each sampling location. The noise levels were assessed regularly three times at each sampling site. The mean noise pollution level and Leq of Sirajganj District Town were found to be 73.42 dBA and 98.27 dBA, respectively. The recorded mean and Leq values were 73.61 dBA and 84.13 dBA for silent areas, 71.67 dBA and 105.35 dBA for residential areas, 73.51 dBA and 100.89 dBA for mixed areas, 71.52 dBA and 80.63 dBA for commercial areas, 74.91 dBA and 100.51 dBA for industrial areas, 73.93 dBA and 86.81 dBA for road intersections, and 74.81 dBA and 86.46 dBA for village areas, respectively. The hierarchy of various land uses according to mean noise levels is as follows: Industrial Area > Village Area > Road Intersection > Silent Area > Mixed Areas > Residential Area > Commercial Area. The three places with the greatest noise pollution levels were Jubil Building (109.32 dBA), Mowla Box Daal Mill (109 dBA), and Vasani Road (97.32 dBA). Conversely, the three areas with the lowest noise pollution levels were Sirajganj Bus Terminal (69.69 dBA), Masum Para (69.82 dBA), and DC Office (70.51 dBA), as determined by Leq. The study revealed that the noise levels at all sampling locations were above the national standard.},
 year = {2025}
}
TY  - JOUR
T1  - Evaluating the Level of Noise Pollution in the Town of Sirajganj, Bangladesh

AU  - Ahmad Majumder Kamruzzaman
AU  - Md. Masud Hossain
AU  - Tanjir Hossain
Y1  - 2025/08/07
PY  - 2025
N1  - https://doi.org/10.11648/j.ijsge.20251403.15
DO  - 10.11648/j.ijsge.20251403.15
T2  - International Journal of Sustainable and Green Energy
JF  - International Journal of Sustainable and Green Energy
JO  - International Journal of Sustainable and Green Energy
SP  - 182
EP  - 194
PB  - Science Publishing Group
SN  - 2575-1549
UR  - https://doi.org/10.11648/j.ijsge.20251403.15
AB  - The present research aims to evaluate the level of noise pollution in different regions in Sirajganj District Town. 7 distinct zones and 40 places were identified in Sirajganj District Town according to land use criteria. A sound level meter (REED SD-4023) was utilized to assess noise levels in Sirajganj District Town from January 1, 2021, to April 30, 2021. Multiple samples were taken at each sampling location. The noise levels were assessed regularly three times at each sampling site. The mean noise pollution level and Leq of Sirajganj District Town were found to be 73.42 dBA and 98.27 dBA, respectively. The recorded mean and Leq values were 73.61 dBA and 84.13 dBA for silent areas, 71.67 dBA and 105.35 dBA for residential areas, 73.51 dBA and 100.89 dBA for mixed areas, 71.52 dBA and 80.63 dBA for commercial areas, 74.91 dBA and 100.51 dBA for industrial areas, 73.93 dBA and 86.81 dBA for road intersections, and 74.81 dBA and 86.46 dBA for village areas, respectively. The hierarchy of various land uses according to mean noise levels is as follows: Industrial Area > Village Area > Road Intersection > Silent Area > Mixed Areas > Residential Area > Commercial Area. The three places with the greatest noise pollution levels were Jubil Building (109.32 dBA), Mowla Box Daal Mill (109 dBA), and Vasani Road (97.32 dBA). Conversely, the three areas with the lowest noise pollution levels were Sirajganj Bus Terminal (69.69 dBA), Masum Para (69.82 dBA), and DC Office (70.51 dBA), as determined by Leq. The study revealed that the noise levels at all sampling locations were above the national standard.
VL  - 14
IS  - 3
ER  -
Department of Environmental Science, Stamford University Bangladesh, Dhaka, Bangladesh. Center for Atmospheric Pollution Studies (CAPS), Dhaka, Bangladesh
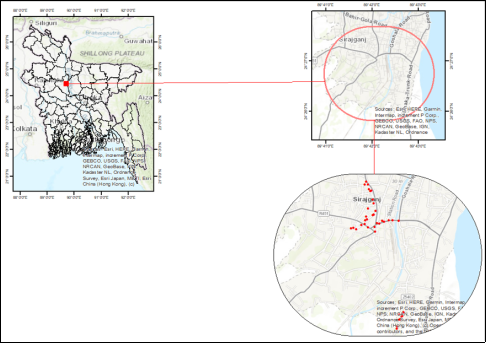
Figure 1. Study Area of Sirajganj District Town.
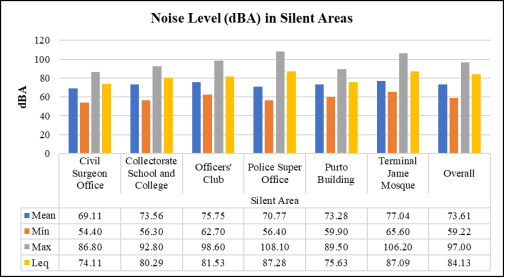
Figure 2. Noise Level (dBA) in Silent Areas.
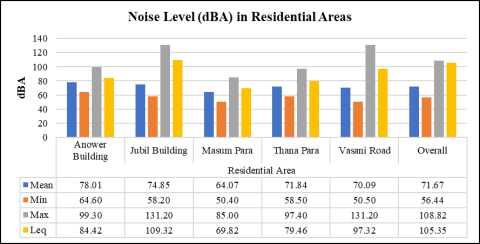
Figure 3. Noise Level (dBA) in Residential Areas.
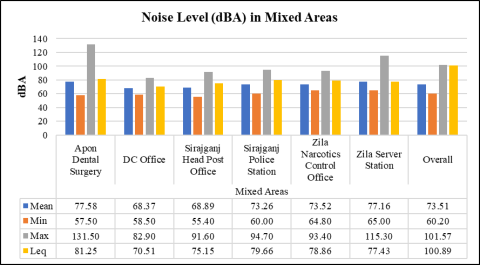
Figure 4. Noise Level (dBA) in Mixed Areas.
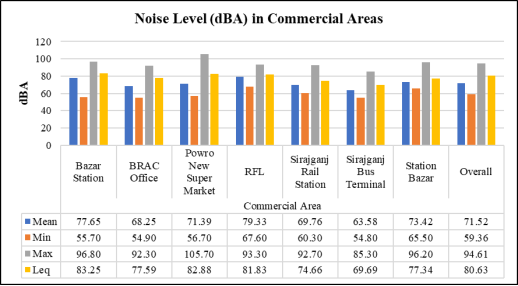
Figure 5. Noise Level (dBA) in Commercial Areas.
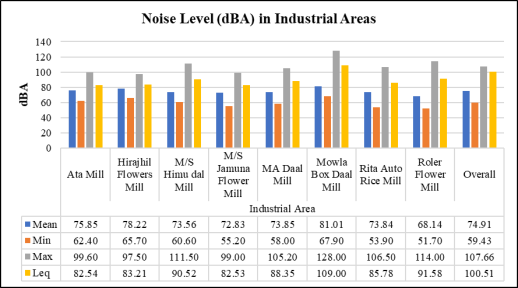
Figure 6. Noise Level (dBA) in Industrial Areas.
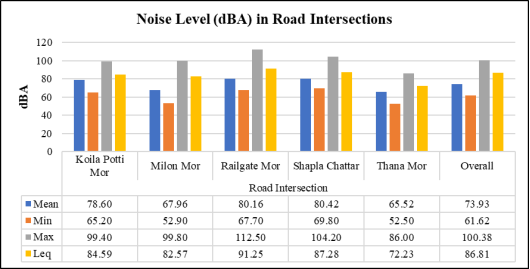
Figure 7. Noise Level (dBA) in Road Intersections.
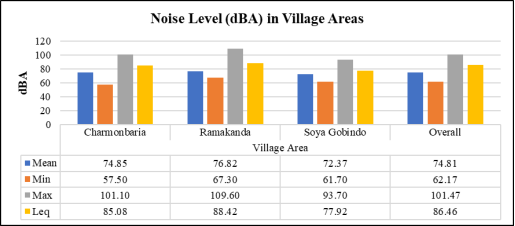
Figure 8. Noise Level (dBA) in Village Areas.
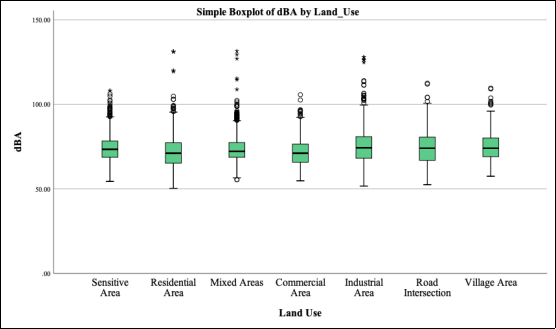
Figure 9. Mean Noise Pollution in Sirajganj District Town.
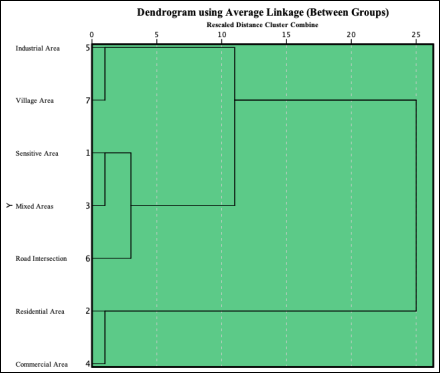
Figure 10. Land Use based Cluster, in Terms of dBA.
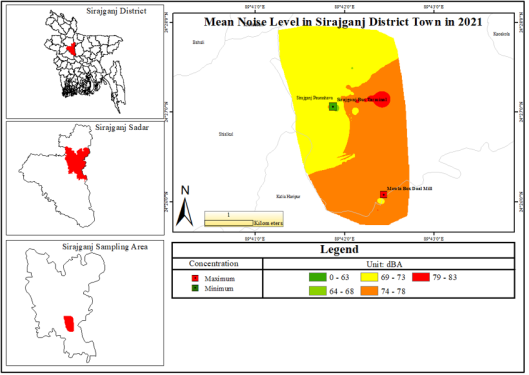
Figure 11. Spatial Map of Mean Noise Pollution.
Information

