Abstract
This study explores the relationship between health expenditure per capita, per capita income, and life expectancy in Ghana. Using annual time-series data from 2000 to 2022 provided by the World Development Indicators, the analysis examines variables such as life expectancy, per capita income, public health spending per capita, birth rate, employment-to-population ratio, CO2 emissions per capita, and the proportion of the population with access to safe drinking water and sanitation services. The study also reviews annual trends in life expectancy, per capita income, public health spending, and access to basic services. To analyze short- and long-term relationships among these variables, the research employs the Autoregressive Distributed Lag cointegration approach, preceded by a unit root test to determine stationarity. EViews software is used for the analysis, which includes graphical representations to illustrate trends. The results indicate a negative relationship between health expenditure per capita and life expectancy, while per capita income is positively associated with life expectancy. Cointegration is observed across all variables. Additionally, birth rate and access to sanitation services are positively related to life expectancy, whereas CO2 emissions per capita are negatively associated with it. The study recommends policies focusing on prioritizing health funding, efficient resource allocation, and strategies to increase individual incomes.
Keywords
Public Health Spending, Per Capita, Life Expectancy, Ghana, Autoregressive Distributed Lag, World Development Indicators
1. Introduction
In Ghana, the relationship between public health spending, per capita income, and life expectancy reveals key insights into the country’s healthcare system and socio-economic conditions. This relationship significantly influences the availability and quality of healthcare services accessible to the population.
. The government allocates resources to various health sectors such as infrastructure, personnel, and medical supplies to improve healthcare delivery nationwide. Adequate funding is essential to addressing public health challenges, including infectious diseases, maternal and child health, and non-communicable diseases
. According to the World Bank, Ghana has made strides in increasing its public health spending over the years, demonstrating a commitment to improving health outcomes across the country
. For instance, investments are directed towards expanding healthcare infrastructure, enhancing the availability of medical supplies, and strengthening healthcare systems to better respond to healthcare needs. Despite these efforts, challenges such as budget constraints, uneven distribution of resources, and varying healthcare access persist, influencing overall health outcomes in the country
| [23] | Mackenbach, J. P., Stirbu, I., & Roskam, A. J. R. (2015). Socioeconomic inequalities in health in 22 European countries. The New England Journal of Medicine, 358(23), 2327-2337. https://doi.org/10.1056/NEJMsa0707519 |
[23]
. Per-capita income on the other hand reflects the average income earned per person in the country over a specific time period. This is a fundamental economic prosperity indicator within a population and has been studied for its profound impact on life expectancy, an indicator of the average number of years a person is expected to live based on current mortality rates, life expectancy is a critical measure of overall population health and is influenced by factors such as healthcare access, disease burden, nutrition, sanitation, and socio-economic conditions
| [20] | Lynch, J., Smith, G. D., Kaplan, G. A., & House, J. S. (2017). Income inequality and health: The time has come to consider the context of the question. Journal of Health Politics, Policy and Law, 42(5), 1-11. https://doi.org/10.1215/03616878-4265174 |
[20]
. Improvement in life expectancy often reflects advancements in public health interventions, healthcare infrastructure, and socio-economic development. Quite a number of empirical studies and analyses have consistently highlighted a positive correlation between higher per-capita income levels and increased life expectancy across diverse global contexts
. Indeed, income plays a pivotal role in shaping health outcomes through various pathways. Firstly, higher income levels enable individuals and households to afford better healthcare services, including preventive care, diagnostic screenings, and treatments for chronic conditions
. Secondly, economic prosperity facilitates access to improved nutrition, sanitation, and housing conditions, which are essential determinants of health and longevity
| [6] | Case, A., & Deaton, A. (2015). Broken down by income group: A decade of stagnation in life expectancy in the United States. The Journal of Economic Perspectives, 29(4), 1-16. https://doi.org/10.1257/jep.29.4.1 |
[6]
. Moreover, increased income often correlates with higher levels of education and health literacy, empowering individuals to make informed decisions about their health behaviors and lifestyles
| [25] | Marmot, M., Allen, J., Goldblatt, P., Boyce, T., McNeish, D., Grady, M., & Geddes, I. (2012). Fair society, healthy lives: Strategic review of health inequalities in England post-2010. The Marmot Review. |
[25]
. Furthermore, the association between per-capita income and life expectancy underscores broader societal factors and policy implications. Countries with higher average incomes tend to invest more in healthcare infrastructure, public health programs, and social safety nets, thereby contributing to enhanced population health outcomes
. These investments not only improve access to healthcare services but also mitigate disparities in health outcomes across socio-economic groups, promoting more equitable health outcomes
| [27] | Preston, S. H. (1975). The changing relation between mortality and level of economic development. Population Studies, 29(2), 231-248. |
[27]
. However, despite the general trend of a positive correlation, nuances exist within different socio-economic contexts and regions. Disparities in income distribution and access to healthcare within populations can influence the extent to which economic prosperity translates into improved life expectancy for all segments of society
| [19] | Lynch, J. W., Smith, G. D., & Hillemeier, M. M. (2017). Income inequality, the psychosocial environment, and health: Comparisons of wealthy nations. Lancet, 340(8848), 1387-1393. https://doi.org/10.1016/S0140-6736(92)92221-M |
[19]
. Addressing these disparities through targeted policy interventions is crucial for achieving sustainable improvements in public health and ensuring that economic growth benefits everyone equally
| [8] | Case, A., & Deaton, A. (2015). The health effects of economic development: Evidence from the new international data. Princeton University Press. |
[8]
The interplay between public health spending, per-capita income and life expectancy is complex but interconnected. Increased public health spending can lead to enhanced healthcare infrastructure and services, contributing to improved health outcomes and potentially higher life expectancy rates. Moreover, higher per-capita income enables individuals to access better healthcare services, further contributing to improved life expectancy. Conversely, challenges such as inadequate funding, healthcare infrastructure deficiencies, and economic disparities can hinder progress in achieving better health outcomes. Therefore, understanding the dynamics between public health spending, per-capita income, and life expectancy rate in Ghana provides insights into the country's healthcare system's strengths, challenges, and opportunities for improvement
| [8] | Case, A., & Deaton, A. (2015). The health effects of economic development: Evidence from the new international data. Princeton University Press. |
[8]
.
The relationship between public health spending, per-capita income, and life expectancy rate is a crucial area of study in global health policy and development economics. In developing countries like Ghana, these factors interact in complex ways to influence population health outcomes. Public health spending refers to government investments in healthcare infrastructure, personnel, and services aimed at improving public health. Adequate funding is essential for addressing health challenges such as infectious diseases, maternal and child health, and non-communicable diseases
| [33] | World Health Organization (WHO). (2010). Social determinants of health. WHO Press. |
[33]
. Per-capita income, on the other hand, reflects the average income earned per person in a country. Higher per-capita income generally correlates with improved access to healthcare, better nutrition, and overall improved health outcomes
The life expectancy rate measures the average number of years a person is expected to live based on current mortality rates. It serves as an indicator of a population's overall health and well-being, influenced by factors such as healthcare access, disease burden, and socioeconomic conditions. The intersection of public health spending, per-capita income, and life expectancy rate in Ghana underscores critical aspects of the country's healthcare landscape and socio-economic development. Ghana, like many developing nations, faces significant challenges in balancing healthcare expenditure with economic resources, while striving to improve population health outcomes
| [7] | Case, A., & Deaton, A. (2015). Rising morbidity and mortality in midlife among white non-Hispanic Americans in the 21st century. Proceedings of the National Academy of Sciences, 112(49), 15078-15083. |
[7]
. Despite efforts to allocate resources towards public health, Ghana continues to grapple with disparities in healthcare access and outcomes across different socio-economic strata. The correlation between public health spending, per-capita income, and life expectancy rate remains underexplored within the Ghanaian context, despite its pivotal role in shaping health policies and interventions. This sets the stage to examine how variations in public health expenditure and income levels influence life expectancy outcomes in Ghana, aiming to provide insights that inform policy-makers and stakeholders on effective strategies for improving public health outcomes in the country
| [22] | Mackenbach, J. P., Kulhánová, I., Menvielle, G., Bopp, M., Borrell, C., Costa, G., & Deboosere, P. (2015). Trends in inequalities in premature mortality: A study of 3.2 million deaths in 13 European countries. Journal of Epidemiology and Community Health, 69(3), 207-217. |
[22].
This study seeks to investigate the effect of Government health expenditure and per-capita income on life expectancy rate in Ghana through addressing the following specific research objectives: to examine short run and long run effect of Government health expenditure on Life expectancy rate in Ghana, to estimate the short run and long run effect of per-capita income on life expectancy rate in Ghana, to conduct trend analysis of the Government health expenditure, per-capita income and life expectancy rate. Also, questions like what is the short and long run effect of Government health expenditure on Life expectancy rate in Ghana? what is the short run and long run effect of per-capita income on Life expectancy rate in Ghana? And what is the trend analysis of the Government health expenditure, per-capita income and life expectancy rate Ghana?
The importance of studying the effects of per capita income and public health expenditure on life expectancy cannot be overstated. Life expectancy is a critical indicator of a population's overall health and well-being. Understanding how income and health expenditure influence life expectancy enables policymakers and healthcare professionals to allocate resources more effectively, ultimately improving public health outcomes. It can also help Governments and policymakers using insights from such study to make informed decisions about budget allocations for healthcare. For instance, if higher per-capita income correlates with longer life expectancy, it might justify policies aimed at economic growth. Conversely, if higher health expenditure per capita is linked to increased life expectancy, it could prompt increased investment in healthcare infrastructure and services. Research in this area also sheds light on disparities in health outcomes. It can reveal whether economic factors [like income levels] or healthcare accessibility [linked to expenditure] disproportionately affect certain demographic groups, highlighting areas where interventions are needed to promote equity in health outcomes. Understanding the relationship between income, health expenditure, and life expectancy, policymakers can better plan for long-term demographic changes and healthcare needs. This includes forecasting healthcare demands and ensuring sustainable funding mechanisms. The publicization of the findings can also increase awareness among the general population about the importance of healthcare access and economic stability in determining life expectancy. This can lead to advocacy for policies that support both economic development and public health. The paper was delimited to Government health expenditure, per-capita income and life expectancy rate in Ghana. Empirically, the study was delimited to the effect of Government health expenditure and per-capita income on life expectancy rate in Ghana employing data from World Development Indicators.
The study examined the relationship between public health expenditure, per capita income, and life expectancy in Ghana using data from the World Development Indicators from 2000 to 2022. By applying the Autoregressive Distributed Lag cointegration approach, the study analyzed short- and long-term dynamics between these variables. The results show that while public health expenditure per capita is negatively associated with life expectancy, per capita income has a positive correlation with life expectancy. The study also found that factors like birth rates, access to sanitation services, and CO2 emissions significantly impact life expectancy in Ghana. The literature reviewed highlights that public health expenditure is vital for improving healthcare access and reducing disease burden, while higher per capita income generally contributes to better health outcomes through enhanced access to healthcare and improved living conditions. However, the study also acknowledges the challenges faced by Ghana, including healthcare disparities and limited resources, which hinder the full potential of these investments in improving life expectancy. The study concludes by emphasizing the need for comprehensive policy measures that address the socio-economic and environmental determinants of health. These include focusing on increasing public health funding, promoting equitable income distribution, and tackling environmental issues such as pollution to ensure that improvements in life expectancy are sustainable and inclusive.
1.1. Problem Statement and Need for the Research
In Ghana, the relationship between public health spending, per capita income, and life expectancy remains a crucial area of investigation in understanding the country's healthcare dynamics. Despite the significant strides made in increasing public health expenditure in recent years
, the nation still faces persistent challenges in improving overall health outcomes. While increasing public health spending is expected to enhance healthcare access and quality, studies suggest that Ghana continues to experience disparities in healthcare access and health outcomes, particularly across different socio-economic groups
| [27] | Preston, S. H. (1975). The changing relation between mortality and level of economic development. Population Studies, 29(2), 231-248. |
| [37] | World Bank. (2022). Ghana: Health and nutrition. Retrieved from https://www.worldbank.org/en/country/ghana |
[27, 37]
. This disparity is compounded by budget constraints and the uneven distribution of resources, hindering the full potential of public health investments. Moreover, per capita income, which is a fundamental indicator of economic prosperity, also plays a significant role in influencing life expectancy. Higher income levels generally correlate with improved healthcare access, better nutrition, and higher quality of living, which in turn, contribute to longer life expectancy
. However, in Ghana, the potential of increased income to improve life expectancy may be constrained by other socio-economic factors, such as income inequality and uneven access to healthcare
| [19] | Lynch, J. W., Smith, G. D., & Hillemeier, M. M. (2017). Income inequality, the psychosocial environment, and health: Comparisons of wealthy nations. Lancet, 340(8848), 1387-1393. https://doi.org/10.1016/S0140-6736(92)92221-M |
[19]
. While existing studies have demonstrated a positive correlation between public health expenditure, per capita income, and life expectancy in global contexts
, there is limited research exploring the nuances of this relationship specifically within the Ghanaian context. The dynamics between these variables in Ghana remain underexplored, leaving a gap in the understanding of how public health funding and economic prosperity can effectively translate into improved health outcomes for the population
| [7] | Case, A., & Deaton, A. (2015). Rising morbidity and mortality in midlife among white non-Hispanic Americans in the 21st century. Proceedings of the National Academy of Sciences, 112(49), 15078-15083. |
| [22] | Mackenbach, J. P., Kulhánová, I., Menvielle, G., Bopp, M., Borrell, C., Costa, G., & Deboosere, P. (2015). Trends in inequalities in premature mortality: A study of 3.2 million deaths in 13 European countries. Journal of Epidemiology and Community Health, 69(3), 207-217. |
[7, 22]
. This gap is critical, as it limits the capacity of policymakers to design targeted interventions that could address health inequalities and enhance the life expectancy of Ghanaians. Understanding the interplay between public health spending, per capita income, and life expectancy in Ghana is essential for informing policy decisions aimed at optimizing resource allocation, reducing health disparities, and improving overall public health outcomes. Therefore, this study seeks to fill this gap by examining the effects of government health expenditure and per capita income on life expectancy in Ghana, with the goal of providing evidence-based insights that could guide future health and economic policies. This problem statement clearly outlines the issue at hand, emphasizes the importance of the topic, and references relevant studies to demonstrate the research gap in the context of Ghana.
Understanding the relationship between public health spending, per capita income, and life expectancy is vital for improving healthcare systems and achieving better health outcomes, especially in developing countries like Ghana. The importance of this research stems from the persistent challenges that Ghana faces in improving life expectancy despite the growth in public health expenditure and economic development
| [20] | Lynch, J., Smith, G. D., Kaplan, G. A., & House, J. S. (2017). Income inequality and health: The time has come to consider the context of the question. Journal of Health Politics, Policy and Law, 42(5), 1-11. https://doi.org/10.1215/03616878-4265174 |
[20]
. Although Ghana has increased its public health spending in recent years, the country continues to experience disparities in healthcare access and overall health outcomes due to unequal distribution of resources and budgetary constraints
. This is critical as public health spending is expected to directly contribute to improvements in healthcare services, disease prevention, and the overall health infrastructure
, However, the effectiveness of health expenditure can be limited if not complemented by broader socio-economic improvements such as rising per capita income. Per capita income is widely recognized as a key determinant of health outcomes, including life expectancy, because higher income generally facilitates access to better healthcare, nutrition, and living conditions, all of which contribute to longer life expectancy
. However, despite Ghana’s economic growth in recent years, income inequality remains a significant challenge, limiting the ability of many individuals to access adequate healthcare services
| [19] | Lynch, J. W., Smith, G. D., & Hillemeier, M. M. (2017). Income inequality, the psychosocial environment, and health: Comparisons of wealthy nations. Lancet, 340(8848), 1387-1393. https://doi.org/10.1016/S0140-6736(92)92221-M |
[19]
. Furthermore, while economic prosperity is typically associated with better health outcomes, the impact of income inequality and uneven distribution of public health resources can moderate this relationship, resulting in health disparities within the population
| [27] | Preston, S. H. (1975). The changing relation between mortality and level of economic development. Population Studies, 29(2), 231-248. |
[27]
As such, the interplay between public health spending and per capita income, and its combined influence on life expectancy, remains an area that has not been fully explored in the Ghanaian context. Existing studies have shown a positive correlation between public health expenditure and life expectancy globally
, but the specific effects of government health expenditure and per capita income on life expectancy in Ghana have not been adequately examined. Without a clear understanding of these dynamics, policymakers in Ghana may struggle to make informed decisions regarding resource allocation and health interventions. Moreover, given that life expectancy is a crucial indicator of a population’s overall health, any improvement in this measure would have significant socio-economic benefits, including increased productivity, reduced healthcare costs, and improved quality of life for the population
. Thus, this research is necessary to address the gap in knowledge regarding the influence of public health expenditure and per capita income on life expectancy in Ghana. By examining the short- and long-term effects of these variables, this study will provide critical insights into how health policies and economic strategies can be optimized to improve life expectancy and reduce health disparities. The findings will be essential for guiding policymakers in developing effective, evidence-based strategies to enhance public health outcomes in Ghana, ensuring that economic growth translates into tangible health improvements for all segments of society.
1.2. Scope and Limitation of the Research
The study was delimited to Government health expenditure, per-capita income and life expectancy rate in Ghana. Empirically, the study was delimited to the effect of Government health expenditure and per-capita income on life expectancy rate in Ghana employing data from World Development Indicators (WDI).
The limitation of the study includes the use of secondary data which affected the kind of variables that were adopted in the study. Proxies were used to indicate certain key variables theorized to affect life expectancy rate. Variables such as Government health expenditure, per-capita income, birth rate per 1000 people, population density and employment to population ratio. Additionally, because the variables were not uniform in units and magnitudes, the variables were linearized to ensure uniformity. The data employed spanned the years between 2000 to 2022.
2. Literature Review
2.1. Theoretical Review
2.1.1. The Human Capital Theory
The Human Capital Theory posits that health is a crucial component of human capital, influencing productivity and economic growth
| [3] | Becker, G. (1964). Human capital: A theoretical and empirical analysis, with special reference to education. University of Chicago Press. |
[3]
. According to this theory, investments in health, including public health expenditure, enhance the health of the labor force, leading to increased productivity and, consequently, higher income. Public health spending that improves healthcare services and reduces mortality can, therefore, enhance the quality of human capital, leading to higher life expectancy. The theory suggests that the health of a population is directly linked to the level of economic development, which is influenced by both health expenditure and income
. In this context, health expenditure contributes to improving healthcare infrastructure, reducing the burden of diseases, and improving overall life expectancy.
2.1.2. The Health Production Function
The Health Production Function model provides a framework to analyze the role of various inputs, including public health spending, per capita income, and environmental factors, in determining the health status of a population
| [10] | Fuchs, V. R. (1982). The health economy. Harvard University Press. |
[10]
According to this theory, life expectancy is a function of several inputs such as income, education, healthcare access, and living conditions. Public health expenditure, which includes investments in medical services, sanitation, and disease prevention programs, is considered an important input in improving life expectancy. Additionally, per capita income plays a significant role in health outcomes by facilitating access to better healthcare, nutrition, and living conditions, which are all determinants of life expectancy
| [24] | Marmot, M. (2005). The status syndrome: How social standing affects our health and longevity. Henry Holt and Co. |
[24]
.
2.1.3. The Social Determinants of Health Framework
The Social Determinants of Health framework emphasizes that life expectancy is shaped by a range of social, economic, and environmental factors, including public health spending and income distribution
| [33] | World Health Organization (WHO). (2010). Social determinants of health. WHO Press. |
[33]
. This approach highlights the importance of addressing broader socio-economic conditions, such as income inequality and access to healthcare, to improve population health. According to this framework, increasing per capita income and public health expenditure can reduce health inequalities by providing access to better healthcare services, improving sanitation, and addressing other social determinants that affect health outcomes. In this context, life expectancy is not only influenced by medical care but also by factors such as education, employment, and income distribution.
2.2. Empirical Review
2.2.1. Public Health Expenditure and Life Expectancy
Numerous studies have explored the impact of public health expenditure on life expectancy. A study by
found that higher public health spending significantly contributes to increased life expectancy in developing countries. This result is consistent with findings by
| [4] | Behera, D. K., & Dash, U. (2020). Is health expenditure effective for achieving healthcare goals? Empirical evidence from the South-East Asia region. Asia-Pacific Journal of Regional Science, 4, 593-618. http://doi.org/10.1007/s41685-020-00158-4 |
[4]
, who argued that government investment in healthcare infrastructure and services has a direct positive effect on life expectancy. In Ghana, public health spending has increased over the years, and some improvements in health outcomes, such as life expectancy, have been observed
. However, challenges such as underfunding in rural areas and insufficient healthcare infrastructure continue to affect the overall effectiveness of these investments
.
2.2.2. Per Capita Income and Life Expectancy
The relationship between per capita income and life expectancy has been widely documented in the literature. Higher per capita income typically enables better access to healthcare, improved nutrition, and overall better living conditions, all of which are important for increasing life expectancy. For instance, a study by Preston 1975 demonstrated that as countries experience economic growth, life expectancy increases due to better access to healthcare and improved living standards
| [27] | Preston, S. H. (1975). The changing relation between mortality and level of economic development. Population Studies, 29(2), 231-248. |
[27]
. Similarly,
| [6] | Case, A., & Deaton, A. (2015). Broken down by income group: A decade of stagnation in life expectancy in the United States. The Journal of Economic Perspectives, 29(4), 1-16. https://doi.org/10.1257/jep.29.4.1 |
[6]
found that higher income correlates with longer life expectancy, as it allows individuals to afford better healthcare services and maintain healthier lifestyles. In Ghana, the relationship between per capita income and life expectancy is evident, as economic growth in recent decades has led to some improvements in health outcomes, but income inequality continues to hinder equitable access to healthcare
| [19] | Lynch, J. W., Smith, G. D., & Hillemeier, M. M. (2017). Income inequality, the psychosocial environment, and health: Comparisons of wealthy nations. Lancet, 340(8848), 1387-1393. https://doi.org/10.1016/S0140-6736(92)92221-M |
[19].
Per capita income serves as a vital metric in assessing the economic well-being of a nation's population by measuring the average income earned per person within a specific timeframe. In the case of Ghana, per capita income reflects the average earnings of its residents, illustrating economic development and living standards. Ghana's per capita income was approximately $2,202 USD, highlighting its position within the global economic landscape. This figure underscores both the challenges and opportunities present in Ghana's economic trajectory, influenced by factors such as agriculture, natural resources, and growing industrial sectors
.
2.2.3. The Interplay Between Public Health Expenditure and Per Capita Income
Several studies have examined the interaction between public health expenditure and per capita income in shaping health outcomes. A study by
| [21] | Mackenbach, J. P., Kulhánová, I., & Menvielle, G. (2015). Socio-economic inequalities in mortality in Europe. European Journal of Public Health, 25(1), 26-33. https://doi.org/10.1093/eurpub/cku168 |
[21]
suggested that both public health expenditure and per capita income are critical for improving health outcomes, but their effects are often context-dependent. In low-income countries like Ghana, increasing per capita income can facilitate better access to healthcare and sanitation, which, when combined with higher public health spending, can have a synergistic effect on life expectancy
. However, disparities in income distribution can limit the full potential of these investments, as the benefits of increased public health spending may not reach all segments of society, especially those in lower socio-economic groups
| [27] | Preston, S. H. (1975). The changing relation between mortality and level of economic development. Population Studies, 29(2), 231-248. |
[27]
.
2.2.4. Challenges in Health Outcomes in Ghana
While Ghana has made significant strides in increasing public health expenditure, challenges remain in translating this spending into improved health outcomes for the entire population. A study by
| [1] | Asenso-Okyere, K., & Osei-Akoto, I. (2017). Health financing in Ghana: A critical review of health financing reforms and their outcomes. Ghana Health Service. |
[1]
highlighted that while there have been increases in public health spending in Ghana, the country still faces significant disparities in healthcare access and outcomes between urban and rural populations. Furthermore, despite growth in per capita income, income inequality continues to be a major challenge, affecting access to healthcare services and impacting life expectancy
| [19] | Lynch, J. W., Smith, G. D., & Hillemeier, M. M. (2017). Income inequality, the psychosocial environment, and health: Comparisons of wealthy nations. Lancet, 340(8848), 1387-1393. https://doi.org/10.1016/S0140-6736(92)92221-M |
[19]
. The effectiveness of public health expenditure in improving life expectancy in Ghana is therefore dependent not only on the level of spending but also on its efficient allocation and equitable distribution.
2.2.5. CO2 Emissions and Life Expectancy
Some studies have also considered the role of environmental factors, such as CO
2 emissions, in influencing life expectancy. According to a study by
| [29] | Stokols, D. (2018). The science of human ecology: A new paradigm for understanding the health implications of environmental stressors. Environmental Research, 154, 195-201. https://doi.org/10.1016/j.envres.2017.11.002 |
[29]
, high levels of air pollution, including CO
2 emissions, can have a detrimental effect on public health, thereby reducing life expectancy. In Ghana, rising urbanization and industrialization have led to increased CO
2 emissions, which, in turn, have been linked to respiratory diseases and other health conditions that may negatively affect life expectancy
| [14] | Hassan, S. S., Smit, B., & Strydom, J. (2017). Impact of urbanization on air quality and public health: A case study in Ghana. Environmental Health Perspectives, 125(7), 078001-078008. https://doi.org/10.1289/EHP1486 |
[14]
. Therefore, addressing environmental factors alongside public health expenditure and income inequality is crucial for improving health outcomes in Ghana.
2.3. Conceptual Review
2.3.1. Public Health Spending
Ghana has made significant political, legislative, and fiscal commitments to provide universal health insurance coverage for its population, aimed at reducing financial barriers to healthcare utilization. The National Health Insurance Scheme [NHIS] is a central part of this effort, providing a comprehensive health benefits package that includes preventive care and treatment for both communicable and non-communicable diseases. Despite these efforts, Ghana's health sector faces numerous challenges, particularly in terms of achieving universal coverage and financial sustainability.
2.3.2. Ghana's Health Sector Reforms
Ghana's health sector has undergone comprehensive reforms, including improvements in human resources, decentralization, and policy changes to enhance drug availability and staff incentivization in health facilities.
| [16] | Kamper, S., Apeldoorn, A. T., Chiarotto, A., Smeets, R., Ostelo, R., Guzmán, J., & van Tulder, M. V. (2014). Multidisciplinary biopsychosocial rehabilitation for chronic low back pain. The Cochrane Database of Systematic Reviews, 9, CD000963. http://doi.org/10.1002/14651858.CD000963.pub3 |
[16]
However, despite these reforms, health outcomes in Ghana are not on track to meet several Millennium Development Goals, highlighting the need for better-targeted public health programs and improvements in the functioning of the health delivery system.
The slow increase in NHIS coverage, particularly among informal sector workers, and the financial sustainability of the system are identified as primary challenges that need to be addressed
| [18] | Kusi, A., Enemark, U., Hansen, K., & Asante, F. (2015). Refusal to enroll in Ghana’s National Health Insurance Scheme: Is affordability the problem? International Journal for Equity in Health, 14. http://doi.org/10.1186/s12939-014-0130-2 |
[18]
.
2.3.3. Life Expectancy Rate in Ghana
Life expectancy rate is a crucial indicator of the overall health and well-being of a population, providing insight into the average number of years a person can expect to live based on current mortality rates
| [1] | Asenso-Okyere, K., & Osei-Akoto, I. (2017). Health financing in Ghana: A critical review of health financing reforms and their outcomes. Ghana Health Service. |
| [7] | Case, A., & Deaton, A. (2015). Rising morbidity and mortality in midlife among white non-Hispanic Americans in the 21st century. Proceedings of the National Academy of Sciences, 112(49), 15078-15083. |
[1, 7]
. In Ghana, life expectancy has shown improvements over recent decades, reflecting advancements in healthcare, nutrition, and socioeconomic conditions. Ghana's life expectancy at birth was approximately 64 years. This statistic underscores ongoing efforts in healthcare infrastructure, disease prevention, and access to medical services throughout the country. Factors such as infectious diseases, maternal health, and access to clean water and sanitation continue to influence life expectancy rates in Ghana
| [20] | Lynch, J., Smith, G. D., Kaplan, G. A., & House, J. S. (2017). Income inequality and health: The time has come to consider the context of the question. Journal of Health Politics, Policy and Law, 42(5), 1-11. https://doi.org/10.1215/03616878-4265174 |
[20]
.
2.3.4. CO2 Emissions Per Capita on Life Expectancy
The relationship between CO
2 emissions in metric tons per capita and life expectancy has been a subject of interest in environmental and public health research. However, the literature on this specific relationship is limited, as evidenced by the scarcity of studies directly addressing this topic. In this literature review, we will synthesize and integrate the available research insights to shed light on the potential effects of CO
2 emissions on life expectancy and identify knowledge gaps for future research.
| [17] | Kawamoto, R., Mochizuki, H., Moriguchi, Y., Nakano, T., Motohashi, M., Sakai, Y., & Inaba, A. (2019). Estimation of CO2 emissions of internal combustion engine vehicle and battery electric vehicle using LCA. Sustainability. http://doi.org/10.3390/SU11092690 |
[17]
estimated CO
2 emissions of internal combustion engine vehicles and battery electric vehicles using life cycle assessment, but did not address the impact of CO
2 emissions on life expectancy.
investigated the life cycle greenhouse gas emissions of coal-fired electricity generation. However, neither of these studies delved into the direct relationship between CO
2 emissions in metric tons per capita and life expectancy. Again,
| [31] | Wang, Q., & Li, L. (2021). The effects of population aging, life expectancy, unemployment rate, population density, per capita GDP, urbanization on per capita carbon emissions. Sustainable Production and Consumption, 28, 760-774. http://doi.org/10.1016/J.SPC.2021.06.029 |
[31]
investigated the effects of population aging, life expectancy, unemployment rate, population density, per capita GDP, and urbanization on per capita carbon emissions, while
| [38] | Zhu, W., Chishti, M., Rehman, A., & Ahmad, M. (2021). A pathway toward future sustainability: Assessing the influence of innovation shocks on CO2 emissions in developing economies. Environment, Development and Sustainability, 24, 4786-4809. http://doi.org/10.1007/s10668-021-01634-3 |
[38]
assessed the influence of innovation shocks on CO
2 emissions in developing economies. Nevertheless, the direct effect of CO
2 emissions in metric tons per capita on life expectancy was not explicitly addressed in these studies.
2.3.5. Per-Capita Income and Life Expectancy
In recent years, the relationship between per-capita income and life expectancy has been a topic of interest in the field of public health and economics. The determinants of health status have been a focus of research, with income per capita being identified as a significant factor in estimating the health production function
| [2] | Bayati, M., Akbariãn, R., & Kavosi, Z. (2013). Determinants of life expectancy in the Eastern Mediterranean region: A health production function. Comparative Political Economy: Social Welfare Policy eJournal. http://doi.org/10.15171/ijhpm.2013.09 |
[2]
. This finding indicates that there is a positive association between income per capita and life expectancy at birth. Specifically, the study found that a higher income per capita was associated with an increase in life expectancy, with a beta coefficient of 0.05 and a statistically significant p-value of less than 0.001
| [2] | Bayati, M., Akbariãn, R., & Kavosi, Z. (2013). Determinants of life expectancy in the Eastern Mediterranean region: A health production function. Comparative Political Economy: Social Welfare Policy eJournal. http://doi.org/10.15171/ijhpm.2013.09 |
[2]
. This suggests that higher income levels are linked to improved health outcomes and longer life expectancy in the Eastern Mediterranean region. However, it is important to note that factors other than income per capita also play a role in determining life expectancy. For example, PM2.5 pollution was found to have a significant impact on life expectancy, with excess pollution levels contributing to a decrease in life expectancy in both females and males
| [2] | Bayati, M., Akbariãn, R., & Kavosi, Z. (2013). Determinants of life expectancy in the Eastern Mediterranean region: A health production function. Comparative Political Economy: Social Welfare Policy eJournal. http://doi.org/10.15171/ijhpm.2013.09 |
[2]
This highlights the complex interplay of various environmental and socioeconomic factors in shaping life expectancy outcomes. Moreover, historical analysis has revealed that the relationship between national income and life expectancy has evolved over time. Prior to 1960, large upward shifts in this relationship were observed, primarily driven by rapid declines in mortality from infectious diseases, rather than increases in national income. This suggests that improvements in life expectancy were not solely attributable to income growth, but also to advancements in public health and disease control measures
| [6] | Case, A., & Deaton, A. (2015). Broken down by income group: A decade of stagnation in life expectancy in the United States. The Journal of Economic Perspectives, 29(4), 1-16. https://doi.org/10.1257/jep.29.4.1 |
[6]
.
Despite these findings, there are still knowledge gaps that warrant further research. For instance, while the relationship between per-capita income and life expectancy has been established, the specific mechanisms through which income influences health outcomes need to be further elucidated. Additionally, the differential impact of income on specific population subgroups, such as rural vs. urban residents, remains an area for future investigation. Furthermore, the long-term effects of income inequality on life expectancy and the potential role of social welfare policies in mediating this relationship are areas that require further exploration.
| [4] | Behera, D. K., & Dash, U. (2020). Is health expenditure effective for achieving healthcare goals? Empirical evidence from the South-East Asia region. Asia-Pacific Journal of Regional Science, 4, 593-618. http://doi.org/10.1007/s41685-020-00158-4 |
[4]
discovered that per-capita income, as well as the rate of hospital beds, medical staff, and nurses, Granger-cause the variable "life expectancy at birth." This suggests that both economic factors and healthcare resources play a crucial role in determining life expectancy rates. However, the specific impact of per-capita income on life expectancy in Ghana requires further investigation.
In conclusion, the existing literature has provided valuable insights into the relationship between per-capita income and life expectancy. However, continued research is needed to deepen our understanding of this complex relationship and to inform evidence-based policy interventions aimed at improving population health and well-being in Ghana and other similar contexts.
2.3.6. Comparative Analysis
In a comparative study,
| [5] | Carvelli, A., Scaramozzino, P., Iacoponi, F., Condoleo, R., & Marta, U. Della. (2020). Size, demography, ownership profiles, and identification rate of the owned dog population in central Italy. PLoS ONE, 15. http://doi.org/10.1371/journal.pone.0240551 |
[5]
indicated that public expenditure on health is the second most relevant factor affecting life expectancy at birth in European countries. This highlights the importance of public health spending in influencing life expectancy rates. However, the applicability of this finding to the Ghanaian context remains unclear and warrants further exploration. The rational for government expenditures on health care is equity provision, aiming to ensure that all individuals have access to essential health services. However, empirical data suggests that the rich individuals in high-income countries tend to benefit more from government expenditure on health care than the poor
| [11] | Giarrizzo, T., Andrade, M., Schmid, K., Winemiller, K., Ferreira, M., Pegado, T., Chelazzi, D., Cincinelli, A., & Fearnside, P. (2019). Amazonia: The new frontier for plastic pollution. Frontiers in Ecology and the Environment. http://doi.org/10.1002/FEE.2071 |
[11]
. This disparity raises questions about the equity and effectiveness of government health expenditures in improving overall population health outcomes. Research findings indicate that there is a complex relationship between health expenditure per capita, per capita income, and life expectancy. While high-income countries allocate more resources to public provision of health care, the impact of government health expenditures on population health is more pronounced in low-income countries
| [11] | Giarrizzo, T., Andrade, M., Schmid, K., Winemiller, K., Ferreira, M., Pegado, T., Chelazzi, D., Cincinelli, A., & Fearnside, P. (2019). Amazonia: The new frontier for plastic pollution. Frontiers in Ecology and the Environment. http://doi.org/10.1002/FEE.2071 |
[11]
. This suggests that the effectiveness of health expenditure in improving life expectancy may be influenced by the level of economic development in a country. Therefore, the relationship between health expenditure per capita, per capita income, and life expectancy is complex and influenced by various factors. While the existing research provides valuable insights, there are still knowledge gaps that need to be addressed through future research to enhance our understanding of the impact of government health expenditures on population health and life expectancy.
Despite the existing research on public health spending, per-capita income, and life expectancy, there are several knowledge gaps that need to be addressed. First, there is a need for more specific studies that focus on the Ghanaian healthcare system to understand the direct impact of public health spending and per-capita income on life expectancy in the country. Additionally, the long-term effects of public health expenditure and per-capita income on life expectancy in Ghana require further investigation, considering the dynamic nature of these variables. Furthermore, the interactions between public health policies, socioeconomic factors, and healthcare resources in influencing life expectancy rates need to be explored in more detail. Future research should also consider the role of cultural and environmental factors in shaping health outcomes in Ghana. Finally, the potential implications of these findings for policy-making and resource allocation in the Ghanaian healthcare sector should be a focus of future research efforts.
3. Methodology
3.1. Data Source and Variable Description
This work employed secondary data. Data on variables including life expectancy rate, Government health expenditure, per-capita income, birth rate per 1000 people employment to population ratio, CO2 emissions in tons per capita, access to safe drinking water and access to safe sanitation services spanning from 2000 to 2022 years were derived from derived from the World development indicators [WDI].
3.1.1. Dependent Variable
Life Expectancy is the average number of years that a person is expected to live based on various factors such as age, gender, country and other democratic characteristics. That is, it is a statistical measure that indicates how long, on average, a person can expect to live from a specific point in time, typically from birth. It is often expressed as a percentage or ratio. It is measured using mortality rates and usually expressed as a number of years. It is an important indicator of public health and quality of life or human development index.
3.1.2. Explanatory Variables
The explanatory variables employed in the study include Government health expenditure per capita, per-capita income, birth rate per 1000 people, CO2 emissions in metric tons per capita, employment to population ratio, percentage of population with access to safe drinking water and percentage of population with access to safe sanitation services. According to the World Development Indicators, Government health expenditure is the amount of money that a government spends on health and include funding for public hospitals and health facilities, public health programs and initiatives, healthcare research and development and so on. Per-capita income is defined as the average income earned by a person in a specific area, in this case Ghana. That is, the total national income or gross domestic product divided by the population. Birth rate per 1000 people is the number of live births occurring annually per 1,000 population. CO2 emissions in tons per capita is the total carbon dioxide emissions captured in tons divided by the total population whiles employment to population ratio indicates the proportion of the population employed.
3.2. Theory and Model Specification
The relationship between life expectancy and income is underpinned by several theories including economic theory which suggest that a higher income (Per-capita income) allows for better access to healthcare, nutrition and living conditions, thereby leads to improved health outcomes and longer life expectancy. Other theories supporting the life expectancy and income nexus include the social determinants of health theory, human capital theory, health production theory and capability approach.
The social determinants theory argues that income influences health outcomes through its impact on socioeconomic determinants such as education, housing and employment which in turn affect life expectancy. Human Capital and Health Production theories on the hand posit that investment in human capital [education and health] increases productivity and income, leading to better health outcomes and longer life expectancy and higher income enables greater investment in health-promoting activities and technologies respectively. Finally, Capability Approach suggest that income provides the means to achieve certain capabilities including good health and education which are essential for a long and healthy life.
This study adopts the health production theory also known as the Grossman Model which was developed by in 1972 by Michael Grossman. The theory is a framework employed in health economics to understand the production of health and demand for healthcare.
Applying this theory to our study of the relationship between public health expenditure, income and life expectancy will help us understand how investment in health and income growth influence life expectancy in Ghana.
The empirical model therefore is expressed as:
Where LE is annual Life expectancy in years, HE is public health spending per capita and εt is the error term whiles α and β are coefficients of life expectancy and public health spending per capita respectively.
Other important variables were incorporated as control variables and these include birth rate per 1000 people, employment to population ratio, CO2 emissions per capita, percentage of total population with access to safe drinking water and access to safe sanitation services. Therefore, the expanded model in this study becomes:
LE=α(HE) +β(K)+c(BR)+d(EP)+e(CC) + f (AD) + g (AS) +εt(2)
Where LE represents the annual life expectancy rate in years, HE stands for public health spending per capita in dollars, K for per-capita income in dollars, BR for birth rate per 1000 people, EP as the employment per population in percentage, CC as the C02 emissions in tons per capita, AD as the percentage of population with access to safe drinking water and AS is the percentage of the total population with access to safe sanitation services.
3.3. Research Design
Research design is a plan that guides researchers in conducting a study. It summaries the overall strategy for collecting, analyzing, and interpreting data to answer research questions. The design provides a framework that ensures the research is systematic, valid, and reliable
| [30] | Ussif, R., et al. (2020). Research methodologies: Qualitative, quantitative, and mixed research methods in social sciences. International Journal of Academic Multidisciplinary Research (IJAMR), 4, 83-91. |
[30]
. This approach was employed to investigate the capita income and public health spending per capita on life expectancy in Ghana. Correlational research design was employed. It is a type of research method that examines the statistical relationship between two or more variables without necessarily implying a causal relationship. In other words, it investigates whether, and to what extent changes in one variable are associated with changes in another variable. Correlation does not imply causation; it simply suggests that there is a relationship between the variables: The public health spending, income growth and life expectancy in the short and long run relationship was estimated. The Autoregressive Distributed Lag [ARDL] cointegration test was employed.
3.4. Estimation Techniques
Here, unit root analysis, trend analysis and co-integration analysis which were conducted in the study were discussed.
3.4.1. Unit Root Analysis
Unit root analysis is a statistical method used in time series analysis to determine if a variable is non-stationary
| [13] | Hamilton, J. D. (1994). Time series analysis. Princeton University Press. |
[13]
. In simpler terms, it helps us understand whether a series has a tendency to return to a certain level over time or if it exhibits a long-term trend. When a time series has a unit root, it implies that the series is non-stationary, meaning its statistical properties like mean and variance are not constant over time. Unit root tests, such as the Augmented Dickey-Fuller [ADF] test or the Phillips-Perron test, are commonly used to assess whether a unit root is present in a time series. If the unit root is not present, it suggests that the series is stationary, and its statistical properties remain relatively constant over time. Stationary time series are often easier to analyze and model
| [9] | Dickey, D. A., & Fuller, W. A. (1979). Distribution of the estimators for autoregressive time series with a unit root. Journal of the American Statistical Association, 74(366), 427-431. https://doi.org/10.1080/01621459.1979.10482531 |
[9]
. In finance, for example, unit root analysis is frequently used to examine the behavior of financial variables over time and to assess the efficiency of financial markets. It's a powerful tool in understanding the underlying dynamics of time series data. The most common test for unit root analysis is the Augmented Dickey-Fuller [ADF] test. The null hypothesis of the ADF test is that a unit root is present in the time series, indicating non-stationarity. If the test statistic is less than the critical value, the null hypothesis is rejected, suggesting stationarity. In this study, the Augmented Dickey-Fuller (ADF) test was used to assessed whether the variables have unit root or not, that is whether the variables were stationary or non-stationary
| [9] | Dickey, D. A., & Fuller, W. A. (1979). Distribution of the estimators for autoregressive time series with a unit root. Journal of the American Statistical Association, 74(366), 427-431. https://doi.org/10.1080/01621459.1979.10482531 |
[9].
3.4.2. Trend Analysis
Trend analysis involves examining data over time to identify patterns, tendencies, or changes in a particular variable or set of variables
| [26] | Montgomery, D. C., Jennings, C. L., & Kulahci, M. (2015). Introduction to time series analysis and forecasting (2nd ed.). Wiley. |
[26]
. It's commonly used in various fields like finance, economics, and marketing to make informed decisions based on historical data. In this study, trend or graphical analysis of variables such life expectancy rate, public health spending, per capita income, access to safe drinking water and access to safe sanitation services were conducted using EVIEWS statistical model.
3.4.3. Cointegration
Cointegration analysis is a statistical technique used to investigate the short and long-term equilibrium relationship between two or more time series
| [9] | Dickey, D. A., & Fuller, W. A. (1979). Distribution of the estimators for autoregressive time series with a unit root. Journal of the American Statistical Association, 74(366), 427-431. https://doi.org/10.1080/01621459.1979.10482531 |
[9]
It's often applied in the context of financial markets, economics, and other fields. If the individual time series are non-stationary but Cointegrated variables exhibit a sustained connection, moving in tandem without deviation. Consequently, any alteration in one variable promptly influences all others and continues to do so over time. The theory posits that variables integrated at order one (1) have the potential for cointegration. In instances where the individual variables share the same order of integration and, at the very least, one stationary linear combination, the considered variables are deemed cointegrated. Conversely, variables lacking cointegration indicate a short-term relationship
| [9] | Dickey, D. A., & Fuller, W. A. (1979). Distribution of the estimators for autoregressive time series with a unit root. Journal of the American Statistical Association, 74(366), 427-431. https://doi.org/10.1080/01621459.1979.10482531 |
[9]
. The cointegrating equation can be represented as:
Yt=
β0+
β1
Xt+
εt where
Yt and
Xt are the cointegrated series, 0
β0 and 1
β1 are coefficients, and
εt is the error term. In this study, the Autoregressive Distributed Lag [ARDL] was adopted to carried out the cointegration regression analysis using EVIEWS.
(i). Autoregressive Distributed Lag [ARDL]
Autoregressive Distributed Lag [ARDL] is a modeling technique used in econometrics to analyze the long-term relationship between variables
| [9] | Dickey, D. A., & Fuller, W. A. (1979). Distribution of the estimators for autoregressive time series with a unit root. Journal of the American Statistical Association, 74(366), 427-431. https://doi.org/10.1080/01621459.1979.10482531 |
[9]
. It's particularly useful when dealing with time series data. To analyze the relationship between the given variables through the Autoregressive Distributed Lag (ARDL) cointegration and bound test approach, a VAR equation is formulated. This equation determines the lag length structure essential for conducting the VAR regression estimation. The selection of the lag length relies on five specific criteria: Akaike Information Criterion (AIC), Schwarz Information Criterion (SIC), Hannan-Quinn Criterion (HQ), Final Prediction Error (FPE), and Sequential Modified LR Test Statistic (LR). Typically, the lag order chosen is the one endorsed by the majority of these criteria, with a preference for AIC due to its consistent and reliable nature in providing accurate information about lag order compared to others. The AR part captures the short-term dynamics and is represented by lagged values of the dependent variable and the DL part accounts for the long-term relationship and involves lagged values of the independent variable(s)
| [9] | Dickey, D. A., & Fuller, W. A. (1979). Distribution of the estimators for autoregressive time series with a unit root. Journal of the American Statistical Association, 74(366), 427-431. https://doi.org/10.1080/01621459.1979.10482531 |
[9]
The ARDL model can be expressed as:
Yt=α+β0Yt−1+β1Xt+β2Xt−1+…+βkXt−k+εt
Where Yt is the dependent variable, Xt is the independent variable, α is the intercept, β coefficients represent the short-term and long-term effects, and εt is the error term.
In the case of this study, the selected lag length is 1 in the long-run, then the VAR linear regression for this study would be as follows:
LE=(LE)(-1)+α⋅(HE) +α⋅(HE)(-1)+β⋅(K) +β⋅(K)(-1)+β⋅(BR) +β⋅(BR)(-1)+β⋅(EP)(-1)+β⋅(EP)(-1)+…….+εt
Co-integration (Autoregressive Distributed Lag) test carried out using E-Views helps determine the short and long run relationship between these variables.
(ii). ARDL Cointegration Residual Test
The ARDL [Autoregressive Distributed Lag] residual test is a diagnostic test in econometrics to that is used to assess the adequacy of an ARDL model by examining the residuals (the differences between the observed and predicted values) of the model
| [9] | Dickey, D. A., & Fuller, W. A. (1979). Distribution of the estimators for autoregressive time series with a unit root. Journal of the American Statistical Association, 74(366), 427-431. https://doi.org/10.1080/01621459.1979.10482531 |
[9]
. This test helps verify the assumptions and validity of the estimated ARDL model. The assumptions to be verify include serial correlation or autocorrelation, heteroskedasticity and normality of the error terms. Autocorrelation test is conducted to determine whether the values of a time series variable are correlated with their past values and the test for normality examines whether the residuals follow a normal distribution. Normality is important for the validity of statistical inferences, such as hypothesis testing and confidence intervals. Heteroskedasticity test assesses whether the variance of the residuals is constant or non-constant across all levels of the independent variables. Heteroskedasticity just like autocorrelation and normality test are crucial for the reliability of the model's estimates.
(iii). ARDL Bound Wald Test
The ARDL [Autoregressive Distributed Lag] Bound Wald Test was conducted to examine the presence of cointegration in the ARDL model estimated. Cointegration implies a long-run relationship among variables
| [9] | Dickey, D. A., & Fuller, W. A. (1979). Distribution of the estimators for autoregressive time series with a unit root. Journal of the American Statistical Association, 74(366), 427-431. https://doi.org/10.1080/01621459.1979.10482531 |
[9]
. This Test helps determine whether there is a stable relationship by testing the significance of the coefficients associated with lagged differences of the variables. The null hypothesis of the ARDL Bound Wald Test is that there is no cointegration, meaning the coefficients on the lagged differences of the variables are jointly equal to zero
| [9] | Dickey, D. A., & Fuller, W. A. (1979). Distribution of the estimators for autoregressive time series with a unit root. Journal of the American Statistical Association, 74(366), 427-431. https://doi.org/10.1080/01621459.1979.10482531 |
[9]
. The test statistic which follows a chi-squared distribution is calculated based on the Wald statistic, which is a measure of how far the estimated coefficients are from the hypothesized values under the null hypothesis. The calculated test statistic was compared to the critical values from the chi-squared distribution to determine statistical significance. If the calculated test statistic is greater than the critical value at a specified significance level, the null hypothesis is rejected. And, the bigger the test statistic, the stronger the evidence against the null hypothesis of no cointegration. The chapter discussed source of data employed in the study. The data was sourced from the World Development Indicators. The research design adopted in the study, the empirical model, and method of data analysis were also discussed.
4. Findings and Discussions
4.1. Unit Root Test Results
The below table presents the result of the root test analysis conducted on all the variables included in the Autoregressive Distributed Lag Cointegration model. The test is carried out to determine the stationarity or otherwise of the variables. The results presented in the table indicates that, all the variables: Life expectancy (LE), per-capita income (K), public health spending per capita (HE), birth rate per 1000 people (BR), employment to population ratio (EP), CO2 emissions per capita (CC), percentage of total population with access to safe drinking water (AD) and access to safe sanitation services (AS) were not stationary at level, hence we fail to reject the null hypothesis. On the contrary, when subjected to the Augmented Dickey-Fuller (ADF) test at the first difference, all variables exhibit stationarity at a 1% significance level. That is the variables were integrated at order one I(1). Consequently, we reject the null hypothesis of a unit root at the first difference for these variables. Implying that the time series variables were stationary, meaning their means and variances, remain constant over time. Stationary variables adjust to their trend level when impacted by a shock. The shock induces only a temporary change in the stationary variable, with the variable eventually returning to its original trend level in the long run. Therefore, making it appropriate to apply cointegration regression modelling technique such as Autoregressive Distributed Lag which this thesis adopted.
Table 1. Unit root test (Test of Stationarity).
ADF Test at Levels | ADF Test at 1st Difference |
Variables | Constant | P-value | Constant | P-value |
Life Expectancy | 1.902 | 0.816 | 0.369 | 0.0005*** |
Per-capita income | 182.518 | 0.710 | 121.046 | 0.0002*** |
Health Expend | 10.6230 | 0.633 | 5.044 | 0.0001*** |
Birth Rate | -0.294 | 0.943 | -0.344 | 0.0101*** |
Employment | 16.632 | 0.440 | -0.016 | 0.0354** |
Carbon emissions | 0.004 | 0.987 | 0.026 | 0.0011*** |
Access to Water | 1.033 | 1.000 | 0.649 | 0.0099*** |
Access to Sanitation | 0.447 | 1.000 | 0.542 | 0.0000*** |
The p-values for both levels and 1st difference with *, ** and *** implies significant at 10, 5 and 1 percent respectively.
Source: Author with WDI data
4.2. Graphical Presentation of Annual Change in Variables
The graphical presentation of the trend in variables such as life expectancy at birth in years, per capita income in US dollars, current health expenditure per capita in US dollars, access to safe drinking water in percentages and access to safe sanitation services are presented below.
4.2.1. Life Expectancy
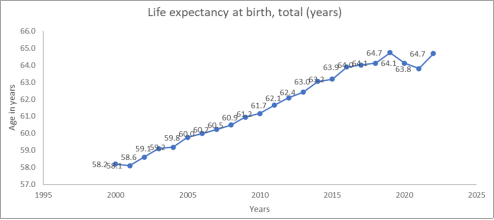
The graph below presents the annual life expectancy rate in years in Ghana spanning from 2000 to 2022. Whiles the highest life expectancy was recorded in 2019 and 2022 at 64.7 years, the lowest occurred in 2001 at 58.1 years. From 2001, the life expectancy rate witnesses a consistent upward jump till 2019 when it declined in 2020 and 2021.
Figure 1. Life Expectancy at Birth.
4.2.2. Per-capita Income
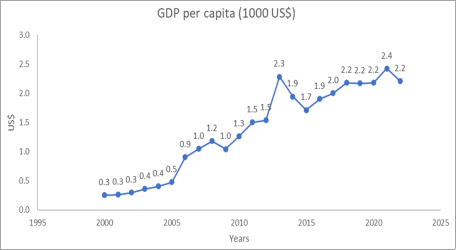
The graph below presents the annual per capita income in 1000 US dollars in Ghana spanning from 2000 to 2022. It is observed that per-capita income experiences fluctuations; rises for some time, falls and rises again. The highest per-capita income was recorded in 2021 at 2,400 US dollars which fell in the succeeding year 2022 to 2,200 US dollars. The lowest per-capita was recorded in 2000, 2001 and 2002 at approximately 300 US dollars. From 2000 to 2022, the per-capita increased by a staggering 633.33%, implying a substantial increase Gross Domestic Product value relative to population growth.
Figure 2. GDP per capita.
4.2.3. Current Health Expenditure Per Capita
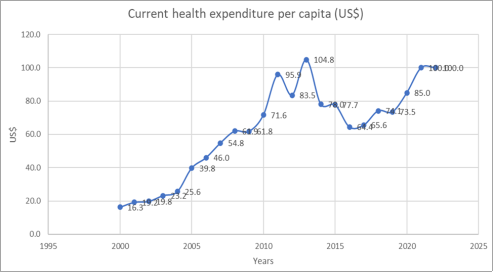
The graph below shows the current public health expenditure per capita in US dollars in Ghana spanning from the year 2000 to 2022. From the graph, it is observed that current health expenditure per capita rises consistently from 16.3 US dollars in 2000 to 61.9 in 2009. It fell to 61.8 in 2010 and then rise and remained above 70 US dollars for subsequent succeeding years except 2016 and 2017 which witnessed a sharp decline to 64.4 and 65.6 US dollars respectively. The highest current health expenditure per capita was witnessed in 2013 when relatively huge amount of money was expended in the health sector translating into 104 US dollars current health expenditure per-capita. The lowest current health expenditure per capita was recorded in 2000 at 16.3 US dollars. The percentage jump in current health expenditure per capita from 2000 to 2022 is 513.50%.
Figure 3. Current Health Expenditure per Capita.
4.2.4. Access to Safe Drinking Water
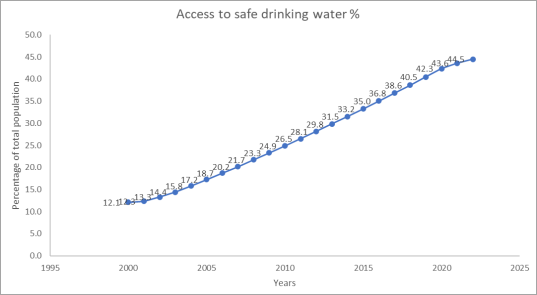
The graph below presents the annual percentage of Ghana’s population with access to safe drinking water which is key determinant to healthy living, wellbeing and long life. From the diagram, it is clear that Ghana has witnessed a consistent increase in access to safe drinking water. However, the increment is not so significant. The total percentage jump from 2000 to 2022 is 261.29% but the highest percentage increase annually was 4.9% between the years 2018 and 2019.
Figure 4. Access to safe drinking water.
4.2.5. Access to Safe Sanitation Services
The graph below shows the annual percentage of population with access to safe sanitation services in Ghana spanning from 2000 to 2022. It is observed that the country has recorded a linear increase in access to sanitation services over years between 2000 and 2022. The lowest access to sanitation services was recorded in 2000 at 3.6% of the entire population whiles the highest was 15.8% in 2022, a significant percentage jump of 338.89% but paltry in terms of the coverage of the entire population.
Figure 5. Access to safe sanitation services.
4.3. ARDL Cointegration Test Results
The results of the Autoregressive Distributed Lag cointegration test were presented below. The test was conducted to examined the long-run and short-run correlation between the dependent variable life expectancy and the other variables in the study. The variables include annual life expectancy rate in years (LE), current public health spending per capita in dollars (HE), per-capita income in dollars (K), birth rate per 1000 people (BR), employment per population in percentage (EP), C02 emissions in tons per capita (CC), percentage of population with access to safe drinking water (AD) and the percentage of the total population with access to safe sanitation services (AS). The results of the long run and short run correlation are presented below:
4.3.1. Long-run ARDL Regression Coefficients Estimates
The
table 2 below captures the long-run relationship between the dependent variable: life expectancy and the explanatory variables in the study. The sign and magnitude of the coefficients tell us the direction and intensity of the relationship respectively, and the probability value: p-value inform us of whether the correlation is significant, and if it is significant, by what level. From the results, the coefficient of current health expenditure per capita (HE) is negative (-0.022) and p-value is 0.004, indicating a negative relationship between expectancy rate in years (LE) and current health expenditure per capita in US$ is significant at 1%. The interpretation is that, a dollar rise in current health expenditure per capita leads to fall in life expectancy by 0.022 years all else constant and vice versa. This negative relationship between current health expenditure and life expectancy is known as the health expenditure paradox and the finding corroborates with the US economy which has high health expenditure but relatively lower life expectancy
. This may be due to inefficient resource allocation, inequitable distribution and overuse of services leading to higher cost yet poor health outcomes. Secondly, the long-run relationship between per-capita income (K) and life expectancy rate in years is positive and significant at 1%. The sign and magnitude of per-capita income is 0.001. This implies that, increasing per-capita income tends to increase life expectancy, and specifically suggest that, a dollar rise in per-capita income increases life expectancy by 0.001 years all else constant and vice versa. Intuitively and theoretically, the findings make sense since rising individual incomes all things being equal increases expenditure which may include healthcare spending. It may also improve nutrition and intake of healthy foods thereby improving one’s living.
The next is the coefficient of birthrate in 1000 population (BR) which is positive 0.397 with a p-value of 0.008. This implies a direct and significant relationship between birthrate and life expectancy. And the interpretation is that, an increase in the number of birthrates per 1000 population by 1 lead to 0.397 increase in life expectancy in years. This results albeit inconsistent with the negative correlation seen in demographic transition model is quite tenable especially in developing countries such as Ghana where high fertility and high mortality characterized the population. The findings are also in line with the human capital theory which propounds that improved investment in human capital in the areas of education and nutrition for instance can increase productivity, incomes and improved birthrate together with increased life expectancy.
Next significant variable is CO2 emissions in tons per capita which has a coefficient of negative (-4.059) and p-value of 0.008. This implies that the relationship between CO2 emissions in tons per-capita and life expectancy is negative, and it is significant at 1%. The interpretation is that an increase in CO2 emissions in tons per capita by 1 lead to a decrease in life expectancy by 4.059 all else constant and vice versa. Higher CO2 emissions leads to extreme temperatures, erratic rainfall patterns, pollutes the atmosphere and melt ice leading to disastrous environmental outcomes, food insecurity, destruction of biodiversity and water bodies which are key to the survival human species. The last significant variable is percentage of the population with access to safe sanitation services. It has a p-value of 0.027 and a coefficient of 1.043, which implies that access to sanitation services is positively and significantly correlated with life expectancy. A 1% increase in the percentage of population with access to safe sanitation services led to 1.043 increase in life expectancy in years all else constant and vice versa. Improved access to safe sanitation services means more of the population have access to safe sanitation services which is key to preventing unsalutary or unhygienic-prone diseases and infections, thereby lowering possible mortalities that may stem from poor sanitation. The remaining variables: employment per total population (EP) and percentage of population with access to safe drinking water (AD) which all have positive correlation with life expectancy were not significant in influencing life expectancy in the model.
Table 2. Long-run ARDL Regression Estimates.
Dependent Variable: LE=Life expectancy
Variable | Coefficient | Standard Error | P-Value |
Health expenditure | -0.022*** | 0.006 | 0.004 |
Per-capita income | 0.001*** | 0.0002 | 0.005 |
Birth rate | 0.397*** | 0.127 | 0.008 |
Employment | 0.052 | 0.058 | 0.385 |
Carbon emissions | -4.059*** | 0.928 | 0.008 |
Access to water | -0.031 | 0.151 | 0.842 |
Access to Sanitation | 1.043** | 0.419 | 0.027 |
Const | 38.395 | 7.974 | 0.003 |
The p-values for coefficients with *, ** and *** implies significant at 10, 5 and 1 percent respectively
Source: Author with WDI data
4.3.2. Short-run ARDL Regression Coefficients Estimates
Here, just like in the long-run regression estimates, five (5) of the variables significant in the long run model were significant whiles the remaining three (3) variables were not significant. The significant positive explanatory variables were current health expenditure per capita, per-capita income, birthrate, C02 emissions per capita and access to sanitation services whiles employment per total population and percentage of population with access to safe drinking water were insignificant. To avoid repetition, the detailed exposition is not done here.
Table 3. Short-run ARDL Regression Estimates.
Dependent Variable: LE = Life Expectancy
Variable | Coefficient | Standard Error | P-Value |
HE | -0.026*** | 0.006 | 0.001 |
K | 0.001** | 0.0003 | 0.016 |
BR | 0.548*** | 0.118 | 0.002 |
EP | 0.060 | 0.063 | 0.358 |
CC | -4.684** | 1.709 | 0.017 |
AD | -0.035 | 0.170 | 0.838 |
AS | 1.204** | 0.375 | 0.007 |
CointEq (-1) | -1.154*** | 0.247 | 0.000 |
The p-values for coefficients with *, ** and *** implies significant at 10, 5 and 1 percent respectively
Source: Author with WDI data
These findings affirm the long-term estimates and the speed of adjustment: CointEq (-1), which is both negative and statistically significant at 1%, providing further evidence of cointegration among the variables. The speed of adjustment indicates the pace at which a variable return to its equilibrium level following a shock, and in this case, the value is -1.223.
The residual equation is CointEq = LE - (-0.022*HE + 0.001*K + 0.397*BR + 0.052*EP -4.059*CC - -0.031*AD + 1.043*AS - 38.395).
Meaning, the residual or error term is the observed LE minus the estimated: (-0.022*HE + 0.001*K + 0.397*BR + 0.052*EP -4.059*CC - -0.031*AD + 1.043*AS - 38.395).
4.3.3. ARDL Cointegration Residual Diagnostic Test
The table below presents the result of the residual test conducted. It includes the serial correlation test, heteroskedasticity and normality test. The p-value for all three were above 10% significance level and therefore all the tests were insignificant, and hence the rejection of all the three-null hypothesis. Implying that there is no autocorrelation and heteroskedasticity, and the residual distribution follows a normal distribution.
Table 4. Residual Test.
Residual | Chi-Square Values | P-Values |
Serial Correlation | 0.412 | 0.550 |
Heteroskedasticity | 0.321 | 0.379 |
Normality | - | 0.584 |
4.3.4. ARDL Bound Wald Test Estimates for Cointegration
The table below captures the ARDL Bound test estimates. It includes the lower and upper bound values, as well as the F-statistic values. The findings indicate that, at a 5% significance level, the variables exhibit cointegration in the long run since the calculated test statistic (2.32) is bigger than the F-Statistic value (1.99). As a result, the null hypothesis that no long-run relationship exist among the variables is rejected. The cointegration of the variables in the long-run means, a change in any of the variables in the model could lead to a collective change in the variables considered, all else constant.
Table 5. ARDL Bound Wald Test Results.
Significance | I0 Bound | I1 Bound |
10% | 2.03 | 3.13 |
5% | 2.32 | 3.5 |
2.5% | 2.6 | 3.84 |
1% | 2.96 | 4.26 |
Test Statistic (F-Statistic value= 1.206; K= 7)
5. Conclusions and Recommendations
5.1. Summary
The study was conducted to investigate the empirical effect of current health expenditure per capita and per-capita income on life expectancy in years in Ghana. It employed an annual time-series secondary data on variables such as life expectancy (LE), per-capita income (K), public health spending per capita (HE), birth rate per 1000 people (BR), population density (PD), employment to population ratio (EP), CO2 emissions per capita (CC), percentage of total population with access to safe drinking water (AD) and access to safe sanitation services (AS) spanning from 1980 to 2020 derived from the World Development Indicators (WDI). The study also examined the annual pattern of life expectancy, current health expenditure per capita, per-capita income, access to safe drinking water and access to safe sanitation services from 2000 to 2021. The Autoregressive Distributed Lag cointegration technique was adopted to estimate the short and long run relationship between the variables after a unit root test was conducted to ascertain the stationarity or otherwise of the variables. Graphs and diagrams were used to present the annual changes in life expectancy, current health expenditure per capita, per-capita income, access to safe drinking water and access to safe sanitation services. The EViews Statistical/Econometric package was used in the analysis. The results of the Autoregressive Distributed Lag cointegration estimates shows that current health expenditure per capita negatively correlated with expectancy rate in years whiles per-capita income is positively correlated with life expectancy rate. All variables modeled were cointegrated.
The variables that were included in the model as control variables include birth rate per 1000 people, population density, employment to population ratio, CO2 emissions per capita, percentage of total population with access to safe drinking water and access to safe sanitation services. The following were the findings with respect to the control variables:
1) There was a direct and significant relationship between birthrate and life expectancy.
2) CO2 emissions in tons per-capita was found to be negatively correlated with life expectancy.
3) The percentage of the population with access to safe sanitation services was also found to be positively correlated with life expectancy.
4) However, employment per total population, population density and percentage of population with access to safe drinking water were not significant in influencing life expectancy.
5) It was found that the highest life expectancy was recorded in 2019 and 2022 at 64.7 years whiles the lowest occurred in 2001 at 58.1 years. And from 2001, the life expectancy rate witnesses a consistent upward jump till 2019 when it declined in 2020 and 2021.
6) For annual per capita income in 1000 US dollars in Ghana spanning from 2000 to 2022. It was found that per-capita income experiences fluctuations over the years with the highest per-capita income recorded in 2021 at 2,400 US dollars and the lowest in 2000, 2001 and 2002 at approximately 300 US dollars.
7) In the case of current health expenditure per capita in US dollars in Ghana spanning from the year 2000 to 2022, it was found that current health expenditure per capita rises consistently from 16.3 US dollars in 2000 to 61.9 in 2009. The highest current health expenditure per capita was witnessed in 2013 at 104 US and the lowest was in 2000 at 16.3 US dollars.
8) Finally for the annual percentage of Ghana’s population with access to safe drinking water and annual percentage of population with access to sanitation services, both were found to have witnessed consistent increase annually albeit slightly between 2000 to 2022.
5.2. Conclusion
This study provides a comprehensive analysis of the impact of public health expenditure and per capita income on life expectancy in Ghana. The findings emphasize the significant role that both health expenditure and income play in shaping life expectancy, although their effects are influenced by various factors such as efficient resource allocation, income inequality, and access to healthcare. The theoretical frameworks, including the Human Capital Theory, Health Production Function, and the Social Determinants of Health, provide a solid foundation for understanding how investments in healthcare and economic growth contribute to improved health outcomes.
Based on the findings, the study concludes that, short and long-run relationship exist between current health expenditure and life expectancy as well as per-capita income and life expectancy in Ghana and all the other explanatory variables including birth rate per 1000 people, population density, employment to population ratio, CO2 emissions per capita, percentage of total population with access to safe drinking water and access to safe sanitation services.
Empirically, the study aligns with previous research that demonstrates a positive relationship between per capita income and life expectancy, highlighting that higher income allows for better access to healthcare, improved nutrition, and overall better living standards. However, the study also underscores that public health spending is crucial for ensuring equitable access to healthcare services, especially in developing countries like Ghana, where disparities in healthcare access and economic inequality persist. Furthermore, environmental factors, such as CO2 emissions, also play a role in influencing health outcomes, which highlights the need for a holistic approach to health policy.
Again, the study also concludes that the percentage increase in life expectancy from 2000 to 2022 is 11.17%. Whiles that of per-capita income and current health expenditure per capita were a staggering 633.33% and 513.50% respectively.
The research recommends targeted policy interventions to address income inequality, improve resource allocation in healthcare, and focus on both preventive and curative healthcare services. Effective public health spending, alongside sustainable economic policies that promote income growth and equitable distribution, can significantly enhance life expectancy and overall population health in Ghana.
5.3. Recommendations
Given the observed negative relationship between current health expenditure and life expectancy, and the positive correlation between per-capita income and life expectancy in Ghana, it is important to formulate policies that mitigate the adverse effect of current health expenditure per capita and life expectancy and those that improve per-capita income to engender higher life expectancy in Ghana. The following recommendations are proposed:
1) The study recommends that implementation and allocation of health expenditure should adopt a nuanced approach based on local health needs and demographic profiles rather than solely increasing overall expenditure.
2) Also, thorough needs assessments must be conducted and funds prioritize towards interventions and services that have proven effective in improving life expectancy metrics, such as preventive care, maternal and child health, and chronic disease management.
3) The study recommends a significant investment in public health initiatives aimed at addressing social determinants of health, such as poverty or income growth and access to sanitation services which were found to influence life expectancy in the study.
4) Promote efficiency in healthcare delivery systems and cost-effective technologies to ensure that resources are utilized effectively.
5) The study recommends the implementation of policies and initiatives that creates stable and decent-paying jobs to help improve household incomes which is a catalyst for improve life expectancy in this study.
By adopting these policy recommendations, governments and health systems can navigate the complex relationship between health expenditure, per-capita income and life expectancy more effectively. This approach ensures that resources are directed towards initiatives that have the greatest potential to enhance population health, increase their income and consequently improve life expectancy outcomes, and ultimately leading to a more sustainable and equitable healthcare system.
Abbreviations
ARDL | Autoregressive Distributed Lag |
GDP | Gross Domestic Product |
LE | Life Expectancy |
K | Per Capita Income |
HE | Public Health Spending per Capita |
BR | Birth Rate |
EP | Employment-to-population Ratio |
CC | CO2 Emissions per Capita, |
SS | Sanitation Services |
WDI | World Development Indicators |
Conflicts of Interest
The authors declare no conflicts of interest.
References
| [1] |
Asenso-Okyere, K., & Osei-Akoto, I. (2017). Health financing in Ghana: A critical review of health financing reforms and their outcomes. Ghana Health Service.
|
| [2] |
Bayati, M., Akbariãn, R., & Kavosi, Z. (2013). Determinants of life expectancy in the Eastern Mediterranean region: A health production function. Comparative Political Economy: Social Welfare Policy eJournal.
http://doi.org/10.15171/ijhpm.2013.09
|
| [3] |
Becker, G. (1964). Human capital: A theoretical and empirical analysis, with special reference to education. University of Chicago Press.
|
| [4] |
Behera, D. K., & Dash, U. (2020). Is health expenditure effective for achieving healthcare goals? Empirical evidence from the South-East Asia region. Asia-Pacific Journal of Regional Science, 4, 593-618.
http://doi.org/10.1007/s41685-020-00158-4
|
| [5] |
Carvelli, A., Scaramozzino, P., Iacoponi, F., Condoleo, R., & Marta, U. Della. (2020). Size, demography, ownership profiles, and identification rate of the owned dog population in central Italy. PLoS ONE, 15.
http://doi.org/10.1371/journal.pone.0240551
|
| [6] |
Case, A., & Deaton, A. (2015). Broken down by income group: A decade of stagnation in life expectancy in the United States. The Journal of Economic Perspectives, 29(4), 1-16.
https://doi.org/10.1257/jep.29.4.1
|
| [7] |
Case, A., & Deaton, A. (2015). Rising morbidity and mortality in midlife among white non-Hispanic Americans in the 21st century. Proceedings of the National Academy of Sciences, 112(49), 15078-15083.
|
| [8] |
Case, A., & Deaton, A. (2015). The health effects of economic development: Evidence from the new international data. Princeton University Press.
|
| [9] |
Dickey, D. A., & Fuller, W. A. (1979). Distribution of the estimators for autoregressive time series with a unit root. Journal of the American Statistical Association, 74(366), 427-431.
https://doi.org/10.1080/01621459.1979.10482531
|
| [10] |
Fuchs, V. R. (1982). The health economy. Harvard University Press.
|
| [11] |
Giarrizzo, T., Andrade, M., Schmid, K., Winemiller, K., Ferreira, M., Pegado, T., Chelazzi, D., Cincinelli, A., & Fearnside, P. (2019). Amazonia: The new frontier for plastic pollution. Frontiers in Ecology and the Environment.
http://doi.org/10.1002/FEE.2071
|
| [12] |
Grossman, M. (2000). The human capital model and health: A theoretical and empirical review. Handbook of Health Economics, 1, 347-408.
https://doi.org/10.1016/S1574-0064(00)80035-6
|
| [13] |
Hamilton, J. D. (1994). Time series analysis. Princeton University Press.
|
| [14] |
Hassan, S. S., Smit, B., & Strydom, J. (2017). Impact of urbanization on air quality and public health: A case study in Ghana. Environmental Health Perspectives, 125(7), 078001-078008.
https://doi.org/10.1289/EHP1486
|
| [15] |
Kakwani, N. C. (2009). Public health expenditure and its effect on health outcomes. Health Economics, 18(4), 471-478.
https://doi.org/10.1002/hec.1369
|
| [16] |
Kamper, S., Apeldoorn, A. T., Chiarotto, A., Smeets, R., Ostelo, R., Guzmán, J., & van Tulder, M. V. (2014). Multidisciplinary biopsychosocial rehabilitation for chronic low back pain. The Cochrane Database of Systematic Reviews, 9, CD000963.
http://doi.org/10.1002/14651858.CD000963.pub3
|
| [17] |
Kawamoto, R., Mochizuki, H., Moriguchi, Y., Nakano, T., Motohashi, M., Sakai, Y., & Inaba, A. (2019). Estimation of CO2 emissions of internal combustion engine vehicle and battery electric vehicle using LCA. Sustainability.
http://doi.org/10.3390/SU11092690
|
| [18] |
Kusi, A., Enemark, U., Hansen, K., & Asante, F. (2015). Refusal to enroll in Ghana’s National Health Insurance Scheme: Is affordability the problem? International Journal for Equity in Health, 14.
http://doi.org/10.1186/s12939-014-0130-2
|
| [19] |
Lynch, J. W., Smith, G. D., & Hillemeier, M. M. (2017). Income inequality, the psychosocial environment, and health: Comparisons of wealthy nations. Lancet, 340(8848), 1387-1393.
https://doi.org/10.1016/S0140-6736(92)92221-M
|
| [20] |
Lynch, J., Smith, G. D., Kaplan, G. A., & House, J. S. (2017). Income inequality and health: The time has come to consider the context of the question. Journal of Health Politics, Policy and Law, 42(5), 1-11.
https://doi.org/10.1215/03616878-4265174
|
| [21] |
Mackenbach, J. P., Kulhánová, I., & Menvielle, G. (2015). Socio-economic inequalities in mortality in Europe. European Journal of Public Health, 25(1), 26-33.
https://doi.org/10.1093/eurpub/cku168
|
| [22] |
Mackenbach, J. P., Kulhánová, I., Menvielle, G., Bopp, M., Borrell, C., Costa, G., & Deboosere, P. (2015). Trends in inequalities in premature mortality: A study of 3.2 million deaths in 13 European countries. Journal of Epidemiology and Community Health, 69(3), 207-217.
|
| [23] |
Mackenbach, J. P., Stirbu, I., & Roskam, A. J. R. (2015). Socioeconomic inequalities in health in 22 European countries. The New England Journal of Medicine, 358(23), 2327-2337.
https://doi.org/10.1056/NEJMsa0707519
|
| [24] |
Marmot, M. (2005). The status syndrome: How social standing affects our health and longevity. Henry Holt and Co.
|
| [25] |
Marmot, M., Allen, J., Goldblatt, P., Boyce, T., McNeish, D., Grady, M., & Geddes, I. (2012). Fair society, healthy lives: Strategic review of health inequalities in England post-2010. The Marmot Review.
|
| [26] |
Montgomery, D. C., Jennings, C. L., & Kulahci, M. (2015). Introduction to time series analysis and forecasting (2nd ed.). Wiley.
|
| [27] |
Preston, S. H. (1975). The changing relation between mortality and level of economic development. Population Studies, 29(2), 231-248.
|
| [28] |
Saleh, K. (2012). The health sector in Ghana: A comprehensive assessment.
http://doi.org/10.1596/978-0-8213-9599-8
|
| [29] |
Stokols, D. (2018). The science of human ecology: A new paradigm for understanding the health implications of environmental stressors. Environmental Research, 154, 195-201.
https://doi.org/10.1016/j.envres.2017.11.002
|
| [30] |
Ussif, R., et al. (2020). Research methodologies: Qualitative, quantitative, and mixed research methods in social sciences. International Journal of Academic Multidisciplinary Research (IJAMR), 4, 83-91.
|
| [31] |
Wang, Q., & Li, L. (2021). The effects of population aging, life expectancy, unemployment rate, population density, per capita GDP, urbanization on per capita carbon emissions. Sustainable Production and Consumption, 28, 760-774.
http://doi.org/10.1016/J.SPC.2021.06.029
|
| [32] |
Whitaker, M., Heath, G., O'Donoughue, P., & Vorum, M. (2012). Life cycle greenhouse gas emissions of coal-fired electricity generation. Journal of Industrial Ecology, 16.
http://doi.org/10.1111/j.1530-9290.2012.00465.x
|
| [33] |
World Health Organization (WHO). (2010). Social determinants of health. WHO Press.
|
| [34] |
World Health Organization (WHO). (2020). World health statistics 2020: Monitoring health for the SDGs, sustainable development goals.
https://www.who.int/data/gho/publications/world-health-statistics
|
| [35] |
World Bank. (2020). World development indicators. World Bank Group.
https://data.worldbank.org/indicator
|
| [36] |
World Bank. (2022). Ghana overview.
https://www.worldbank.org/en/country/ghana
|
| [37] |
World Bank. (2022). Ghana: Health and nutrition. Retrieved from
https://www.worldbank.org/en/country/ghana
|
| [38] |
Zhu, W., Chishti, M., Rehman, A., & Ahmad, M. (2021). A pathway toward future sustainability: Assessing the influence of innovation shocks on CO2 emissions in developing economies. Environment, Development and Sustainability, 24, 4786-4809.
http://doi.org/10.1007/s10668-021-01634-3
|
Cite This Article
-
-
@article{10.11648/j.jbed.20251001.13,
  author = {Ramatu Ussif and Imoru Musah and Ussif Abdul-Aziz Sirin and Jonas Ladime},
  title = {The Nexus Between Per-capita Income and Life Expectancy in Ghana
},
  journal = {Journal of Business and Economic Development},
  volume = {10},
  number = {1},
  pages = {27-44},
  doi = {10.11648/j.jbed.20251001.13},
  url = {https://doi.org/10.11648/j.jbed.20251001.13},
  eprint = {https://article.sciencepublishinggroup.com/pdf/10.11648.j.jbed.20251001.13},
  abstract = {This study explores the relationship between health expenditure per capita, per capita income, and life expectancy in Ghana. Using annual time-series data from 2000 to 2022 provided by the World Development Indicators, the analysis examines variables such as life expectancy, per capita income, public health spending per capita, birth rate, employment-to-population ratio, CO2 emissions per capita, and the proportion of the population with access to safe drinking water and sanitation services. The study also reviews annual trends in life expectancy, per capita income, public health spending, and access to basic services. To analyze short- and long-term relationships among these variables, the research employs the Autoregressive Distributed Lag cointegration approach, preceded by a unit root test to determine stationarity. EViews software is used for the analysis, which includes graphical representations to illustrate trends. The results indicate a negative relationship between health expenditure per capita and life expectancy, while per capita income is positively associated with life expectancy. Cointegration is observed across all variables. Additionally, birth rate and access to sanitation services are positively related to life expectancy, whereas CO2 emissions per capita are negatively associated with it. The study recommends policies focusing on prioritizing health funding, efficient resource allocation, and strategies to increase individual incomes.
},
 year = {2025}
}
 Copy
|
Copy
|
 Download
-
TY  - JOUR
T1  - The Nexus Between Per-capita Income and Life Expectancy in Ghana

AU  - Ramatu Ussif
AU  - Imoru Musah
AU  - Ussif Abdul-Aziz Sirin
AU  - Jonas Ladime
Y1  - 2025/02/27
PY  - 2025
N1  - https://doi.org/10.11648/j.jbed.20251001.13
DO  - 10.11648/j.jbed.20251001.13
T2  - Journal of Business and Economic Development
JF  - Journal of Business and Economic Development
JO  - Journal of Business and Economic Development
SP  - 27
EP  - 44
PB  - Science Publishing Group
SN  - 2637-3874
UR  - https://doi.org/10.11648/j.jbed.20251001.13
AB  - This study explores the relationship between health expenditure per capita, per capita income, and life expectancy in Ghana. Using annual time-series data from 2000 to 2022 provided by the World Development Indicators, the analysis examines variables such as life expectancy, per capita income, public health spending per capita, birth rate, employment-to-population ratio, CO2 emissions per capita, and the proportion of the population with access to safe drinking water and sanitation services. The study also reviews annual trends in life expectancy, per capita income, public health spending, and access to basic services. To analyze short- and long-term relationships among these variables, the research employs the Autoregressive Distributed Lag cointegration approach, preceded by a unit root test to determine stationarity. EViews software is used for the analysis, which includes graphical representations to illustrate trends. The results indicate a negative relationship between health expenditure per capita and life expectancy, while per capita income is positively associated with life expectancy. Cointegration is observed across all variables. Additionally, birth rate and access to sanitation services are positively related to life expectancy, whereas CO2 emissions per capita are negatively associated with it. The study recommends policies focusing on prioritizing health funding, efficient resource allocation, and strategies to increase individual incomes.

VL  - 10
IS  - 1
ER  -
Copy
|
Download