1. Introduction
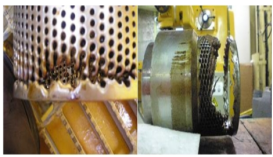
Sand production in oil and gas wells is a common issue, particularly in reservoirs with poorly consolidated sandstone. This typically results from weak cementation during reservoir formation. While sand production can enhance heavy oil recovery by improving flow, it often causes significant challenges. These include formation damage, reduced reservoir-to-well flow, erosion of downhole and surface equipment, wellbore instability, and costly workovers due to equipment failure or sand accumulation, as shown in
Figure 1.
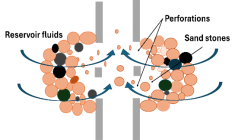
Accurately predicting sand production before drilling is essential to minimize risks and optimize recovery. This requires detailed analysis using well logs, lab tests, production data, acoustic monitoring, and stress analysis. Although several predictive models exist, many fail under specific conditions due to simplifying assumptions. Sand production begins when stress around the wellbore causes the formation to fail, allowing sand grains to detach and move with reservoir fluids, as shown in
Figure 2. These particles must be transported at high enough fluid velocities to prevent deposition in the wellbore. Ultimately, sand production is influenced by reservoir stress, production rates, fluid properties, and operational conditions.
Figure 2. Sand production in a multi-phase well occurs when fluids flowing through the wellbore carry disintegrated sand particles, primarily due to the wellbore being located in a geologically weak or unconsolidated formation.
An effective, efficient, and cost-effective method for managing sand production is closely linked to the initial occurrence of sand production and the rate of sand volume produced. Traditionally, sand production has been linked to consolidated, poorly consolidated, and unconsolidated sand formations. Despite this, Abbasi et al. highlight the absence of established guidelines for choosing a sand production prevention approach. They also explored failure mechanisms such as tensile, shear, cohesive, and pore collapse
| [2] | Abass H. H. (2002). "Sand Control: Sand Characterization, Failure Mechanisms, and Completion Methods", Proceedings of SPE Annual Technical Conference and Exhibition ATCE, 09/2002. |
[2]
. To establish guidelines, numerous mathematical models have been developed and documented to predict sand failure and estimate outcomes. Additionally, chemical-induced failure can occur when cementing materials weaken due to chemical reactions. Abbasi et al. seek to classify sand formations prone to failure and production. Based on this classification, they suggest appropriate laboratory tests, mathematical modeling, and completion techniques
| [2] | Abass H. H. (2002). "Sand Control: Sand Characterization, Failure Mechanisms, and Completion Methods", Proceedings of SPE Annual Technical Conference and Exhibition ATCE, 09/2002. |
| [3] | Palmer I, Vaziri H, Willson S, Moschovidis Z, Cameron J and Ispas I: “Predicting and Managing Sand Production: A New Strategy,” paper SPE 84499, presented at the SPE Annual Technical Conference and Exhibition, Denver, Colorado, USA, October 5-8, 2003. |
[2, 3]
. The efficacy of their method was validated using Saudi sandstone reservoirs, though further studies beyond Saudi Arabia are still needed. Palmer et al. introduced a new approach to predict and control sand production, describing it in three phases: onset, transient, and steady-state. They argued that sanding begins as drawdown or depletion increases in a sand-prone well (onset), followed by a short burst lasting hours to months (transient), and eventually stabilizes at a low level (1-100 pptb) in the steady-state phase but the there approach is not without limitations as shown by the accuracy of their model
| [4] | Djebbar Tiab, ‘‘Advanced Petrophysics Lecture Note: Chapter 7-Effect of Stress on Rock Properties’’, AP (6W) - AUST 2014. |
[4]
. Tiab found that low-porosity clastic formations have high rock strength and proposed porosity as a qualitative indicator of rock strength for sand production prediction. He suggested sand production is likely if the product of two elastic parameters (GKb) falls below 8E11 psi², with shear modulus (G) and bulk modulus (Kb) derived from acoustic and density log data
| [5] | Yi X., Valko P. P. and Russel J. E., ‘‘Predicting Critical Drawdown for the Onset of Sand Production’’, SPE 86555, paper presented at the SPE International Symposium and Exhibition on Formation Damage Control held in Lafayette, Louisiana, USA, 18-20 February, 2004. |
[5]
. Yi et al. noted the availability of various numerical and analytical models for predicting sand onset, which require extensive rock mechanics data often unavailable in field settings and involve complex computations (e.g., finite element models) unsuitable for rapid decision-making
| [6] | Mustafa Adil Issa, Farqad Ali Hadi & Runar Nygaard (2022) Coupled reservoir geomechanics with sand production to minimize the sanding risks in unconsolidated reservoirs, Petroleum Science and Technology, 40: 9, 1065-1083, https://doi.org/10.1080/10916466.2021.2014522 |
[6]
. They developed a simple analytical model based on poro-elastoplasticity theory, assuming shear or tensile stress-induced sanding, using parameters like Biot's constant, Poisson's ratio, Uniaxial Compression Strength (UCS), and in-situ stresses to calculate critical drawdown pressure for a given reservoir pressure
| [7] | Saftić, Kolenković Močilac, I., Cvetković, M., Vulin, D., Velić, J., & Tomljenović, B. (2019). Potential for the Geological Storage of CO2 in the Croatian Part of the Adriatic Offshore. Minerals, 9(10), 577. https://doi.org/10.3390/min9100577 10.3390/min9100577 |
| [8] | Rijken, M. C. M., Cameron, J. A., Jones, C., El-fayoumi, A. M., & Ray, P. (2014). Estimating Sand Production Volume in Oil and Gas Reservoir. SPE Annual Technical Conference and Exhibition. https://doi.org/10.2118/170814-ms |
[7, 8]
.
In addition to the challenge of sand production, there is also the issue of sand control and management. Various authors have proposed heuristics that can be leveraged to address this problem. For example, Osisanya identified sand control as a major challenge in oil and gas fields from recent clastic sediments, particularly Pliocene and younger Tertiary formations, where unconsolidated reservoirs often face sand production issues
| [9] | Osisanya O. Samuel, ‘‘Practical Guidelines for Predicting Sand Production’’, SPE 136980, paper presented at the 34th Annual SPE International Conference and Exhibition held in Tinapa, Calabar, Nigeria, 31 July-7 August, 2010. |
[9]
. Poor completion and production practices in older formations can reduce rock strength and trigger sand failure, with key factors including formation strength, in-situ stress changes, and fluid production rate. Prediction methods include production tests, well-log analysis, laboratory rock testing, and analogy, supported by case studies from the Niger Delta, North Sea, and Gulf of Mexico, emphasizing data like production test results, formation strength, elastic constants, and log data. Adeyanju and Oyekunle developed a coupled reservoir geomechanical model for the Niger Delta under open-hole completion, based on mixture theory with equations for solid matrix, fluidized solid, oil, water, and gas phases, showing that flow rate, confining pressure, drawdown, and fluid viscosity significantly affect sand production
| [10] | Adeyanju O. A. and Oyekunle L. O.,(2010). Prediction of Volumetric Sand Production and Stability of Wellbore in a Niger-Delta Formation. SPE 136965, paper presented at the 34th Annual SPE International Conference and Exhibition held in Tinapa, Calabar, Nigeria, 31 July-7 August, 2010. |
| [11] | Adeyanju O. A. and Oyekunle L. O.,(2011) Experimental Studies of Sand Production from Unconsolidated Sandstone Niger-Delta Petroleum Resevoir, SPE 151008, paper presented at the Nigeria Annual International Conference and Exhibition held in Abuja, Nigeria, 30 July- 3 August, 2011. |
[10, 11]
. Oyeneyin proposed a sand management solution for subsea flow assurance, integrating sand prediction with risk assessment of rock failure, noting that exceeding rock strength with effective stresses leads to failure and sand production, with time to failure, porosity, permeability, and geomechanical properties as critical parameters
| [12] | Oyeneyin M. Babs, ‘‘Total Sand Management Solution for Guaranteed Flow Assurance in Subsea Development’’, SPE 172429, paper presented at the SPE Nigeria Annual International Conference and Exhibition, held in Lagos, Nigeria, 5-7 August, 2014. |
[12]
. Azadbakht et al. modeled volumetric sand production in injector wells, attributing sanding to back-flow, cross-flow during shut-in, and water-hammer pressure pulses, incorporating geomechanics and physics-based criteria
| [13] | Azadbakht S., Jafarpour M., Rahmati H., Nouri A., Vaziri H. and Chan D.,(2012) "A Numerical Model for Predicting the Rate of Sand Production in Injector Wells", SPE 156394, paper presented at the SPE Deepwater Drilling and Completion Conference held in Galveston, Texas, USA, 20-21 June, 2012. |
[13]
. Christiana et al. analyzed a 3D geomechanical model for the Greater Ughelli Depobelt, using offset data to assess sanding conditions, rate, and volume, advocating for tailored field development plans
| [14] | Amiebenomo Hauwa Christiana, Prof Adewale Dosunmu, Prof Joel Ogbonna (2019); Numerical Sand Prediction Model Analysis for Sand Onset, Sand Volume and Sanding Rate; International Journal of Scientific and Research Publications (IJSRP) 9(8) (ISSN: 2250-3153), http://dx.doi.org/10.29322/IJSRP.9.08.2019.p9221 |
| [15] | Kessler, N., Wang, Y., and Santarelli, F. J. (1993). A simplified pseudo-3D model to evaluate sand production risk in deviated cased holes. 68th SPE Annual Technical Meeting, Houston, TX, October. |
[14, 15]
. Rahmati et al. argued that classical elastoplastic models and failure criteria are inadequate for capturing discontinuous localization phenomena, favoring data-driven approaches
| [16] | Al-Awad, N. J., & Al-Misned, O. A. (1997). Rock failure criteria: a key for predicting sand-free production rates. Journal of the Egyptian Society of Engineers, 36(2), 53-58. |
| [17] | Rahmati, H., Nouri, A., Vaziri, H., & Chan, D. (2012). Validation of predicted cumulative sand and sand rate against physical-model test. Journal of Canadian Petroleum Technology, 51(05), 403-410. |
[16, 17]
.
As a result, there has been a shift towards leveraging data-driven techniques and machine learning to tackle this problem
| [18] | Kanj, M. Y., and Abousleiman, Y. (1999). Realistic sanding predictions: A neural approach. Paper no. SPE56631, 1999 SPE Annual Technical Conference and Exhibition, Houston, TX, October 3-6. |
[18]
. Khamechi et al. used Artificial Intelligence to predict sand onset via critical total drawdown (CTD), showing reduced uncertainties
| [19] | Khamehchi, E., Yasrebi, S. V., & Ebrahimi, A. (2014). Prediction of the influence of liquid loading on wellhead parameters. Petroleum Science and Technology, 32(14), 1680-1689. https://doi.org/10.1080/10916466.2011.603003 |
[19]
. Gharagheizi applied the Least Squares Support Vector Machine (LSSVM) to identify sand production conditions, a novel approach
| [20] | Farhad Gharagheizi, Amir H. Mohammadi, Milad Arabloo, Amin Shokrollahi, (2016). Prediction of sand production onset in petroleum reservoirs using a reliable classification approach, Petroleum, Volume 3, Issue 2, 2017, Pages 280-285, ISSN 2405-6561, https://doi.org/10.1016/j.petlm.2016.02.001 |
[20]
. Nguyen leveraged classification techniques and data analysis for sand onset prediction
| [21] | Nguyen, S., Gabry, M. Adel, Soliman, M. Y., Myers, M., and A. Ayman. "Advanced Prediction of Sand Production Onset Using Data Analysis and Machine Learning Techniques: Insights from Adriatic Sea Gas Wells." Paper presented at the Mediterranean Offshore Conference, Alexandria, Egypt, October 2024. https://doi.org/10.2118/223276-MS |
[21]
. Despite these advances, their focus on limited stages (per Palmer et al.,) suggests
| [3] | Palmer I, Vaziri H, Willson S, Moschovidis Z, Cameron J and Ispas I: “Predicting and Managing Sand Production: A New Strategy,” paper SPE 84499, presented at the SPE Annual Technical Conference and Exhibition, Denver, Colorado, USA, October 5-8, 2003. |
[3]
AI’s potential in sand management remains underexplored.
This study presents a comprehensive exploration of sand occurrence, production, and control, addressing the inherent limitations of traditional mathematical models that frequently fall short due to their inability to fully capture the complex physical processes occurring both subsurface and on the surface. These shortcomings often lead to inaccuracies, compelling companies to undertake costly workover operations to rectify the errors stemming from imprecise predictions. To tackle this challenge, the research harnesses the power of data-driven techniques, aiming to enhance predictability and provide a holistic understanding of sand production and control, which could contribute towards alleviating the significant financial cost posed by unexpected sand production in wellbores. The objectives of this research are intricately woven into its core purpose. First, it seeks to develop a sophisticated data-driven model capable of accurately predicting critical drawdown pressure, assessing sanding potential, and estimating production rates with greater precision. Second, the study is committed to validating the results of this model through rigorous testing and analysis to ensure its reliability and practical applicability. Finally, it endeavors to construct a comprehensive decision matrix that will guide the selection and implementation of an effective sand control scheme, tailored to the predicted sand production rates, offering a strategic tool for industry professionals.
2. Methodology
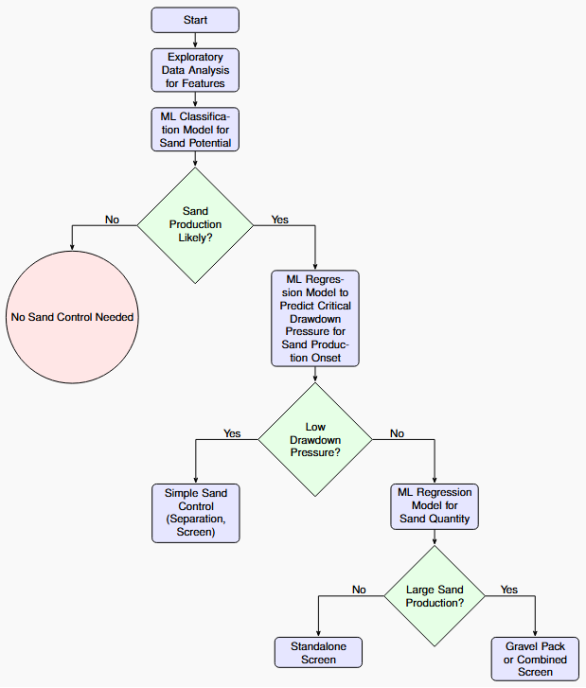
This study presents Artificial Intelligence in sand production and control. This research aims to develop a data-driven model to help predict sanding occurrence, production rate, and potential of wells in the field, which will be used for control scheme selection. The methodology for predicting sand production and determining appropriate control measures in oil and gas wells involves a structured workflow that integrates exploratory data analysis and machine learning techniques. The process, illustrated in
Figure 3, is designed to assess the potential for sand production, estimate the onset and quantity of sand production, and select effective sand control strategies based on reservoir and wellbore properties.
Figure 3. Workflow for sand production prediction and control using machine learning models in this study
1) Exploratory Data Analysis (EDA): The process begins with exploratory data analysis to identify and select relevant features from reservoir and wellbore data that influence sand production. This step involves analyzing parameters such as rock mechanical properties, reservoir pressure, and wellbore conditions to ensure robust input features for subsequent modeling. Feature selection is guided by statistical analysis and domain expertise to enhance model accuracy and interpretability.
2) Machine Learning Classification for Sand Production Potential: A machine learning classification model is developed to determine whether a well is likely to produce sand, framed as a binary classification problem (Yes/No). The model uses reservoir and wellbore properties as inputs to predict the likelihood of sand production. The output of this model directs the workflow: if no sand production is predicted, no sand control measures are required, and the process terminates; if sand production is likely, further analysis is conducted.
3) Prediction of Critical Total Drawdown Pressure: For well identified as having sand production potential, the critical drawdown pressure (CTP) is predicted to estimate the onset of sand production. CTP represents the pressure differential at which sand production begins. This prediction is based on a combination of reservoir properties and well operating conditions. The magnitude of the CTP determines the urgency and type of sand control required.
4) Decision on Sand Control Strategy: The predicted CTP is evaluated to determine if it is low. A low CTP indicates that sand production is unlikely to occur in the near term unless the wellbore pressure drops rapidly. In such cases, simple sand control mechanisms, such as separation, sand monitoring, or basic screens, are implemented. If CTP is high, indicating an earlier onset of sand production, further analysis is required to quantify the amount of sand produced.
5) Machine Learning Regression for Sand Quantity Estimation: For wells with a high CTP, a machine learning regression model is developed to estimate the volume of sand production. This model uses reservoir and wellbore properties to predict the expected sand quantity, providing critical information for selecting an effective sand control method [22-24]. The regression model accounts for variations in production conditions to ensure accurate quantification.
6) Selection of Sand Control Measures: Based on the estimated sand production volume, a final decision is made regarding the sand control strategy. If the predicted sand production is low, a standalone screen is deemed sufficient to manage sand influx. However, if the sand production is significant, more robust measures, such as gravel packs or combined screen systems, are recommended to ensure long-term well integrity and operational efficiency.
This methodology leverages machine learning to provide a data-driven approach to sand production management. By integrating classification and regression models with reservoir and wellbore data, the workflow enables precise prediction of sand production risks and informed selection of control measures, optimizing well performance and minimizing operational challenges.
2.1. Data Analysis
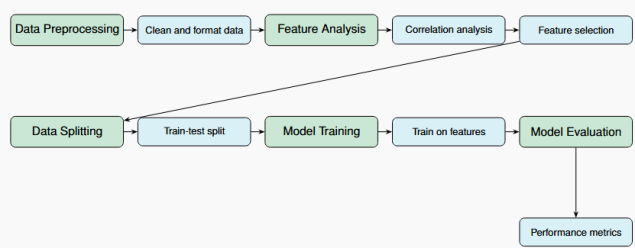
Data analysis alongside machine learning has become an integral part of modern scientific methodology, offering fast automated procedures for predicting a physical phenomenon based on past observations, elucidating underlying patterns in data, and providing insights about the problem. Data analysis will be conducted on field data to select appropriate features to tackle sand production. The steps that will be carried out in this study are shown in
Figure 4.
Figure 4. Workflow for data processing, feature analysis, followed by dataset splitting, model training, and evaluation.
2.2. Sand Potential, Onset, Production Prediction, and Management Scheme
Before a suitable control method can be determined, it is essential to assess whether a given well is likely to produce sand. This assessment, known as sanding potential, depends on key reservoir and wellbore properties. To evaluate this, we employed a Nu-vector classification model. If a well is determined to have sanding potential, the next step is to predict when sand production will begin, a factor known as sand occurrence. A reliable indicator of this is the critical drawdown pressure, beyond which sanding occurs. This parameter is predicted using a Random Forest model. Additionally, the quantity of sand expected to be produced over time is estimated using an AdaBoost model. Together, these models form a predictive pipeline, and their respective outputs can be used to guide the selection of appropriate sand control and management strategies. Details about the different algorithms and reasons for the choices are provided in the sections below. In this study, a deliberate choice was made not to perform an extensive comparison of multiple machine learning algorithms for each predictive task. While the selection of machine learning models can often be guided by the volume of data, the nature of the problem, and computational considerations, prior research has shown that many standard algorithms when appropriately tuned often exhibit comparable performance on structured, tabular datasets such as those used in this work
| [25] | Fernández-Delgado, M., Cernadas, E., Barro, S., & Amorim, D. (2014). Do we need hundreds of classifiers to solve real world classification problems?. Journal of Machine Learning Research, 15, 3133-3181. |
| [26] | Shwartz-Ziv, R., & Armon, A. (2022). Tabular data: Deep learning is not all you need. Information Fusion, 81, 84-90. |
[25, 26]
.
Consequently, representative algorithms were selected for each task based on their robustness, interpretability, and proven applicability in similar engineering and geoscientific contexts:
1) Nu-Support Vector Classification (Nu-SVC) was employed for sanding conditions classification due to its ability to handle non-linear boundaries and imbalanced data effectively.
2) AdaBoost and Random Forest were used for regression tasks related to sand onset and production rate prediction, both known for their high performance on small-to-medium structured datasets and resilience to overfitting.
The primary objective of this work is not to benchmark algorithms, but to demonstrate the feasibility and practical value of integrating machine learning into sand prediction and control workflows. Thus, the focus was placed on developing a functional, explainable pipeline rather than exploring marginal improvements through exhaustive model comparisons.
2.2.1. Nu-Support Vector Classification for Sanding Potential
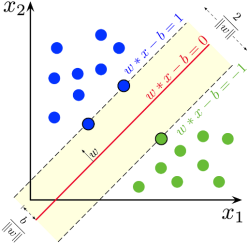
Support Vector Machines (SVM) is a supervised learning technique that may be applied to classification and regression issues. The support vector classifier (SVC) is an SVM-based classifier. The nu-support vector classifier (Nu-SVC), suggested by Schölkopf et al is similar to the SVC but has the added benefit of having a nu parameter to regulate the number of support vectors. Nu-Support vector classification finds the separating hyperplane that splits the vector space into a subset of vectors; each separated subset (so-called data set) is assigned to one class
(See
Figure 5). This model is used to determine the tendency of producing sand from a wellbore based on reservoir and wellbore properties.
2.2.2. Onset Sand Production Prediction Using Random Forest Regression Machine Learning Model
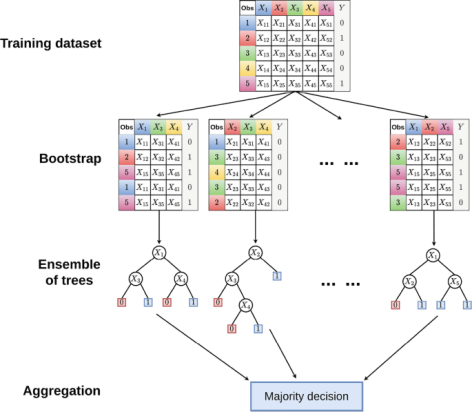
Random Forest Regression is a supervised learning technique that employs an ensemble approach known as Bootstrap and Aggregation, or bagging. This method can address both regression and classification problems by leveraging multiple decision trees. Through ensemble learning, predictions from various machine learning models are integrated to yield more accurate results compared to a single model. The core components of Random Forest include diverse decision trees, each built from sample datasets created by randomly sampling rows and features from the original data. Unlike relying on individual decision trees for regression, the approach combines the outputs of numerous trees to determine the final prediction. This model is highly effective and accurate for tackling various problems, including those with nonlinear relationships, generally producing strong outcomes.
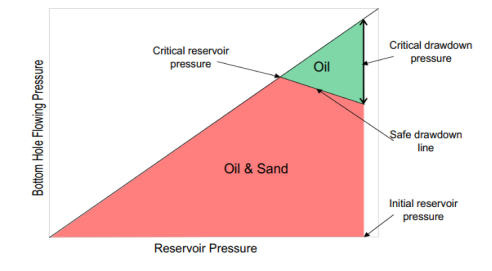
The structure of a Random Forest is depicted in the diagram above. The trees' parallel alignment and lack of interaction are apparent. During training, a Random Forest builds many decision trees and outputs the classes' mean as the prediction of all the trees. The model's hyperparameters will be tweaked to produce precise and highly effective outcomes. This algorithm will be used to predict the critical drawdown pressure, which tells us about the safe regime at which a well would produce oil and gas without any sand, If the drawdown pressure of the well is above the critical drawdown pressure, then sand is expected to be produced alongside the oil, as shown in
Figure 6.
2.2.3. Adaboost Regressor for Sand Production Rate Prediction
The AdaBoost (adaptive boosting) method was the first effective implementation of the concept. Boosting is a type of ensemble machine learning technique that involves aggregating the predictions from multiple weak learners. Very brief (one-level) decision trees are added sequentially to the ensemble as weak learners in the AdaBoost method. The predictions provided by the model that came before it in the sequence are corrected by the model that comes after it. To accomplish this, the training dataset is weighted to place more emphasis on training cases for which previous models made incorrect predictions. The sand production rate will be predicted using this algorithm.
3. Results and Discussion
3.1. Field Data and Analysis
For modelling, a set of data from 31 Northern Adriatic Basin wells reported by Moricca et al. was employed
| [30] | Moricca, G., Ripa, G., Sanfilippo, F. and Santarelli, F. J., 1994, August. Basin scale rock mechanics: field observations of sand production. In SPE/ISRM Rock Mechanics in Petroleum Engineering (pp. SPE-28066). SPE. https://doi.org/10.2118/28066-MS |
[30]
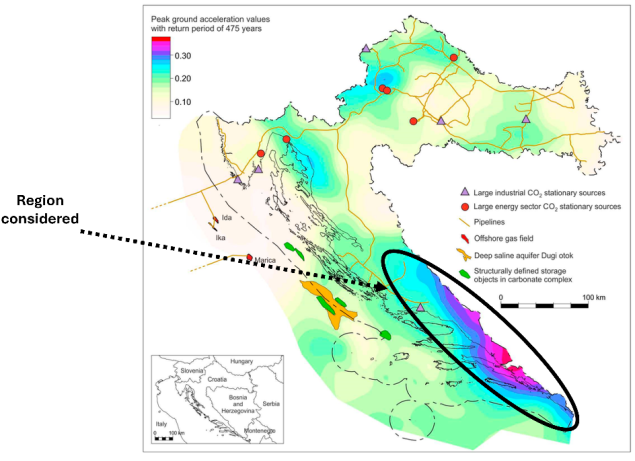
. Geographically, the former Yugoslav republics, Albania, and Italy all border the Adriatic Sea. According to Moricca et al., this region's northern and central parts make up a single geological formation known as the Northern Adriatic Basin
| [30] | Moricca, G., Ripa, G., Sanfilippo, F. and Santarelli, F. J., 1994, August. Basin scale rock mechanics: field observations of sand production. In SPE/ISRM Rock Mechanics in Petroleum Engineering (pp. SPE-28066). SPE. https://doi.org/10.2118/28066-MS |
[30]
. The Northern Adriatic Basin is Italy's primary natural gas supplier. The following information was discovered through comprehensive experimental examinations on core samples and drilled cuttings in several fields of the Northern Adriatic Basin. The porosity of the producing formation ranges from 10 to 40%, and it has a very low permeability between 10 and 100 mD. The vertical column's lithology comprises sand and shale changes, while uncemented clays are present in the formation that produces. The average cohesive strength is 19 kg/cm2.
Figure 8 shows the fields in the Northern Adriatic Basin and the location where the wells are situated.
A comprehensive data analysis was conducted to evaluate the influence of various reservoir and operational parameters on the sanding behavior of wells. The results, presented in
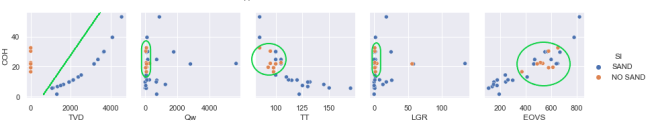
Figures 9 to 12, illustrate the relationships between selected features and sanding conditions. The nomenclature used in the analysis includes BHSP (bottom hole static pressure, kg/cm²), BHFP (bottom hole flowing pressure, kg/cm²), COH (cohesive strength of the formation, kg/cm²), EOVS (effective overburden stress, kg/cm²), Qg (gas production rate, thousand standard m³/day), Qw (water production rate, liters/day), TT (transmit time, microseconds/foot), TVD (true vertical depth, meters), SPF (shots per foot), PERF INT (thickness of the perforation interval, meters), CTD (critical total drawdown pressure, kg/cm²), SI (sand indicator), and SR (sand production rate). This analysis offers insight into the relative importance of these parameters and how they influence sand production tendencies across different well conditions.
Figure 9. The plot of the COH of the formation against Qw, TT, LGR, and EOVS.
The plot of the COH of the formation against Qw, TT, LGR, and EOVS shows that most of the wells with no sand production are those with lower depth, lower quantity of Qw, TT, LGR, and EOVS between 400 and 600. The range of values for COH for these different plots remains constant between 17 and 37. This shows that excessive water production from a well could indicate sand production in the long run.
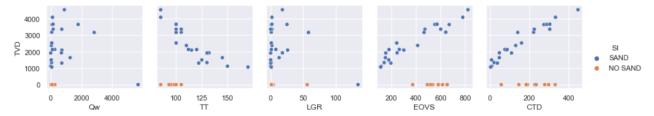
Figure 10. The plot of the TVD of the formation against Qw, TT, LGR, EOVS, and CTD.
The plot of the TVD of the formation against Qw, TT, LGR, EOVS, and CTD shows that most of the wells with no sand production are those with lower depth, lower quantity of Qw, TT, LGR, and EOVS between 400 and 600. The plot between TVD and EOVS and the plot between TVD and CTD show a linear positive relationship, while the plot of TVD and TT shows a negative linear relationship.
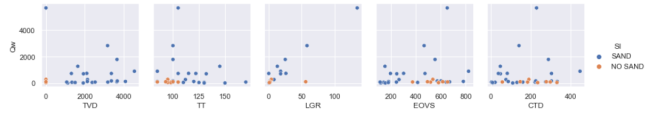
Figure 11. The plot of the Qw of the formation against TVD, TT, LGR, EOVS, and CTD.
The plot of the Qw of the formation against TVD, TT, LGR, EOVS, and CTD shows that wells with no sand production have low TT in the range of 0 to 110, while the plot of CTD just shows a distribution of values without any clear correlation with the sand indicator.
In the bivariate analysis, correlation methods, specifically Pearson’s product-moment and Spearman’s rank, were used to evaluate the strength and direction of relationships between continuous variables
| [32] | Suchmacher, M.; Geller, M. (2012) Correlation and Regression. In Practical Biostatistics: A Friendly Step-by-Step Approach for Evidence-based Medicine; Academic Press: Waltham, MA, USA, 2012; pp. 167-186 |
[32]
. Statistical significance was determined using p-values, where values below 0.05 indicated a rejection of the null hypothesis that no correlation exists
| [33] | Forsyth, D. (2018) Probability and Statistics for Computer Science; Springer: New York, NY, USA, 2018. |
[33]
. Only correlations between input and output variables were assessed, as input-input or output-output dependencies were outside the scope. A Pearson coefficient near +1 or 1 indicates a strong linear relationship, while values close to zero suggest no linear association. However, even significant p-values can occur with near-zero correlation coefficients, possibly indicating a non-linear relationship. In such cases, Spearman’s rank was used as an alternative. Significant correlations (p < 0.05) were prioritized for interpreting the data
| [34] | Swinscow, T. (1976) Statistics at square one: XVIII-Correlation. Br. Med, J. 1976, 2, 680. |
[34]
.
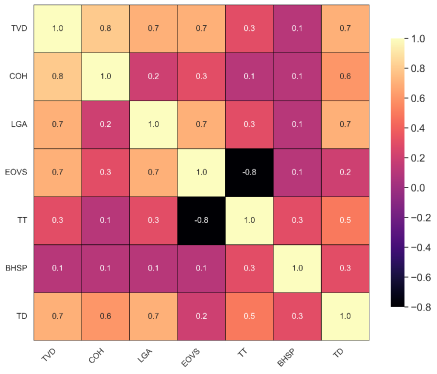
Figure 12 displays a heatmap visualising the attributes' correlation coefficient.
Figure 12. Heat map showing the correlation between features.
With the output on the y-axis and input on the x-axis, the heat map shows that the highest negative correlation of -0.7 is between Transit time (output) and True vertical depth (input) and the highest positive correlation of 0.8 is between Cohesive strength of formation (output) and True vertical depth (input).
3.2. Nu-Support Vector Classification for Sanding Classification
The ν-support vector classification (ν-SVC) algorithm demonstrated strong performance in predicting sanding conditions in this study, providing both accurate predictions and interpretable insights into the well’s state. The dataset was split into training (80%) and testing (20%) subsets, with stratification applied to maintain the original class distribution in both sets, ensuring balanced representation of sanding conditions. Features used in building this model are: TVD, DTC, COH, Qg, Qw, TDD, and EOVS. Hyperparameter tuning was conducted using grid search over parameters including the ν value, kernel type, and gamma coefficient. During model development, five-fold cross-validation was employed on the training data to enhance robustness and prevent overfitting by validating model performance across multiple folds. Model effectiveness was evaluated primarily through the confusion matrix, which compares actual versus predicted classes, allowing detailed assessment of classification accuracy, sensitivity, specificity, and error types. This rigorous process produced a reliable ν-SVC model capable of effectively distinguishing sanding conditions. A binary classification model can be evaluated by extracting several parameters from this matrix, such as true positives (TP), true negatives (TN), false positives (FP), and false negatives (FN). The model's effectiveness was determined by its accuracy (ACC), sensitivity (SE), and specificity (SP).
1) The accuracy (AC) metric assesses and shows the proportion of correctly allocated/ predicted sand production cases.
2) The Sensitivity (SE) is the rate at which the model correctly classifies an observed sanding potential in a well.
3) The Specificity (SP) is the fraction of the correctly classified cases from the population of predictions of sand production.
False positives (FP) are the number of mistakes made when forecasting a case to be "sanding" when field observations are "no sanding"; false negatives (FN) are the number of mistakes made when predicting a case to be "no sanding" when field observations are "sanding". The terms "TP" and "TN" stand for, respectively, "true positive" and "true negative." By assessing the ACC, SE, and SP, the suggested model's final performance was assessed.
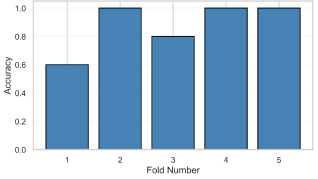
Figure 13. Performance of model prediction in sand occurrence using cross-validation with different numbers of folds.
The five-fold cross-validation accuracy scores illustrate the performance of a machine learning model across five distinct folds as part of a cross-validation process. The average cross-validation score is 0.88, with a standard deviation of 0.16 and test accuracy of 0.57. The x-axis represents the fold number, ranging from 1 to 5, while the y-axis measures the accuracy scores, scaled from 0.0 to 1.0, with 1.0 indicating perfect predictive accuracy. Each bar corresponds to the accuracy achieved by the model on a specific fold, offering insights into its consistency and robustness. The chart demonstrates that the model exhibits a generally high level of accuracy across all five folds, with scores predominantly falling between 0.6 and 1.0. Fold 1 achieves the lowest accuracy, approximately 0.6, suggesting some difficulty in generalizing to this data subset. In contrast, folds 2, 4, and 5 show significantly higher accuracies, each nearing or exceeding 1.0, indicating strong performance on these partitions. Fold 3 records an intermediate accuracy of around 0.8, reflecting a moderate but still reliable outcome. Overall, the 5-fold cross-validation results suggest a model with commendable average accuracy, likely approaching 0.8 or higher, given the distribution of scores. The variation across folds, particularly the lower performance in fold 1, underscores the value of cross-validation in identifying potential weaknesses in model generalization in predicting sand occurrence.
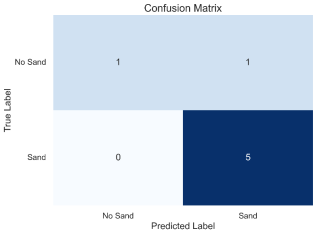
Figure 14. Confusion matrix of average performance across five folds of training.
Table 1. Statistical classification results for the Nu-Support Vector model Classification Model.
| TN | TP | FN | FP | SP | SE | ACC |
Training Data | 18 | 6 | 0 | 0 | 1 | 1 | 1 |
Test Data | 5 | 1 | 1 | 1 | 0.5 | 1 | 0.857 |
The results obtained from the validation of this model show that it can be trained further and deployed in an application.
3.3. Random Forest Model for Critical Drawdown Pressure
The results from the data analysis significantly improved the effectiveness and ease of feature selection. Key features for predicting critical bottom-hole pressure included True Vertical Depth (TVD), Cohesion (COH), Total Thickness (TT), Bottom-Hole Static Pressure (BHSP), Total Depth (TD), Estimated Overburden Vertical Stress (EOVS), and Lithology Group Rating (LGR). A Random Forest Regression algorithm was employed to develop a machine learning model for predicting sanding onset in wells. This ensemble method, based on bagging, constructs multiple decision trees with randomized feature selection, producing an uncorrelated forest of trees and enhancing prediction accuracy. Model performance was evaluated using the Chi-square statistic and Root Mean Square Error (RMSE). The dataset was split into 80% for training and 20% for testing. Hyperparameters were tuned to optimize model performance.
Figure 15. Comparison plot for the random forest model.
The model developed using Random Forest Regressor matches with the actual critical drawdown of the wells tested with an accuracy of 97.65% for the train set, 88.89% for the test data and 95.10% for the combined data set, as shown in
Table 2.
Table 2. Random forest critical draw-down pressure model results.
Model Validation | All | Train | Test |
R2 Score | 95.10% | 97.65% | 88.89% |
Mean Absolute Error | 17.09 | 11.12 | 30.73 |
3.4. Sand Production Rate Prediction
The AdaBoost regressor, a meta-estimator that begins by fitting a regressor on the original dataset and then fits additional regressors on the same dataset, with the weights of instances being adjusted by the error of the current prediction, is used in our novel method for forecasting the rate of sand production
| [35] | Anshuman Das, Sudhansu Ranjan Das, Jyoti Prakash Panda, Abhijit Dey, Kishor Kumar Gajrani, Nalin Somani, Nitin Kumar Gupta (2022). "Machine learning based modelling and optimization in hard turning of AISI D6 steel with advanced AlTiSiN coated carbide inserts to predict surface roughness and other machining characteristics", Surface Review and Letters, 2022. |
[35]
. The features of this model are the logarithm of gas-liquid ratio, water cut, and Reynolds number. The R-score, mean absolute error, and comparison plot are used to evaluate the performance of this model. The dataset was split into 80% for training and 20% for testing. Hyperparameters were tuned to optimize model performance.
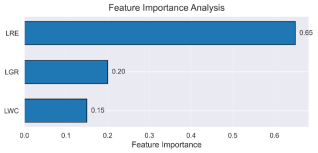
Figure 16. Feature Importance plot.
The feature importance plot shows that the most important factor in the determination of sand production rate is the Reynolds number, which is a function of the oil production rate, viscosity, and density.
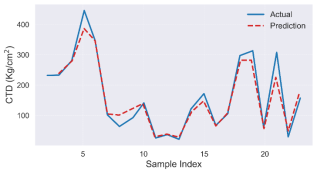
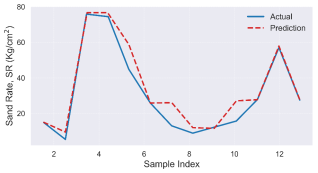
Figure 17. Comparison of actual and predicted sand production rate plot.
Table 3. Sand production rate model validation table.
Model Validation | All | train | test |
R2 Score | 89.31% | 99.51% | 79.07% |
Mean Absolute Error | 5.66 | 0.81 | 14.40 |
The model matches generally with the observed sand production with an accuracy of 99.51%, 79.07% and 89.31% for train, test, and all the data sets, respectively. This production rate can be used to evaluate the mass of sand expected during production, which is a major criterion in selecting an adequate control scheme.
3.5. Control Strategy
Over 70% of the world's oil and gas fields have sand management problems, which have been acknowledged as one of the major problems throughout field development. Sand management involves striking a balance between the risks associated with creating sand at the surface and the risks associated with trying to keep it down in the reservoir (risks related to the environment, safety, process, and cost). Sometimes the choices are not obvious or simple to carry through. Risk management requires accurate analysis of the "Sand Life Cycle," which begins with forecasting formation conditions favourable to sanding and ends with final surface disposal of the created material
| [36] | Tronvoll J. and E. Fjaer (1994), Experimental study of sand production from perforation cavities. International Journal of Rock Mechanics and Mining Sciences & Geomechanical Abstracts, 31, 5, pp. 393-410. |
| [37] | Tronvoll J. (1992), Experimental Investigation of Perforation Cavity Stability. Rock Mechanics, Balkema, Rotterdam, pp. 365-373. |
| [38] | Tronvoll J., M. Nobuo and F. J. Santarelli (1992), Perforation cavity stability: comprehensive laboratory experiments and numerical analysis. SPE paper No. 24799 presented at the 67th. Annual Technical Conference, Washington DC. |
[36-38]
.
Table 4 shows the limitations of different methods used for sand control; hence, a particular control scheme can be chosen based on the predicted/expected sand occurrence, conditions, production rate, and mass predicted using the models developed. Selection is mainly based on limitations of the control scheme and economic analysis.
Table 4.
A review of different sand prevention methods | [36] | Tronvoll J. and E. Fjaer (1994), Experimental study of sand production from perforation cavities. International Journal of Rock Mechanics and Mining Sciences & Geomechanical Abstracts, 31, 5, pp. 393-410. |
Control Method | Major Limitations |
Chemical consolidation | - Some permeability reduction - Placement and reliability issues - Applicable only to short intervals |
Screens, slotted liners, special filters | - Lack of zonal isolation - High placement and workover costs - Longevity of devices - Plugging & screen collapse - Screen erosion - Potential damage during installation |
Inside-casing gravel packing | - Productivity index (PI) reduction - Difficult placement and workovers - High installation cost - Positive skin development |
Open-hole gravel packing | - PI reduction - Operational complexity - Requires extensive under-reaming in most cases |
Propped fracturing (Frac-pack, Stress-Frac, resin-coated sand) | - High installation costs - Challenges in permeability recovery - Risk of tip screen-out during installation - Directional control and tortuosity in inclined wells - Fracture containment control - Proppant flow-back during production |
Selective perforating | - Less effective in homogeneous formations - Requires formation strength data - Reduces inflow area |
Oriented perforating | - Requires full stress mapping - Needs theoretical analysis - Demands perforation tool orientation - Limited field validation |
Production rate control | - Erosion of surface facilities - Continuous sand monitoring required - Requires separation and disposal facilities - Potential production loss |
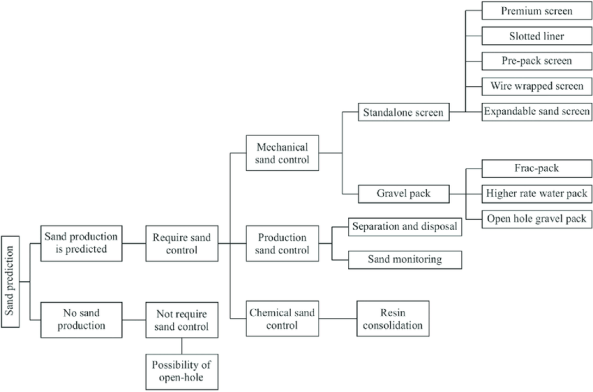
Upon leveraging the predictive capabilities of the developed model to forecast both the likelihood and magnitude of sand production, these projections are then cross-referenced with a meticulously designed decision matrix, as illustrated in
Figure 18. This matrix serves as a strategic guide, integrating critical parameters such as formation characteristics, wellbore conditions, and economic factors to recommend the most efficacious sand control methodology. For instance, in scenarios where the model indicates a low probability of sand production, the matrix may advocate for less invasive techniques such as sand screens or slotted liners, thereby preserving well productivity while minimizing intervention costs. Conversely, for wells predicted to experience significant sand influx, more robust interventions like gravel packing or frac-packing are suggested to ensure long-term stability and optimal hydrocarbon recovery. By adhering to the heuristics encapsulated in
Figure 18 in line with
Figure 3, operators can make informed, data-driven decisions that balance technical feasibility with economic prudence, ultimately enhancing the overall efficiency and sustainability of oil well operations. Different sand control systems have specific limits on the sand production rates they can handle (the amount of sand expected can be obtained using the AdaBoost Model). Accurately identifying the onset of sand production using the Random Forest model helps engineers determine when sanding is likely to begin, enabling them to assess whether a short-term, cost-effective control mechanism is sufficient or if a more expensive, long-term solution is required once it has been established that sand would be produced in the field using the Nu-SVC model.
3.7. Advantages and Disadvantages of Study
3.7.1. Advantages of Study
The output of various fields has been impacted by the problem, which has also decreased the hydrocarbon supply. This paper offers practical and useful methods for predicting sand production that should be incorporated into other applications, saving producing businesses a large amount of money and time on workover operations.
3.7.2. Limitations of the Study
Training this model with more data sets to further increase its performance is necessary.
Summary and Conclusions
Sand control in generated reservoir formations has been the subject of numerous experimental and numerical research projects. The continuum hypothesis, or the discrete element model, is the foundation for most established models. While some models can analyze the sanding-causing variables, others can forecast volumetric behavior. To give a thorough knowledge of the reservoir and well conditions that would deliver the highest sustained healthy productivity, it is vital to identify the critical drawdown pressure and conditions at which sanding occurs. The Random Forest Regression model for Critical drawdown pressure and the Nu-Vector classification model were developed to better forecast the circumstances under which sand is produced. However, no one sand control strategy can be used for all unconsolidated reservoir types. Applying a new sand control technology will increase our understanding of sand management techniques and help us choose the best match for a particular reservoir state. The model was built and tested using data collected from 31 Northern Adriatic Basin wells. The models developed gave an outstanding prediction, and the following conclusion can be drawn based on analysis and studies carried out in this work, which can be used according to the control strategy provided for sand control decision-making. As reservoir pressure declines, the permissible drawdown for sand-free production narrows, necessitating dynamic control adjustments. Regression analysis confirms a statistically significant correlation between critical total drawdown (CTD) and key parameters, including total vertical depth, effective overburden vertical stress, transit time, and cohesive strength, strengthening the predictive framework. The Random Forest Regressor model achieves impressive accuracy, matching actual critical drawdown values at 97.65% for the training set, 88.89% for the test set, and 95.10% for the combined dataset. The AdaBoost model for sand production rate similarly excels, with an accuracy of 99.51% for the training set, 79.07% for the test set, and 89.31% for the full dataset, demonstrating robust performance. Through meticulous data analysis, the study uncovers significant correlations and relationships among sand occurrence, production, and condition prediction features, bolstering model reliability. It also highlights that shear failure across the reservoir due to depletion may lead to unexpected sand production at lower drawdowns than anticipated in initially cemented rock, emphasizing the need for vigilant monitoring. The proposed framework shows great promise for practical application, with evidence suggesting its efficacy in predicting sand production onset in diverse field scenarios. Future work will focus on harnessing optimization techniques potentially to minimize the cost of sand control methods or to implement a sand control approach that permits controlled sand production in exchange for enhanced hydrocarbon output while integrating additional machine learning models. This effort would establish a closed-loop system capable of delivering more accurate predictions and enabling automated, precise decision-making.