Abstract
The global age distribution has undergone substantial changes in recent years due to a rise in life expectancy. Based on projections, the global population of those aged 60 and beyond is expected to reach 2 billion by 2050, representing almost 25% of the total population. By the year 2050, it is expected that the proportion of adults aged 80 years and older will rise by 1% to 4% of the global population. Because of this trend, economic growth may be hampered. The growing reliance on elderly people results in an increase in taxation, while political pressures may cause public funding to be redirected to adult social care. If this option is made, it could be detrimental to both growth and investment. The present study uses panel data from high-income countries to determine if life expectancy is a favorable predictor of economic growth using Granger causality and panel regression. The Hausman test was used to evaluate pooled, random, and fixed effect models in order to determine which model was the most appropriate. Based on the results, the fixed effect model tends to perform better, as indicated by the p-value being less than 0.05. Furthermore, the findings convey that life expectancy has a negative impact on economic growth.
Keywords
GDP, Life Expentancy, Economy, Income
1. Introduction
The age structure of the world has changed significantly in recent years as a result of an increase in life expectancy. Based on forecasts, there will be 2 billion people over the age of 60 in the world by 2050, accounting for nearly 25% of the total population
| [1] | United Nations Economic and Social Council (ECOSOC). (2010). Health literacy and the Millennium Development Goals: United Nations Economic and Social Council (ECOSOC) regional meeting background paper (abstracted). Journal of Health Communication, 15(S2), 211-223. |
[1]
. It is, however, anticipated that the percentage of adults aged 80 years and beyond will experience an increase ranging from one percent to four percent of the world's populace by the year 2050
| [1] | United Nations Economic and Social Council (ECOSOC). (2010). Health literacy and the Millennium Development Goals: United Nations Economic and Social Council (ECOSOC) regional meeting background paper (abstracted). Journal of Health Communication, 15(S2), 211-223. |
[1]
. This development creates concerns about a future decrease in economic growth as increasing old-age dependency rates extend into rising tax burdens and as pressure from politicians may cause public investment spending to be displaced in favor of social spending on older people, which would have a negative impact on investment and growth in productivity. According to the life cycle theory, life expectancy is a significant aspect that influences an individual's economic decisions
| [2] | Zhang, J. and Zhang, J., 2005. The effect of life expectancy on fertility, saving, schooling and economic growth: theory and evidence. Scandinavian Journal of Economics, 107(1), pp. 45-66. https://doi.org/10.1111/j.1467-9442.2005.00394.x |
[2]
. A study
| [3] | Hazan, M. and Zoabi, H., 2006. Does longevity cause growth? A theoretical critique. Journal of Economic Growth, 11, pp. 363-376. |
[3]
argues that life expectancy has both positive and negative impacts on economic growth. Economists are greatly concerned with the complex nature of these effects on the country's economic growth. It becomes essential for them to fully understand the extent of relationships and associations in order to effectively execute policies that address the issues arising from an increase in life expectancy.
Research studies examining the relationship between life expectancy and economic growth mostly focus on two major factors. Extensive research has been conducted on the relationship between life expectancy and economic growth, employing a panel data model
| [4] | Acemoglu, D. and Johnson, S., 2007. Disease and development: the effect of life expectancy on economic growth. Journal of political Economy, 115(6), pp. 925-985. https://doi.org/10.1086/529000 |
| [5] | Bloom, D. E., Canning, D. and Fink, G., 2014. Disease and development revisited. Journal of Political Economy, 122(6), pp. 1355-1366. https://doi.org/10.1086/677189 |
| [6] | Hansen, C. W. and Lønstrup, L., 2015. The rise in life expectancy and economic growth in the 20th century. The EconomicJournal, 125(584), pp. 838-852. https://doi.org/10.1111/ecoj.12261 |
[4-6]
. However, a debate has developed concerning whether the overall effect of life expectancy is advantageous or unfavorable. The second factor being examined relates to the influence of economic growth on life expectancy. Research study investigates the positive correlation between average longevity and GDP per capita, employing a cross-sectional approach
| [7] | Preston, S. H., 1975. The changing relation between mortality and level of economic development. Population studies, 29(2), pp. 231-248. |
[7]
. The visual representation of the relationship between two variables is depicted using a graphical tool commonly referred to as the Preston curve. The Preston curve has been subject to examination in various studies conducted
| [8] | Preston, S. H., 2007. The changing relation between mortality and level of economic development. International journal of epidemiology, 36(3), pp. 484-490. https://doi.org/10.1093/ije/dym075 |
| [9] | Bloom, D. E. and Canning, D., 2007. Commentary: The Preston Curve 30 years on: still sparking fires. International Journal of Epidemiology, 36(3), pp. 498-499. |
| [10] | Dalgaard, C. J. and Strulik, H., 2014. Optimal aging and death: understanding the Preston curve. Journal of the European Economic Association, 12(3), pp. 672-701. |
[8-10]
. Most recent research studies focus primarily on the one-way relationship between life expectancy and economic growth or, alternatively, the relationship between financial assets and life expectancy. There has been limited research conducted on the effects of economic growth on life expectancy using panel data in recent years since COVID 19. In contrast to other scholarly investigations, the main aim of our study is to analyze the magnitude of the effects between life expectancy and economic growth in the past 30 years (1990–2020). This analysis will be conducted using panel data of high-income nations as selected by the World Bank.
In order to evaluate the impact on economic growth, this study includes control variables such as education, government expenditure, and trade openness. Consequently, study objectives were established.
Is life expectancy a reliable indicator of economic growth?
To analyze the effects of life expectancy on economic growth
In order to reach the research objectives, the utilization of pooled regression, fixed effect models, and random effect models will be employed. Additionally, the hausman test will be utilized to determine the optimal model choice between the fixed and random effect models. The research study has been organized as follows: The subsequent section encompasses a comprehensive literature review, followed by an exposition of the research methodology. Subsequently, the analysis and results of the study are presented, ending with a discussion and conclusion of the findings.
2. Review of Literature
The impact of life expectancy on economic growth has been studied in a wide range of theoretical and empirical literature. Despite the dearth of consensus, the prevailing perspectives tend to be solely positive. However, it is important to note that there have also been reports of negative and non-linear associations. The theoretical uncertainty of this effect arises from differing perspectives among scholars. The positive impact is examined through an examination of endogenous growth models proposed by
| [11] | Barro, R. J. and Sala-i-Martin, X., 1992. Convergence. Journal of political Economy, 100(2), pp. 223-251. |
| [4] | Acemoglu, D. and Johnson, S., 2007. Disease and development: the effect of life expectancy on economic growth. Journal of political Economy, 115(6), pp. 925-985. https://doi.org/10.1086/529000 |
| [12] | Madsen, J., 2012. Health, human capital formation and knowledge production: two centuries of international evidence (No. w18461). National Bureau of Economic Research. |
[11, 4, 12]
. These models incorporate health as a key determinant of economic growth, highlighting how increased life expectancy leads to enhanced investments in education and greater knowledge accumulation for individuals over the long term.
The research conducted
focused on analyzing the shifts in the correlation between life expectancy and economic growth across countries with varying levels of ageing. The study utilized panel data from the years 1980 to 2014 to examine the long-term and short-term dynamic relationship between life expectancy and economic growth among different groups. The findings, as reported by
, indicated a significant positive relationship between life expectancy and economic growth. Additionally, the study also observed a positive association between life expectancy and GDP per capita, which aligns with the findings of a previous study conducted by
| [14] | Li, H., Zhang, J. and Zhang, J., 2007. Effects of longevity and dependency rates on saving and growth: Evidence from a panel of cross countries. Journal of Development Economics, 84(1), pp. 138-154. https://doi.org/10.1016/j.jdeveco.2006.10.002 |
[14]
. The analysis conducted a study
, additionally documented that the long-term positive impacts on life expectancy resulting from an increase in savings and human capital outweigh the negative effects stemming from population growth and dependency rates.
On the basis of empirical evidence, there has been a significant difference of opinion among researchers on the significance or effect of life expectancy on economic growth. In their analysis of a study
| [4] | Acemoglu, D. and Johnson, S., 2007. Disease and development: the effect of life expectancy on economic growth. Journal of political Economy, 115(6), pp. 925-985. https://doi.org/10.1086/529000 |
[4]
use expected mortality as an instrument variable to examine the relationship between mid-nineteenth-century economic growth and life expectancy. They make use of GDP per capita and the total GDP to measure the economic growth of a single economy in their empirical study. The researchers observe that the impact of life expectancy on total GDP is comparatively smaller when compared to its impact on the population. Based on the available research, it can be concluded that there is a lack of empirical support for the claim that a rise in life expectancy has a positive impact on GDP per capita. The information presented in this statement is derived from the research conducted by
| [4] | Acemoglu, D. and Johnson, S., 2007. Disease and development: the effect of life expectancy on economic growth. Journal of political Economy, 115(6), pp. 925-985. https://doi.org/10.1086/529000 |
[4]
.
In addition to increasing the investment in physical capital and the growth rate of income per capita, life expectancy also raises the ratio of total savings to production. A fundamental model that incorporates elements from both neoclassical and endogenous growth theories supports the aforementioned finding. This model is empirically tested using panel data from more than 200 nations during the period from 1960 to 2004
| [14] | Li, H., Zhang, J. and Zhang, J., 2007. Effects of longevity and dependency rates on saving and growth: Evidence from a panel of cross countries. Journal of Development Economics, 84(1), pp. 138-154. https://doi.org/10.1016/j.jdeveco.2006.10.002 |
[14]
. Other exogenous variables, such as social security, are taken into account by alternative theoretical models
. Furthermore, the study conducted by
examines the effect of an increase in life expectancy on the investment decisions made by individuals. This investigation is based on a basic endogenous growth model derived from the overlapping generations (OLG) model, which incorporates the growth engine of learning-by-doing and productive knowledge spillovers. Theoretical investigation indicates that an augmentation in longevity is associated with an elevation in the balanced growth rate. However, in many previous theoretical models, life expectancy is typically considered an external scale, with little attention given to the impact of GDP per capita on life expectancy.
Experts widely agree that life expectancy has a crucial role in shaping economic growth by positively influencing investments in human capital. An extended life expectancy is associated with a higher yield on human capital, which in turn promotes increased investment in education and stimulates economic growth. The creation of an overlapping generation model using temporal constants was a part of the study by
. The primary objective was to investigate the influence of life expectancy on human capital investment within the framework of economic growth. The results of their research demonstrate a significant positive association between life expectancy and educational achievement. A study conducted by
| [18] | Zhang, J., Zhang, J. and Lee, R., 2001. Mortality decline and long-run economic growth. Journal of Public Economics, 80(3), pp.485-507. on gambling problems: a comparison of moderate-risk and problem Internet and non-Internet gamblers. J Psychology of Addictive Behaviors. https://doi.org/10.1016/S0047-2727(00)00122-5 |
[18]
with the objective of analyzing the impact of increasing life expectancy on economic growth over an extended period. This analysis was carried out using a two-sector growth model that incorporated the presence of social security. The study's findings suggest that the increase in life expectancy has a positive effect on both investment in human capital and total economic growth.
One of the primary points of focus within theoretical frameworks revolves around the non-linear correlation between life expectancy and economic growth. The study conducted by
| [19] | Boucekkine, R., De la Croix, D. and Licandro, O., 2002. Vintage human capital, demographic trends, and endogenous growth. Journal of Economic Theory, 104(2), pp. 340-375. https://doi.org/10.1006/jeth.2001.2854 |
[19]
uses an Overlapping Generations (OLG) model that features a survival rule that closely reflects real-world conditions. The primary objective of this study is to examine the impact of life expectancy on economic growth. The performed investigation revealed an unclear correlation between the growth of Gross Domestic Product (GDP) and extended longevity. The impact of increased life expectancy on the growth of Gross Domestic Product (GDP) exhibits a positive correlation at lower levels of longevity but shifts to a negative association if a particular threshold is surpassed.
employs an endogenous growth model in his research, which integrates externalities into the process of human capital development. The underlying foundation of this model is rooted in a continuous time overlapping generations (OLG) paradigm. Echevarría's analysis aims to investigate the influence of alterations in life expectancy on the trajectory of economic growth.
underscore the importance of the demographic shift in the association between life expectancy and economic growth. Through a thorough examination, it becomes evident that an increase in life expectancy plays a significant role in driving population growth before the onset of the demographic transition. However, this phenomenon later result in a decline in population growth rates and facilitates the accumulation of human capital in the aftermath of the demographic shift. This observation implies that there is a variation in the association between life expectancy and per capita income between the decades before and after the demographic shift. In the study
, an investigation is conducted into the relationship between life expectancy and economic growth. The study is carried out within the context of an Overlapping Generations (OLG) model that incorporates the concept of familial benevolence. Theoretical research suggests that the presence of bequests can lead to a negative influence on economic growth in the context of an increase in life expectancy. Nevertheless, in the absence of bequests, there is a discernible curvilinear association between life expectancy and economic growth, identified by an inverted U-shaped pattern.
The earlier study demonstrates that diverse approaches and modeling frameworks have been employed, resulting in divergent perspectives regarding the influence of life expectancy on economic growth. Academic researchers tend to place a higher emphasis and allocate more resources toward investigating the relationship between life expectancy and economic growth. The present study examines the correlation between life expectancy and economic growth. This analysis is conducted through a comprehensive evaluation of existing literature, with particular attention given to the disparities in research outcomes observed between populations with distinct age compositions. In contrast to the existing body of literature that explores the relationship between life expectancy and economic growth, there is a lack of research specifically investigating the influence of economic growth on life expectancy following the emergence of the COVID-19 epidemic. In order to broaden the scope of this study, a panel regression analysis was undertaken to investigate the effects of life expectancy and economic growth on high-income countries. Two models were subjected to a comparative analysis, wherein the inclusion of new control variables was undertaken to evaluate their respective impacts. The dataset included in this analysis comprised panel time series data covering the period from 1990 to 2019.
3. Materials and Methods
The methodology of every research project is crucial since it not only provides a clear framework for understanding the results but is also one of its most significant aspects. When conducting research, it is essential for the researcher to clearly explain the methodology applied or adopted while gathering data for the research work. This chapter outlines the approach and procedures employed in the present study. This study will use methodologies such as panel regression for estimating methods, approaches for analyzing the findings, and the Granger causality method.
3.1. Data and Model
This empirical analysis uses 82 World Bank-designated high-income nations. The data was collected for the years 1990–2019. Data from an Excel spreadsheet was imported into E-View for analysis. This study's dependent variable is GDP per capita and the independent variable is life expectancy. Additionally, the control variables considered in this analysis are education, government expenditure, and trade openness. Among the 82 countries established by the World Bank as high-income countries, a total of 26 countries were dropped due to the presence of missing values of over 40%. These countries were clearly distinguished by highlighting them with red color. The red highlights in
Table 1 of the appendix differentiate these countries.
3.2. Panel Regression
ddRegression models estimate how the dependent variable will change when the independent factors change and explain the relationship between the variables. Academic research often uses panel data regression models to explain variable relationships. The null hypothesis was rejected if the p-value was less than 0.05 and the tests had a 95% confidence level. EViews statistics software was used for this investigation's analysis.
Our methods of analysis were obtained as follows;
Pooled OLS.
Fixed Effect Model.
Random Effect Model.
3.2.1. Pooled OLS
In a panel data study, the OLS data model presupposes homogeneity of all sections of the data; that is, it does not treat each section separately. However, it treats each part as a singular unit of data. The measurement set does not possess any distinct traits pertaining to people, and there are no universally observable impacts across time. In summary, pooled regression overlooks the dataset's cross-sectional and time-series variant.
A simple pooled (OLS) model is given as;
Where,
= dependent variable, = independent variable, = intercept / constant, = slope/regression coefficient and = error term.
3.2.2. Fixed Effect Model
The fixed effect model incorporates variability and individuality within distinct cross-sections, thereby allowing each cross-section to have its own intercept. The intercept, although potentially varying across different cross sections, is time-invariant, indicating that it remains constant across time.
The equation for the fixed effects model becomes:
Where,
αi = is unobservable cross-sectional unit/intercept, µt = unobservable time specific effect and = error term.
3.2.3. Random Effect Model
The random effect model is generally referred to as the variance component model. Due to the assumption that data is drawn from a hierarchy of different populations whose differences are related to that hierarchy, it is also sometimes referred to as a hierarchical linear model. This is because it allows for heterogeneity and time invariance even though the individual-specific effect is uncorrelated with the independent variables.
Panel Regression Model:
Where:
3.3. Granger Causality
The Granger causality test is a statistical method of evaluating causation that relies on predictive modeling. As per the concept of Granger causality, when a signal X1 is said to "Granger-cause" or "G-cause" a signal X2, it implies that the past values of X1 possess additional information that aids in predicting X2, beyond what can be predicted only based on the past values of X2. The presence of correlation does not necessarily indicate a causal relationship in a significant manner.
4. Results
This section offers an in-depth examination of an empirical study that examines the effect of life expectancy on economic growth. The findings are analyzed and deliberated upon within the framework of two primary categories: descriptive analysis and inferential analysis.
Table 2 of the appendix presents a descriptive of various statistical measures, including the mean, standard deviation, minimum, and maximum values. GDP per capital with mean (M=1.99, sd=2.73), Life Expectancy (M=77.4, sd=3.44), Education (M=101.407, sd=16.57), Government Expenditure (M=18.619, sd=4.66) and Trade Openness (M=104.19, sd=63.50) as shown in
table 2 of the appendix.
4.1. Ganger Causality
Table 5 shows our Granger causality test results. The Granger causality test results show that the null hypothesis (that life expectancy has no Granger causal effect on GDP per capita growth) is rejected (p < 0.05). As a result, we can conclude that life expectancy predicts GDP per capita growth, although the inverse association fails to be supported (p > 0.05). Similarly, the null hypothesis that schooling has no Granger causal effect on GDP per capita growth (p < 0.05) can be rejected. As a result, education is a strong predictor of GDP per capita growth; however, the inverse relationship fails to be supported (p > 0.05). Meanwhile, we accept the null hypothesis that government spending has no effect on GDP per capita growth (p > 0.05), but the second regression shows that GDP per capita growth is a good indicator of economic growth (p < 0.05). Furthermore, the results suggest that trade openness is a good predictor of economic growth and vice versa (p < 0.000).
4.2. Effect of Life Expentancy on Economy Growth
Model 1: The results of the ordinary least squares (OLS) regression indicate a statistically significant association between life expectancy and economic growth at a significance level of p < 0.05. However, the relationship between life expectancy and economic growth is negative, implying that an increase in economic growth is associated with a decrease of 0.097 in life expectancy. Both the fixed effect model and random effect model yield statistically significant results, indicating that there is a negative relationship between life expectancy and economic growth. The result table presented in
table 3 of the appendix. To determine the optimal model selection between fixed effects and random effects, a Hausman test is conducted. The null hypothesis of this test states that the random effects model is suitable. The alternative hypothesis states that the fixed effect model is suitable.
The p-value obtained from the Hausman test (χ² = 6.19, p = 0.0128) is found to be less than the specified significance level of 5%. As a result, we can reject the null hypothesis and conclude that the fixed effect model is suitable for our analysis. Consequently, our conclusion will be derived from the output of the established model. Hence, it can be stated that a rise in life expectancy has a negative effect on economic growth, resulting in a decrease of 0.2 units in economic growth.
Model 2 is a modified version of Model 1, adding control variables to examine the impact of education, government expenditure, and trade openness on economic growth. The results of the ordinal least squares (OLS) analysis indicate that the p-values for the three control variables are statistically significant at a 5% significance level. This suggests that there is evidence to support the conclusion that life expectancy and government expenditure have a negative impact on economic growth, while education and trade openness have a positive impact on economic growth. The findings of the fixed effect model indicate that life expectancy, education, and trade openness have statistically significant effects on economic growth. Specifically, life expectancy has a negative impact on economic growth, while education and trade openness have positive impacts. However, the variable of government expenditure does not show a statistically significant effect on economic growth within the fixed effect model. The findings of the random effect model indicate that all three control factors and the independent variable are statistically significant at a 5% significance level. However, it is seen that life expectancy continues to have a negative impact on economic growth, while education and trade openness have a positive effect on economic growth. In order to determine the optimal model between the fixed effect and the random effect, a Hausman test is conducted, result table presented in
table 4 of the appendix.
The null hypothesis of this test states that the use of a random effect model is suitable.
The alternative hypothesis states that the fixed effect model is preferred.
The p-value obtained from the Hausman test (chi = 29.81, p = 0.0000) is found to be statistically significant at the 5% level. Thus, we reject the null hypothesis and conclude that the fixed effect model is suitable for model 2. As a result, our conclusion will rely on the output generated by the fixed effect model.
5. Discussion
The present study aimed to check the direction of the relationship between life expectancy and economic growth using a dataset of high-income countries for the period 1990–2019. The use of panel regression was utilized; pooled models, fixed effect models, and random effect models were carried out; and the Hausma test was used to decide the best mode. However, the results reveal that the fixed effect model came out to be the best model for the two models that were performed, both having a hausma p value (p <0.05), which is less than 5% significance level, and the alternative hypothesis was accepted that the fixed effect model is the best. The use of the Granger causality test was urged to evaluate causation that relies on predictive modeling. The outcome of the Granger causality test indicates that the null hypothesis, which suggests that life expectancy does not have a Granger causal effect on GDP per capita growth, is rejected (p<0.05). Therefore, we can infer that life expectancy is a predictor of GDP per capita growth, which means the past values of life expectancy possess additional information that aids in predicting economic growth. The panel regression of the fixed effect model indicates a statistically significant relationship between life expectancy and economic growth at a significance level of p < 0.05. However, the direction of the relationship between life expectancy and economic growth is negative, implying that an increase in economic growth is associated with a decrease of 0.097 in life expectancy. The second panel regression with a control variable in a fixed effect model gives the p-values for the three control variables (education, government expenditure, and trade openness), which are statistically significant for the (p<0.05) at the 5% significance level. This suggests that there is evidence to support the conclusion that life expectancy and government expenditure have an impact on economic growth; however, the direction of the said relationship is negative. While education and trade openness also have a significant impact on economic growth (p>0.05), the direction of the impact is positive.
6. Conclusions
Based on the results of the findings, the researcher found that life expectancy has a negative impact on economic growth, and the control variable, government expenditure, also has a negative impact on economic growth. Meanwhile, the control variables of education and trade openness have a positive impact on economic growth. The study was subject to certain limitations, including a lot of missing value in some high-income countries data provided, which led to the exclusion of such countries. This limitation may have introduced an unbiased approach and made our data a good fit for the models of the present research. However, future research endeavors should aim at identifying the missing values of the dropped countries, filling the missing value with a moving average prediction or other method found good, extending the period, and adding more control variables to the model.
Abbreviations
UN | United Nations |
GDP | Gross Domestic Product |
OLG | Overlapping Generations |
OLS | Ordinary Least Square |
Acknowledgments
I give thanks to God Almighthy and I acknowledge my friends for their support and availability for any support.
Author Contributions
Kayode Okunola: Conceptualization, Resources, Data curation, Methodology, ormal Analysis, Investigation…
Funding
This work is not supported by any external funding.
Data Availability Statement
The data is available from the corresponding author upon reasonable request.
Conflicts of Interest
The authors declare no conflicts of interest.
Appendix
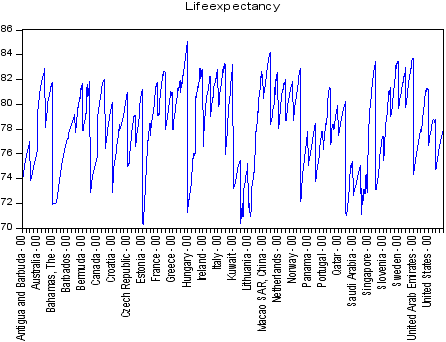
Figure 1. Life expectancy trend across the included countries.
Figure 1 shows the trend of life expectancy across the country, it however visualize a up and down fluctuation across the countries
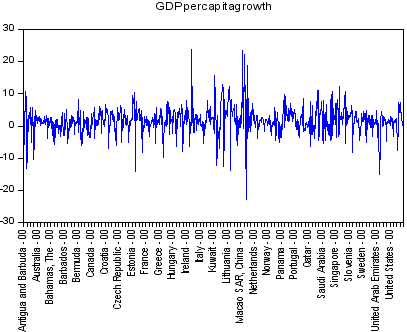
Figure 2. GDP growth trend across the included countries.
Figure 2 shows the trend of GDP per capital growth across the country, it however visualize a up and down fluctuation across the countries. Which means the GDP growth is not stable.
Table 1. List of included country.
American Samoa | Czechia | Japan | Puerto Rico |
Andorra | Denmark | Korea, Rep. | Qatar |
Antigua and Barbuda | Estonia | Kuwait | Romania |
Aruba | Faroe Islands | Latvia | San Marino |
Australia | Finland | Liechtenstein | Saudi Arabia |
Austria | France | Lithuania | Seychelles |
Bahamas, The | French Polynesia | Luxembourg | Singapore |
Bahrain | Germany | Macao SAR, China | Sint Maarten (Dutch part) |
Barbados | Gibraltar | Malta | Slovak Republic |
Belgium | Greece | Monaco | Slovenia |
Bermuda | Greenland | Nauru | Spain |
British Virgin Islands | Guam | Netherlands | St. Kitts and Nevis |
Brunei Darussalam | Guyana | New Caledonia | St. Martin (French part) |
Canada | Hong Kong SAR, China | New Zealand | Sweden |
Cayman Islands | Hungary | Northern Mariana Islands | Switzerland |
Channel Islands | Iceland | Norway | Trinidad and Tobago |
Chile | Ireland | Oman | Turks and Caicos Islands |
Croatia | Isle of Man | Panama | United Arab Emirates |
Curacao | Israel | Poland | United Kingdom |
Cyprus | Italy | Portugal | United States |
Uruguay | Virgin Islands (U.S.) | | |
Table 2. Presents a descriptive summary of the data.
Variables | Mean | Median | Maximum | Minimum | Std. Dev. |
GDPPERCAPITAGROWTH | 1.991171 | 1.946017 | 23.99925 | -23.0421 | 3.732555 |
LIFEEXPECTANCY | 77.39572 | 77.64423 | 85.07805 | 67.18000 | 3.436235 |
EDUCATION | 101.4071 | 99.93547 | 163.9347 | 42.17399 | 16.57377 |
GOVERNMENTEXPENDITURE | 18.61888 | 18.82889 | 39.45063 | 6.500720 | 4.661482 |
TRADEOPENNESS | 104.1877 | 86.58675 | 442.6200 | 19.78645 | 63.50406 |
Table 3. Panel Regression model table.
| Pooled OLS | Fixed Effect Model | Random Effect Model |
Variable | Model 1 | Model 2 | Model 1 | Model 2 | Model | Model 2 |
LIFE EXPECTANCY | -0.09657 | -0.1995 | -0.244889 | -0.448 | -0.18612 | -0.30536 |
| 0.027*** | 0.034*** | 0.044165*** | 0.068*** | 0.037*** | 0.0487*** |
EDUCATION | 0.0215 | | 0.020 | | 0.025598 |
| | 0.007*** | 0.012*** | 0.0097** |
GOVERNMENTEXPENDITURE | -0.1659 | | -0.349 | | -0.23536 |
| | 0.0238*** | 0.0491 | | 0.0347*** |
TRADEOPENNESS | 0.0065 | | 0.024 | | 0.009541 |
| | 0.0016*** | 0.0049*** | 0.0027** |
R -square | 0.0078 | 0.0621 | 0.1666 | 0.2327 | 0.015323 | 0.060358 |
Adjusted R-squared | 0.0072 | 0.0592 | 0.1362 | 0.1956 | 0.014704 | 0.05741 |
F-statistic | 12.5906 | 21.1155 | 5.4861 | 6.2724 | 24.77368 | 20.47479 |
Prob(F-statistic) | 0.0004 | 0.0000 | 0.0000 | 0.0000 | 0.000001 | 0.0000 |
No.obs | 1594 | 1280 | 1594 | 1280 | 1594 | 1280 |
Date range | 1990-2019 | 1990-2019 | 1990-2019 | 1990-2019 | 1990-2019 | 1990-2019 |
Table 4. Hausman test.
Cross-section random | Chi-Sq. Statistic | Chi-Sq. d.f. | Prob. |
Model 1 | 6.190363 | 1 | 0.0128 |
Model 2 | 29.81299 | 4 | 0.0000 |
Table 5. Granger Causality Test on Capital Value of the location.
Null Hypothesis: | F-Statistic | Prob. |
LIFEEXPECTANCY does not Granger Cause GDPPERCAPITAGROWTH | 3.22282 | 0.0401 |
GDPPERCAPITAGROWTH does not Granger Cause LIFEEXPECTANCY | 0.43253 | 0.6489 |
EDUCATION does not Granger Cause GDPPERCAPITAGROWTH | 3.17034 | 0.0424 |
GDPPERCAPITAGROWTH does not Granger Cause EDUCATION | 0.70363 | 0.495 |
GOVERNMENTEXPENDITURE does not Granger Cause GDPPERCAPITAGROWTH | 1.51071 | 0.2211 |
GDPPERCAPITAGROWTH does not Granger Cause GOVERNMENTEXPENDITURE | 4.92923 | 0.0074 |
TRADEOPENNESS does not Granger Cause GDPPERCAPITAGROWTH | 2.91497 | 0.0545 |
GDPPERCAPITAGROWTH does not Granger Cause TRADEOPENNESS | 20.4589 | 2.00E-09 |
References
| [1] |
United Nations Economic and Social Council (ECOSOC). (2010). Health literacy and the Millennium Development Goals: United Nations Economic and Social Council (ECOSOC) regional meeting background paper (abstracted). Journal of Health Communication, 15(S2), 211-223.
|
| [2] |
Zhang, J. and Zhang, J., 2005. The effect of life expectancy on fertility, saving, schooling and economic growth: theory and evidence. Scandinavian Journal of Economics, 107(1), pp. 45-66.
https://doi.org/10.1111/j.1467-9442.2005.00394.x
|
| [3] |
Hazan, M. and Zoabi, H., 2006. Does longevity cause growth? A theoretical critique. Journal of Economic Growth, 11, pp. 363-376.
|
| [4] |
Acemoglu, D. and Johnson, S., 2007. Disease and development: the effect of life expectancy on economic growth. Journal of political Economy, 115(6), pp. 925-985.
https://doi.org/10.1086/529000
|
| [5] |
Bloom, D. E., Canning, D. and Fink, G., 2014. Disease and development revisited. Journal of Political Economy, 122(6), pp. 1355-1366.
https://doi.org/10.1086/677189
|
| [6] |
Hansen, C. W. and Lønstrup, L., 2015. The rise in life expectancy and economic growth in the 20th century. The EconomicJournal, 125(584), pp. 838-852.
https://doi.org/10.1111/ecoj.12261
|
| [7] |
Preston, S. H., 1975. The changing relation between mortality and level of economic development. Population studies, 29(2), pp. 231-248.
|
| [8] |
Preston, S. H., 2007. The changing relation between mortality and level of economic development. International journal of epidemiology, 36(3), pp. 484-490.
https://doi.org/10.1093/ije/dym075
|
| [9] |
Bloom, D. E. and Canning, D., 2007. Commentary: The Preston Curve 30 years on: still sparking fires. International Journal of Epidemiology, 36(3), pp. 498-499.
|
| [10] |
Dalgaard, C. J. and Strulik, H., 2014. Optimal aging and death: understanding the Preston curve. Journal of the European Economic Association, 12(3), pp. 672-701.
|
| [11] |
Barro, R. J. and Sala-i-Martin, X., 1992. Convergence. Journal of political Economy, 100(2), pp. 223-251.
|
| [12] |
Madsen, J., 2012. Health, human capital formation and knowledge production: two centuries of international evidence (No. w18461). National Bureau of Economic Research.
|
| [13] |
He, L. and Li, N., 2020. The linkages between life expectancy and economic growth: some new evidence. Empirical Economics, 58, pp. 2381-2402.
https://doi.org/10.1007/s00181-018-1612-7
|
| [14] |
Li, H., Zhang, J. and Zhang, J., 2007. Effects of longevity and dependency rates on saving and growth: Evidence from a panel of cross countries. Journal of Development Economics, 84(1), pp. 138-154.
https://doi.org/10.1016/j.jdeveco.2006.10.002
|
| [15] |
Echevarría, C. A. and Iza, A., 2006. Life expectancy, human capital, social security and growth. Journal of Public Economics, 90(12), pp. 2323-2349
https://doi.org/10.1016/j.jpubeco.2006.07.001
|
| [16] |
Yakita, A., 2006. Life expectancy, money, and growth. Journal of Population Economics, 19, pp. 579-592.
https://doi.org/10.1007/s00148-005-0017-z
|
| [17] |
Kalemli-Ozcan, S., Ryder, H. E. and Weil, D. N., 2000. Mortality decline, human capital investment, and economic growth. Journal of development economics, 62(1), pp. 1-23.
https://doi.org/10.1016/S0304-3878(00)00073-0
|
| [18] |
Zhang, J., Zhang, J. and Lee, R., 2001. Mortality decline and long-run economic growth. Journal of Public Economics, 80(3), pp.485-507. on gambling problems: a comparison of moderate-risk and problem Internet and non-Internet gamblers. J Psychology of Addictive Behaviors.
https://doi.org/10.1016/S0047-2727(00)00122-5
|
| [19] |
Boucekkine, R., De la Croix, D. and Licandro, O., 2002. Vintage human capital, demographic trends, and endogenous growth. Journal of Economic Theory, 104(2), pp. 340-375.
https://doi.org/10.1006/jeth.2001.2854
|
| [20] |
Echevarría, C. A., 2004. Life expectancy, schooling time, retirement, and growth. Economic Inquiry, 42(4), pp. 602-617.
https://doi.org/10.1093/ei/cbh084
|
| [21] |
Cervellati, M. and Sunde, U., 2011. Life expectancy and economic growth: the role of the demographic transition. Journal of economic growth, 16, pp. 99-133.
https://doi.org/10.1007/s10887-011-9065-2
|
| [22] |
Kunze, L., 2014. Life expectancy and economic growth. Journal of Macroeconomics, 39, pp. 54-65.
https://doi.org/10.1016/j.jmacro.2013.12.004
|
Cite This Article
-
APA Style
Okunola, K., Okunola, B., Adewuyi, O. (2024). Effect of Life Expectancy on Economy Growth for High-Income Nations. Science Journal of Applied Mathematics and Statistics, 12(5), 80-89. https://doi.org/10.11648/j.sjams.20241205.12
 Copy
|
Copy
|
 Download
ACS Style
Okunola, K.; Okunola, B.; Adewuyi, O. Effect of Life Expectancy on Economy Growth for High-Income Nations. Sci. J. Appl. Math. Stat. 2024, 12(5), 80-89. doi: 10.11648/j.sjams.20241205.12
Copy
|
Download
AMA Style
Okunola K, Okunola B, Adewuyi O. Effect of Life Expectancy on Economy Growth for High-Income Nations. Sci J Appl Math Stat. 2024;12(5):80-89. doi: 10.11648/j.sjams.20241205.12
Copy
|
Download
-
@article{10.11648/j.sjams.20241205.12,
  author = {Kayode Okunola and Bolanle Okunola and Oladimeji Adewuyi},
  title = {Effect of Life Expectancy on Economy Growth for High-Income Nations
},
  journal = {Science Journal of Applied Mathematics and Statistics},
  volume = {12},
  number = {5},
  pages = {80-89},
  doi = {10.11648/j.sjams.20241205.12},
  url = {https://doi.org/10.11648/j.sjams.20241205.12},
  eprint = {https://article.sciencepublishinggroup.com/pdf/10.11648.j.sjams.20241205.12},
  abstract = {The global age distribution has undergone substantial changes in recent years due to a rise in life expectancy. Based on projections, the global population of those aged 60 and beyond is expected to reach 2 billion by 2050, representing almost 25% of the total population. By the year 2050, it is expected that the proportion of adults aged 80 years and older will rise by 1% to 4% of the global population. Because of this trend, economic growth may be hampered. The growing reliance on elderly people results in an increase in taxation, while political pressures may cause public funding to be redirected to adult social care. If this option is made, it could be detrimental to both growth and investment. The present study uses panel data from high-income countries to determine if life expectancy is a favorable predictor of economic growth using Granger causality and panel regression. The Hausman test was used to evaluate pooled, random, and fixed effect models in order to determine which model was the most appropriate. Based on the results, the fixed effect model tends to perform better, as indicated by the p-value being less than 0.05. Furthermore, the findings convey that life expectancy has a negative impact on economic growth.
},
 year = {2024}
}
Copy
|
Download
-
TY  - JOUR
T1  - Effect of Life Expectancy on Economy Growth for High-Income Nations

AU  - Kayode Okunola
AU  - Bolanle Okunola
AU  - Oladimeji Adewuyi
Y1  - 2024/11/12
PY  - 2024
N1  - https://doi.org/10.11648/j.sjams.20241205.12
DO  - 10.11648/j.sjams.20241205.12
T2  - Science Journal of Applied Mathematics and Statistics
JF  - Science Journal of Applied Mathematics and Statistics
JO  - Science Journal of Applied Mathematics and Statistics
SP  - 80
EP  - 89
PB  - Science Publishing Group
SN  - 2376-9513
UR  - https://doi.org/10.11648/j.sjams.20241205.12
AB  - The global age distribution has undergone substantial changes in recent years due to a rise in life expectancy. Based on projections, the global population of those aged 60 and beyond is expected to reach 2 billion by 2050, representing almost 25% of the total population. By the year 2050, it is expected that the proportion of adults aged 80 years and older will rise by 1% to 4% of the global population. Because of this trend, economic growth may be hampered. The growing reliance on elderly people results in an increase in taxation, while political pressures may cause public funding to be redirected to adult social care. If this option is made, it could be detrimental to both growth and investment. The present study uses panel data from high-income countries to determine if life expectancy is a favorable predictor of economic growth using Granger causality and panel regression. The Hausman test was used to evaluate pooled, random, and fixed effect models in order to determine which model was the most appropriate. Based on the results, the fixed effect model tends to perform better, as indicated by the p-value being less than 0.05. Furthermore, the findings convey that life expectancy has a negative impact on economic growth.

VL  - 12
IS  - 5
ER  -
Copy
|
Download