2. Urban Planning in a Historical Perspective
The art and science of coordinating land uses, preparing construction sites, and creating communication channels in order to preserve both environmental aesthetics and economic efficiency is another definition of urban planning.
believes that urban planning serves as a roadmap for a town or city's physical development and that its main goal is to provide social and economic well-being for everybody. Additionally, he clarified that urban planning is the systematic arrangement of towns or their portion to guarantee effective and fair socioeconomic functioning and to create an atmosphere that is aesthetically pleasing
.
Urban planning has a long history dating back to the dawn of human civilization
| [12] | K. Gashu and G. Feyisa, “Challenges of Urban Plan Implementation in Small Towns of West Showa Zone, Oromia Regional State, Ethiopia,” Sustain. Reg. Plan., no. December, 2023, https://doi.org/10.5772/intechopen.109122 |
[12]
, although there have been differences in its forms, standards, and quality across time
. Urban planning was originally associated with architectural and public health engineering, and it was considered a physical plan that focused primarily on the layout and physical structure of a town or city in antiquity
| [12] | K. Gashu and G. Feyisa, “Challenges of Urban Plan Implementation in Small Towns of West Showa Zone, Oromia Regional State, Ethiopia,” Sustain. Reg. Plan., no. December, 2023, https://doi.org/10.5772/intechopen.109122 |
[12]
. The welfare of inhabitants in terms of housing, health, social and physical services, and general human comfort is typically the focus of comprehensive urban planning
| [3] | S. Lwasa and C. Kinuthia-Njeng, “Reappraising Urban Planning and Urban Sustainability in East Africa,” Urban Dev., no. April, 2012, https://doi.org/10.5772/35133 |
[3]
. Three approaches to urban planning are used in the modern world: short-term city-wide plans that include the local development plan, medium-term city-wide plans that primarily consist of strategic/integrated development plans, and long-term city-wide plans (master plan, development plan, structure plan, etc.)
.
2.1. Urban Planning Implementation Practices for City Beautification Program
City development should be viewed as a primary goal of urban physical planning, rather than the main focus of urban planning
| [15] | T. K. Ray, “An Analytical Study of City Beautification Program: A Case Study of Kolkata,” no. January 2020, 2021. |
[15]
. A city's physical look is the primary criterion used to assess its standard of living, and this is true for both developed and developing countries.
2.2. Sustainability
A long-term strategy to addressing current demands without sacrificing the ability of future generations, sustainable development ensures a balance between social well-being, environmental preservation, and economic progress
.
Economic Development: The goal of implementing the master plan is to encourage a robust and diverse local economy that is less reliant on any one sector or industry.
Environmental management: Natural resources, including forests, rivers, and wetlands, are being preserved and improved with the goal of creating a green network that links these natural areas to encourage ecological resilience and wildlife movement, as well as to encourage physical activity and enhance the quality of life for locals
| [17] | S. M. Rasoolimanesh, N. Badarulzaman, and M. Jaafar, “City Development Strategies (CDS) and Sustainable Urbanization in Developing World,” Procedia - Soc. Behav. Sci., vol. 36, no. June 2014, pp. 623–631, 2012, https://doi.org/10.1016/j.sbspro.2012.03.068 |
[17]
.
Social Development: A well-designed master plan seeks to reduce urban sprawl and identify ways to accommodate the city's growing population in order to produce a sustainable, livable, and linked urban environment for the development of municipal beautification programs
| [18] | A. Mubaslat, Introduction to Waste Management, no. March. 2021. |
[18]
.
Urban Governance: is the method by which stakeholders and the government choose how to organize, fund, and run urban areas.
2.3. Conservation
According to physical laws, conservation is the preservation, effective use, or conservation of different quantities.
Preservation of Cultural Heritage: The actions done to prolong the life of cultural heritage while bolstering the transmission of its important legacy messages and values are referred to as preservation or conservation.
Monumental Architecture: Large man-made earthen or stone constructions that serve as public facilities or gathering places rather than typical private homes are known as monumental architecture.
Forest and soil management: The process of preserving a forested region is known as forest management. It frequently entails assessing the flora, trees, and soil in a forest ecosystem.
| [19] | M. Cao et al., “Future land-use change and its impact on terrestrial ecosystem carbon pool evolution along the Silk Road under SDG scenarios,” Sci. Bull., vol. 68, no. 7, pp. 740–749, 2023, https://doi.org/10.1016/j.scib.2023.03.012 |
[19]
.
Air quality management: All of the actions a regulatory body takes to assist shield the environment and public health from the damaging impacts of air pollution are together referred to as air quality management.
2.4. Investment Themes
An asset or object purchased with the intention of earning income or appreciation is called an investment.
Land: One of the most significant factors influencing how humanity's physical environment is shaped is land
| [20] | F. Hashemzehi, M. K. Bostani, and M. R. Anvari, “Evaluation of roadside service centers. Case study: Zahedan to,” vol. 7, no. 4, pp. 374–381, 2017, https://doi.org/10.15421/2017 |
[20]
.
Housing: The construction and designated use of homes or structures, either alone or collectively, for the purpose of shelter is referred to as housing, or more broadly, living spaces.
Energy: The quantitative attribute known as energy is transmitted to a body or physical system and is evident in the production of heat and light as well as in the performance of work
.
Urban transport utilities: The movement of people and goods within urban regions is referred to as urban transport. It is the network of several modes of transportation that move people and goods around a city and the nearby suburbs.
Tourism: Travel for pleasure and the business of arranging and facilitating it are both considered forms of tourism.
2.5. Green Infrastructure
A systematic approach to land conservation, green infrastructure addresses the social and ecological effects of open space fragmentation and consumption
| [22] | F. B. Icta-uab and R. B. Alterra, “Green Infrastructure,” no. April, 2015. |
[22]
.
Green Network and Open Space: Natural, semi-natural, and man-made open spaces are combined to form an interconnected network that promotes physical activity and improves accessibility within communities.
Green Spaces: The campaign highlighted how crucial parks, gardens, and green areas are to the urban environment
| [22] | F. B. Icta-uab and R. B. Alterra, “Green Infrastructure,” no. April, 2015. |
[22]
.
Recreation and Open Space: Recreation includes both indoor and outdoor activities that take place in open spaces. The main criteria are that the activity must be useful in some way, either by stimulating, rejuvenating, or relaxing the body, mind, or both
| [23] | U. Henry and A. Chika, “Series 101 Urban land use-land cover change as a strategy in enhancing public recreational open space management in Ibadan, South-western Nigeria,” no. October, 2021. |
[23]
.
2.6. Transportation, and Accessibility
Because accessibility is a user-chosen factor, it can be used to assess how transportation policy and infrastructure investments affect regional growth.
Urban Planning: In order to combat the disorganized and frequently unplanned growth of cities, the movement sought comprehensive urban planning. This covered street designs, zoning laws, and the establishment of open places for leisure.
Urban Mobility Plan:
| [24] | N. Khadour and A. Fekete, “The Role of the Master Plan in City Development, Latakia Master Plan in an International Context,” 2023. |
[24]
states that an urban mobility plan is a planning tool used to specify the strategies that will govern urban mobility in the years to come.
Urban expansion: The act of physically extending the geographic footprints of towns, cities, and metropolitan areas into the surrounding countryside and covering nearby villages is known as urban expansion, according to
.
Roads: Vehicle and pedestrian traffic are the main uses for which roads are designed and constructed. Environmental factors and storm drainage are important concerns. Controls for erosion and sedimentation are designed to avoid negative consequences.
Bridges: A bridge is a construction designed to cross a physical barrier without obstructing traffic below. It is designed to allow passage over the obstacle, which is typically something that would be impossible or very difficult to cross otherwise.
Parking spaces: A paved or unpaved area set aside for parking is known as a parking space, parking place, or parking spot. It may be on a public street, in a parking lot, or in a garage.
2.7. Social Wellbeing
Self-perception has been used to characterize wellbeing. The most common term for this is "subjective wellbeing." According to this viewpoint, wellbeing is typically seen as something that occurs inside a person
.
Access to community resources: 'Community resources' encompasses a broad range of items that could be beneficial to the community. As long as it helps or serves the people in the neighborhood, this may be anything.
Standard of Living: Standard of living, which is typically referred to a community or place rather than a person, is the amount of money, comforts, and services that are available.
Education and health: Health and education are intimately related. Individuals who have lifetime access to high-quality education typically maintain better health than those who do not. One significant social factor of health is thought to be education.
Economic security: The state of having a steady income or other resources to sustain a standard of living both now and in the foreseeable future is known as economic or financial security.
Food and nutrition: Fuel comes from food and nourishment, which gives our bodies energy. Every day, we must replenish the nutrients in our bodies.
2.8. Design and Construction
The building process includes two distinct but connected steps: design and construction. The process of describing a new facility through intricate blueprints and specifications is called design.
Housing Policy: In order to prevent segregation in urban areas, housing policy seeks to accommodate various housing needs while upholding the idea of social and urban diversity.
Green Technology and buildings: Green technology, sometimes referred to as sustainable technology, considers both an item's immediate and long-term effects on the environment.
Maintenance of facility: Create a thorough maintenance schedule to guarantee that the areas that have been beautified stay tidy and appealing over time.
2.9. Water, and Waste Management
Water resource management: is the process of organizing, creating, and overseeing water resources for all water purposes, taking into account both water quantity and quality.
Flood risk management: is a more general word that encompasses risk assessments, flood catastrophe preparation, and mitigation.
Sewage management and drainage system: Drainage systems are in place to remove surplus water from development, including runoff from various sources, floodwater, and rainfall.
Solid Waste management: is the procedure for gathering, handling, and getting rid of solid waste that has been thrown away because it has reached the end of its useful life. It seeks to stop or lessen the negative effects of solid waste on the environment and human health
| [18] | A. Mubaslat, Introduction to Waste Management, no. March. 2021. |
[18]
.
3. Study Methodology
3.1. Description of the Study Area
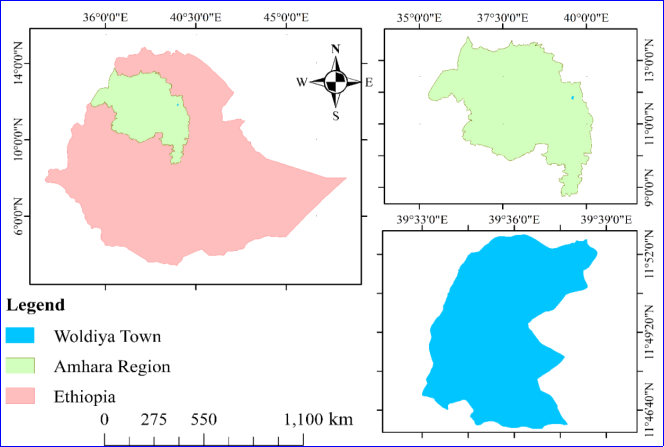
The town of Woldia, located in Ethiopia's Amhara Regional State, serves as the capital of the North Wollo Zone. This settlement is situated in the Amhara Region, north of Dessie and southeast of Lalibela. It is 2112 meters above sea level. Its precise coordinates are 39° 41' 0" East longitude and 11° 50' 0" North height... Ethiopia's capital, Addis Ababa, is 521 kilometers away, and the Amhara National Regional State's seat, Bahir Dar, is 354 kilometers away.
Figure 1. Map of the study area, Source, (Google Map).
3.2. Research Approach
The complete study's planning and execution to accomplish the research goal is covered by the research approach. To gather data for the study's goal, a multi-method approach would be used, including both quantitative and qualitative research. Topic selection and problem identification were the first steps used to accomplish the study's goal, and they were bolstered by an unstructured literature review. Questionnaires are created and sent to the Woldia City municipality after the study area has been determined. Conceptual and contextual literature evaluations are conducted to gain a thorough grasp of the research issue. Results and debates are then presented in order to reach a conclusion and provide suggestions based on the findings.
3.3. Population
The set or collection of all the units to whom the research findings are to be applied is referred to as the population
. Municipalities, urban planners, service providers, housing and urban infrastructure workers, illegal construction workers, policy makers, academicians, and researchers, as well as citizens, financial suppliers and investors, local administrations, city councils, and sub-city and Keble level administrations, were all considered study participants. This is due to the fact that the chosen respondents are familiar with the study's goals.
3.4. Experts Panel Selection and Sampling Technique
There are various ways to choose the panel of experts; the Experts Panel in MCDM methods is a consensus-based method used in this study. However, fifteen decision specialists were chosen for this study based on their expertise, experience, talent, and personal connections. Additionally, the chosen choice experts participated in a series of in-person interviews and targeted group discussions to express their thoughts and opinions. A pairwise comparison matrix can then be used to construct the super decision model. To guarantee that the professionals who were invited were knowledgeable about the super decision v3 software packages applied methodology. Additionally, in order to rank the value of the city beautification initiative, a series of in-person interviews were done with each representative panel of decision experts. Purposive sampling was chosen for this study because it enables the selection of respondents whose experience permits based on the information that is currently available.
3.5. Data Collection Methods
Both primary and secondary sources of data were taken into consideration in order to meet the study's goal.
3.5.1. Primary Data Collection
Initially, this study used a questionnaire survey, document examination, and observation to gather data from primary sources. This study's questionnaire survey was created and assessed using a 9-point Likert scale to gauge decision experts' opinions. Super Decisions v3 and Microsoft Excel were utilized as statistical analysis tools.
3.5.2. Secondary Data Collection
In the next part, to complement these primary sources, secondary source of data was used including annual reports of the municipality on urban plan of the town. The method of data collection were extracted according to what was mentioned in the previous studies that are suitable for carrying out the current study and was defined in the literature to answer the research question. The basic information related to city master plan execution would identify through literature review and document analysis.
The following section utilizes secondary sources of information, such as the municipality's annual reports on the town's urban plan, to supplement these primary sources. According to what was said in earlier research that is appropriate for conducting the current study and was defined in the literature to address the research issue, the data collection method was taken from the literature. Through document analysis and literature investigation, the fundamental details pertaining to the implementation of the city master plan will be found.
3.6. Data Analysis
Super Decisions need essentially the same processes to get a choice as the AHP approach. The following is a summary of these steps:
1). Construct a decision model: Divide the choice into a hierarchy of objectives, standards, and substandards.
2). Determine the criteria's priorities: To determine the weights of the criteria, their relative importance to the intended purpose is evaluated pairwise. Next, we examine the judgments to make sure there is an acceptable degree of consistency in terms of proportionality and transitivity. This is known as consistency checking.
3). Determine the subcriteria's priorities: Determine the subcriteria's priorities (preferences) in relation to each criterion (using a similar procedure as the preceding step, that is, comparing the subcriteria pairwise with regard to each criterion). Verify the consistency and make any necessary adjustments.
4). Reaching a final decision: A choice can be made in light of the findings.
4. Numerical Data Analysis
4.1. Demographic Analysis
Table 1 provides a summary of the attributes of the survey participants. Project managers made up 26.67% of the workforce, followed by civil engineers (33.33%), surveyors (20.00%), and lead engineers (20.00%), as seen in
Table 1. According to the respondents' educational background, 46.67% had an MSc or above, and 53.33% had a bachelor's degree. With respect to job experience, 40.00% of respondents have between 11 and 15 years of experience, and 60.00% have between 5 and 10 years.
Table 1 provides a brief description of the material that the expert panel gave.
Table 1. The expert panel’s background descriptions.
Category | Profile | No. of Respondents | Percentage (%) | Category | Profile | No. of Respondents | Percentage (%) |
Education level | Bachelor Degree | 8 | 53.33% | Work Position | Project Manager | 4 | 26.67% |
MSc. and above | 7 | 46.67% | Civil Engineer | 5 | 33.33% |
Work experience | 5–10 years | 9 | 60.00% | Surveyor | 3 | 20.00% |
10–15 years | 6 | 40.00% | Lead Engineer | 3 | 20.00% |
4.2. Developing a Model
Creating a hierarchical model for the choice is the first stage in an AHP analysis. Creating a hierarchical model for the choice is the first stage in an AHP analysis. A screen with an information panel on the left and a blank screen panel on the right-the model section-is displayed when the software first launches. This is where you construct a decision hierarchy. To construct the model, follow these steps: Press the

button located directly above the "information panel" label in the upper left corner of the screen. Halfway through the information panel section, the message "Creating new cluster" would show up.
According to Super Decisions terminology, every level of the hierarchy is regarded as a cluster. Unlike earlier software versions, Super Decisions v3 distributes the cluster from left to right (tree view) instead of top down. Click "Add more" after giving the first cluster the name "Goal." For every cluster, repeat these steps. Three clusters or groupings for the Goal, Criteria, and sub-criteria must be created. To complete the cluster building procedure, click "Save" after creating the final cluster ("Sub-criteria"). To keep everything organized, you can pick any cluster and move it about on the empty screen.
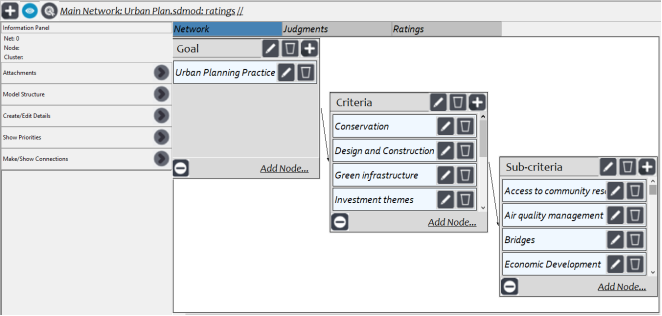
Use the "Add more" option to add nodes to a cluster until the final node is added, and then select "Save." Within the cluster goal, we have established a node named "Urban Planning Practice." To establish the nodes "sustainability, conservation, investment themes, green infrastructure, transportation, and, accessibility, social wellbeing, design and construction, water, and waste management" within the cluster criteria, we will then repeat this process. Lastly, as illustrated in
Figure 2, we will construct the matching nodes within the cluster sub criterion.
Figure 2. Node connections for “Urban Planning Practice”.
The goal node (in our example, "Urban Planning Practice") is located in the leftmost cluster, "GOAL," which makes up the first level of the hierarchy. The specific criteria nodes to be used are located in the second level (cluster "Criteria"), and the sub criteria nodes to be evaluated are found in the third level (cluster "sub criteria").
Connecting the nodes is the next stage in building the model with Super Decisions. Moving from left to right makes this task easier. The objective node ("Urban Planning Practice") in the model can be selected (clicked) with the mouse. A dialog box will then emerge after selecting the "make/show connections" button in the information panel.
Figure 2 illustrates how to use the cursor to pick all criteria nodes to which you wish to attach the "Urban Planning Practice" node.
To make sure it was correctly selected, click outside the selection area (that is, in the blank space just beneath the "Urban Planning Practice" checked option) after ticking the box for the final node to be connected. All of the checkmarks will have the same appearance as in
Figure 3 if this is done. You can exit this window by selecting the "make/show connections" option once you have made all the connections you want. The following observations should be kept in mind when making the connections:
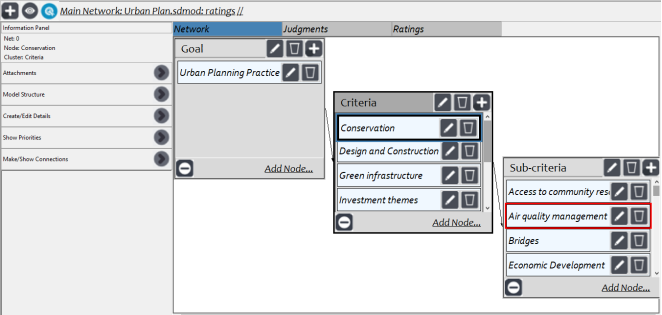
Figure 3. The node “Urban planning implementation practice” connected to each criterion.
Figure 4. Final hierarchy for “Urban Planning Practice”.
Note that you must press the third button

from left to right on the top horizontal bar above "information panel" in order to see the connections that have been formed. This button will turn blue

when it is pressed. The application will then frame all of the nodes that "Urban Planning Practice" is connected to in red once you use the cursor to pick the "Urban Planning Practice" node. "Urban Planning Practice" is linked to all of the Criteria and nothing else, as shown in
Figure 4, which is accurate for our AHP model. The software only displays one arrow from the target cluster to the criteria cluster rather than three arrows for each link for simplicity's sake and to keep the screen from becoming cluttered, but the red frame makes it obvious which nodes are connected. Then, following the previously described process, connect each node in the criterion cluster to every node in the alternatives cluster and confirm that they are correctly connected.
Figure 4 displays the final hierarchy.
Deriving Priorities (Weights) for the Criteria
The weight (importance) of each criterion will vary. Determining the relative priority (weights) for the criteria is thus the next stage in the AHP process. As we will see in the discussion that follows, the criteria weights are measured in relation to one another, which is why it is called relative. Since we are going to be working on the model we have just created, we can close the information panel section by pressing the [

] button (which is the middle button in the left part of the software screen, right on top of the information panel). When pressed, it will turn blue like the other icons in this area and dismiss the information panel section to make more space on the screen for the model. When necessary, we can press this icon to open or close the information panel area.
In order to compare the criteria nodes pairwise, use the cursor to choose the "Urban planning practice" node in your model. Next, select "Judgments" from the top menu. It will display the screen in
Figure 5. The three panes (left, center, and right) that are shown will be explained in more detail below.
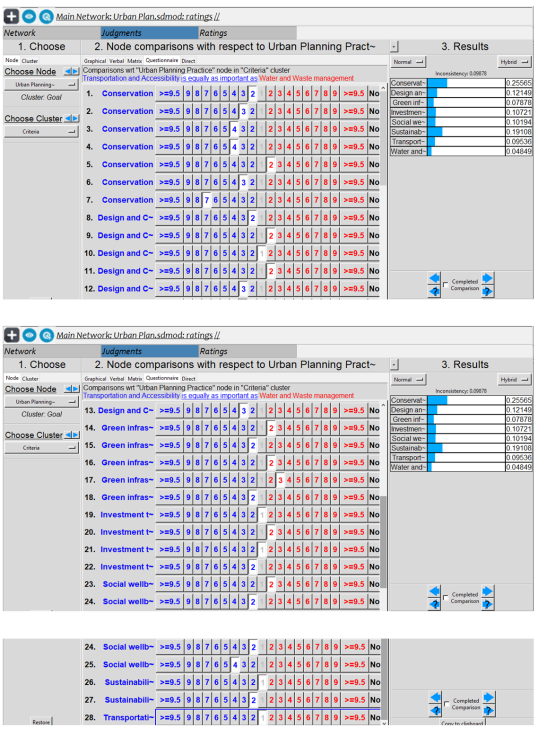
Figure 5. Comparison of criteria with respect to the “Urban Planning Practice” node.
On the left side of the screen when comparing the nodes in the Cluster Criteria pairwise,
Figure 5 shows that the "urban planning practice" node from the Goal Cluster of the Goal node will serve as the benchmark. In questionnaire mode, the criteria can be compared pairwise (with reference to the "urban planning" node) in the middle pane of the screen.
As seen in the comparison screen (middle pane of
Figure 5), each judgment is entered using the comparison option of your choice.
Figure 5 illustrates how the determined priorities show up in the comparison interface's right pane once all comparisons have been completed. By choosing the intensity levels that match to each comparison, the experts' comparative assessments are displayed in
Figure 5.
For instance, the second comparison (shown by the number 2 on the left) demonstrates that conservation is equally to somewhat more significant than design and building in terms of "urban planning practice." because the "conservation" section of the questionnaire has an intensity of 2. Until all eight pairwise comparisons have been completed, the decision-maker must input the intensity assessments for each comparison.
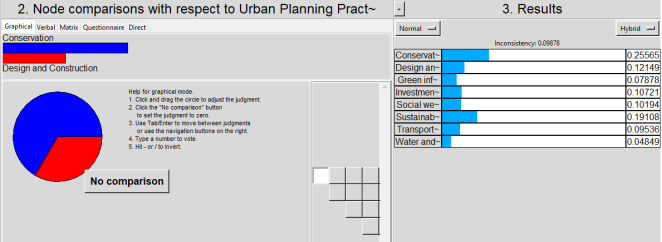
The weight values extracted from the Super Decision algorithm are displayed in
Figure 5. The values of the primary criteria of sustainability, conservation, investment themes, green infrastructure, accessibility, social wellbeing, design and construction, water, and waste management add up to one when looking closely at
Figure 5. Once more, it is evident that every sub-criterion beneath every primary criterion adds up to one in its own set. Upon analyzing the weight data, it is evident that the conservation major criterion has the highest priority value (0.255).
However, we need to be sure that the consistency ratio is smaller than 0.10 before we can consider these priorities as legitimate. The consistency of 0.098, as shown in the right pane of the nodes comparison interface, is significantly less than the suggested threshold of 0.10. Design and construction (0.121), investment themes (0.107), and sustainability (0.191) were the next most important criteria for urban planning practice. The primary criteria with the lowest weight value were found to be water and waste management (0.048), transportation and accessibility (0.095), social welfare (0.101), and green infrastructure (0.078).
We can compare using Super Decisions v3 in four distinct ways: graphical, verbal, matrix, and questionnaire. This lets us select the style that works best for us. By selecting the "Graphical" tab in the middle pane, you may also view our comparisons graphically. The example of a graphical comparison between "conservation" and "design and construction" is presented in
Figure 6. Instructions for using the graphical user interface interactively are provided in this pane.
Figure 6. Graphic comparison of two criteria: Conservation, and Design and construction.
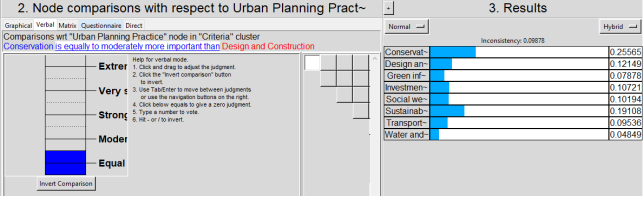
Figure 7 displays the language comparison between "conservation" and "design and construction." By selecting the "verbal" tab at the top of the center pane, you can switch to this mode. Because the colored selection falls between these two assessments, you can see in
Figure 7 that, in terms of our objective for urban planning practice, we have determined that the "conservation" of the urban plan is equally to somewhat more essential than "design and construction." Additionally, note that the software does this internally, so we don't need to consider any way to translate spoken assessments into numerical numbers.
Figure 7. Verbal comparison of “conservation” and “design and construction”.
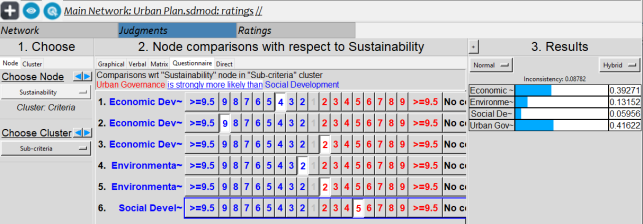
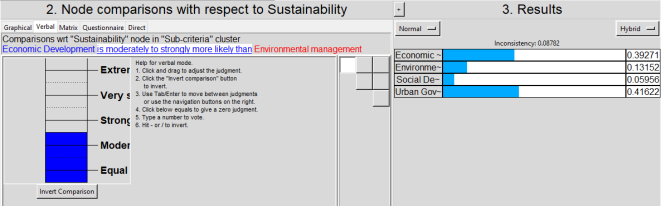
Figure 8. Comparison of criteria with respect to the “Sustainability” node.
As seen in the comparison screen (middle pane of
Figure 8), each judgment is entered using the comparison option of your choice. As illustrated in
Figure 8, the computed priorities show up in the comparison interface's right pane after all comparisons have been completed. By choosing the intensity levels that match to each comparison, the experts' comparative assessments are displayed in
Figure 8. For instance, the comparison (shown by the number 4 on the left) demonstrates that economic development is somewhat to considerably more likely than environmental management in terms of "sustainability." because the "economic development" section of the questionnaire has an intensity of 4. The intensity evaluations for each of the six pairwise comparisons must be entered by the decision-maker until all comparisons have been finished. The Super Decision program's weight values are displayed in
Figure 8. The values of the sub criterion for economic growth, environmental management, social development, and urban governance add up to one when looking closely at
Figure 8.
Examining the weight results, it can be observed that the subcriterion with the highest priority value (0.416) is urban government. However, we need to be sure that the consistency ratio is smaller than 0.10 before we can consider these priorities as legitimate. The consistency of 0.087, which is greater than the suggested threshold of 0.10, is displayed in the right pane of the nodes comparison interface. Environmental management (0.131) and economic development (0.392) were the next most important urban planning practice criterion. In contrast, the primary criterion with the lowest weight value was found to be social development (0.059).
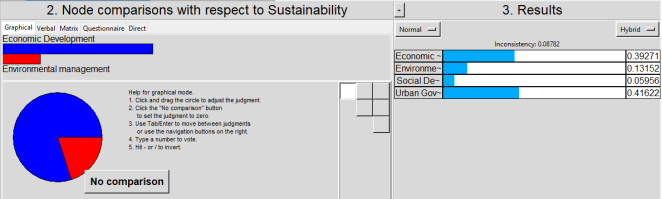
We can select the style that is most comfortable for us because Super Decisions v3 offers four distinct ways to compare: graphical, verbal, matrix, and questionnaire. You can also view our comparisons graphically by selecting the "Graphical" tab in the middle pane.
Figure 9 illustrates the case of the graphical comparison between "environmental management" and "economic development." The graphical interface's usage instructions are provided in this pane.
Figure 9. Graphic comparisons of two criteria: Economic development and Environmental management.
In
Figure 10, "economic development" and "environmental management" are verbally compared. Clicking the "verbal" tab at the top of the center pane will allow you to enter this mode.
Figure 10 shows that, in relation to our objective of sustainable practice, we have determined that "economic development" is just as strong as "environmental management," as indicated by the colored selection between these two judgments. The software does this internally, so we don't need to consider any way to translate spoken assessments into numerical numbers.
Figure 10. Verbal comparison of “economic development and environmental management”.
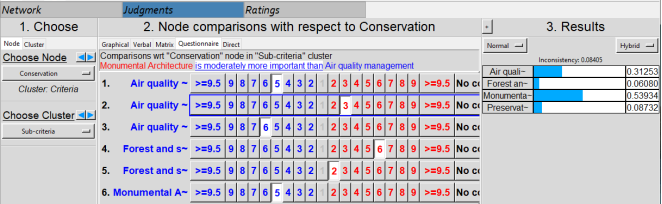
Figure 11. Comparison of criteria with respect to the “Conservation” node.
As seen in the comparison screen (middle pane of
Figure 11), each judgment is entered using the comparison option of your choice.
Figure 11 illustrates how the determined priorities show up in the comparison interface's right pane once all comparisons have been completed. By choosing the intensity levels that match to each comparison, the experts' comparative assessments are displayed in
Figure 11. For instance, the comparison (shown by the number 5 on the left) demonstrates that, in terms of "conservation," managing air quality is far more crucial than managing forests and soil.
Due to the fact that the "air quality management" section of the questionnaire offers five intensity options. Until all six pairwise comparisons have been completed, the decision-maker enters the intensity judgments for each comparison. The Super Decision program's weight values are displayed in
Figure 11. Examining
Figure 11 closely reveals that the values of the sub-criteria for air quality management, forest and soil management, monumental architecture, and cultural heritage protection add up to 1.
An analysis of the weight data reveals that the sub criterion with the highest priority value (0.539) is monumental architecture. But before we can consider these priorities as legitimate, we need to make sure that the consistency ratio is below 0.10.
The nodes comparison interface's right pane shows a consistency of 0.084, which is significantly higher than the suggested value of 0.10. Air quality management was in compliance with the monumental architecture sub criteria (0.312).
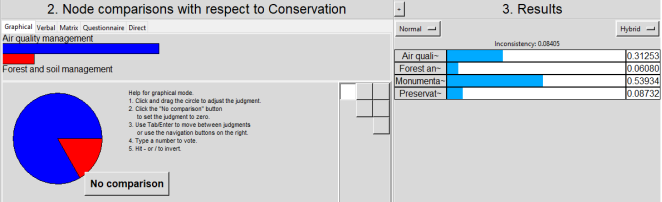
Conversely, the sub criteria with the lowest weight value were found to be air quality management (0.06) and cultural heritage preservation (0.087). We can compare using Super Decisions v3 in four distinct ways: graphical, verbal, matrix, and questionnaire. This lets us select the style that works best for us. By selecting the "Graphical" tab in the middle pane, you may also view our comparisons graphically. The example of a graphical comparison between "economic development" and "environmental management" is presented in
Figure 12. Instructions for using the graphical user interface interactively are provided in this pane.
Figure 12. Graphic comparisons of two criteria: air quality management and forest and soil management.
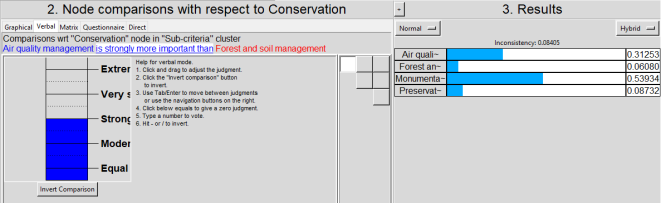
Figure 13. Verbal comparison of “air quality management and forest and soil management”.
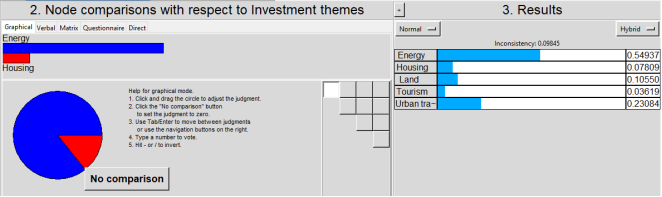
Figure 14. Comparison of criteria with respect to the “Investment themes” node.
Figure 13 compares "air quality management" with "forest and soil management" verbally. You can switch to this mode by selecting the "verbal" tab at the top of the center pane.
Figure 13 shows that, in terms of our conservation objective, we have determined that "air quality management" is significantly more significant than "forest and soil management" because the colored selection falls between these two conclusions. Also, note that the software does this internally, so we don't need to consider any way to translate spoken assessments into numerical numbers.
The comparison panel (middle pane of
Figure 14) displays the comparison mode you have selected for each decision. The determined priorities show up in the comparison interface's right pane when all comparisons have been completed, as seen in
Figure 14. Expert comparison assessments are displayed in
Figure 14, where the intensity levels corresponding to each comparison are chosen. Regarding "Investment themes," for instance, the contrast (shown by the number 6 on the left) demonstrates that energy is significantly more significant than housing.
Given that the "energy" section of the questionnaire has an intensity of 6. Up until all 10 pairwise comparisons are finished, the decision-maker enters the intensity judgments that correspond to each comparison. The weight values extracted from the Super Decision algorithm are displayed in
Figure 14. The values of the sub criterion of land, housing, energy, urban transit utilities, and tourist add up to one when looking closely at
Figure 14. Upon analyzing the weight data, it is evident that the energy sub criterion has the highest priority value (0.459).
However, we need to be sure that the consistency ratio is smaller than 0.10 before we can consider these priorities as legitimate. The consistency of 0.098, as shown in the right pane of the nodes comparison interface, is significantly less than the suggested threshold of 0.10. Land (0.105) and urban transport utilities (0.230) met the energy sub criteria. On the other hand, the sub criterion with the lowest weight value was found to be housing (0.078) and tourism (0.036).
Figure 15. Graphic comparisons of two criteria: energy and housing.
We can compare using Super Decisions v3 in four distinct ways: graphical, verbal, matrix, and questionnaire. This lets us select the style that works best for us. By selecting the "Graphical" tab in the middle pane, you may also view our comparisons graphically. The example of the graphical comparison between "energy" and "housing" is displayed in
Figure 15. Instructions for using the graphical user interface interactively are provided in this pane.
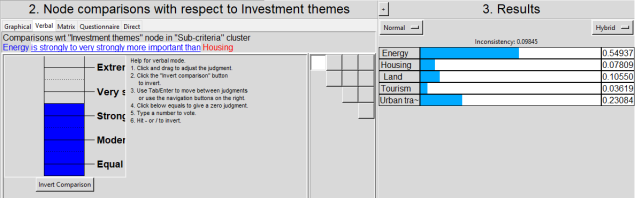
Figure 16 displays the verbal comparison between "energy" and "housing." By selecting the "verbal" tab at the top of the center pane, you can switch to this mode. As you can see from
Figure 16, we have determined that "energy" is significantly more significant than "housing" in relation to our investment theme goal because the colored selection falls between these two assessments. Additionally, note that the software does this internally, so we don't need to consider any way to translate spoken assessments into numerical numbers.
Figure 16. Verbal comparison of “energy and housing”.
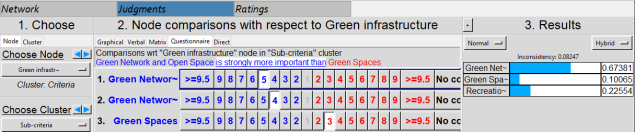
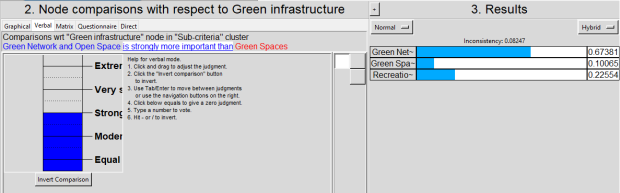
Figure 17. Comparison of criteria with respect to the “Green infrastructure” node.
Figure 18. Graphic comparisons of two criteria: green network and open space and green spaces.
The comparison page (middle pane of
Figure 17) displays each judgment entered using the comparison mode of your choosing. As illustrated in
Figure 17, the computed priorities show up in the comparison interface's right pane after all comparisons have been completed. Expert comparison assessments are displayed in
Figure 17, where the intensity values for each comparison are chosen. For example, the comparison (shown by the number 5 on the left) demonstrates that green networks and open space are significantly more significant than green areas when it comes to "green infrastructure."
Given that the "green network and open space" section of the questionnaire has an intensity of 5. Until all comparisons are finished, the decision-maker enters the intensity judgments for each of the three pairwise comparisons. The weight values extracted from the Super Decision algorithm are displayed in
Figure 17. The values of the sub criterion of green network and open space, green spaces, and recreation and open space add up to one when looking closely at
Figure 17.
Examining the weight data reveals that the subcriterion with the greatest priority value (0.673) is the one pertaining to green networks and open spaces. However, we need to be sure that the consistency ratio is smaller than 0.10 before we can consider these priorities as legitimate. The consistency of 0.082, as shown in the right pane of the nodes comparison interface, is less than the suggested threshold of 0.10.
Green spaces (0.225) and green spaces (0.100) met the sub criteria of open space and green network. On the other hand, the sub criterion with the lowest weight value was found to be green areas (0.100) and recreation (0.225). We can compare using Super Decisions v3 in four distinct ways: graphical, verbal, matrix, and questionnaire. This lets us select the style that works best for us.
By selecting the "Graphical" tab in the middle pane, you may also view our comparisons graphically. The example of a graphical comparison between "green spaces" and "green network and open space" is presented in
Figure 18. Instructions for using the graphical user interface interactively are provided in this pane.
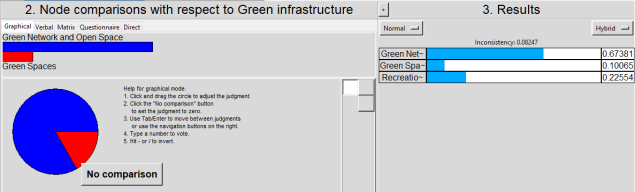
Figure 19. Verbal comparison of “green network and open space”.
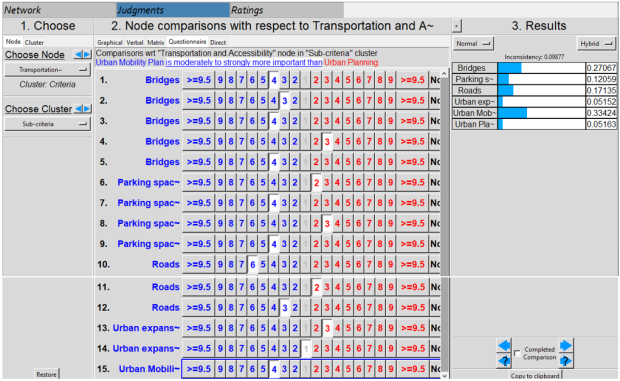
Figure 20. Comparison of criteria with respect to the “Transportation, and Accessibility” node.
Figure 19 compares the terms "green network and open space" and "green spaces" verbatim. Clicking the "verbal" tab at the top of the center pane will allow you to enter this mode. As you can see from
Figure 19, we have determined that "green network and open space is strongly more important than green spaces" in relation to our objective of green infrastructure because the colored selection falls between these two conclusions. The software does this internally, so we don't need to consider any way to translate spoken assessments into numerical numbers.
As seen in the comparison screen (middle pane of
Figure 20), each judgment is entered using the comparison option of your choice. As seen in
Figure 20, the computed priorities show up in the comparison interface's right pane after all comparisons have been completed. By choosing the intensity levels that correspond to each comparison, the experts' comparison assessments are displayed in
Figure 20. For instance, the comparison (shown by the number 4 on the left) demonstrates that bridges are somewhat to significantly more significant than parking spaces in terms of "Transportation and Accessibility." For the "bridges" section of the questionnaire, an intensity of 4 has been chosen. Until all fifteen pairwise comparisons have been made, the decision-maker enters the intensity judgments for each comparison.
The Super Decision program's weight values are displayed in
Figure 20. If one closely examines
Figure 20, one can see that the sub-criteria of urban planning, urban mobility plan, urban expansion, roads, bridges, and parking spaces add up to 1. The sub criterion with the greatest priority value (0.334) is the urban mobility plan sub criterion, according to the weight data. However, the consistency ratio must be smaller than 0.10 before we can consider these priorities as legitimate. The consistency shown in the nodes comparison interface's right pane is 0.098, below the suggested value of 0.10. The urban mobility plan's sub-criteria were parking spaces (0.120), roads (0.171), and bridges (0.270). Urban planning (0.0516) and urban expansion (0.0515) were found to be the sub-criteria with the lowest weight value.
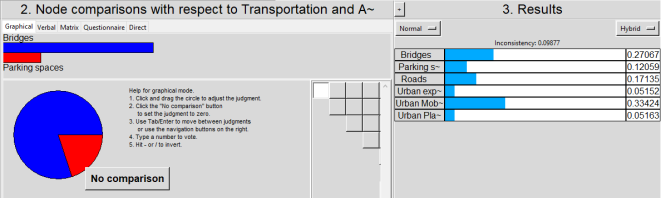
We have four options for comparisons in Super Decisions v3: graphical, verbal, matrix, and questionnaire. This allows us to pick the method that works best for us. To view our comparisons in a graphical format, select the "Graphical" tab in the central pane. The graphical comparison of "bridges and parking spaces" is depicted in
Figure 21. Instructions for interacting with the graphical user interface are provided in this pane.
Figure 21. Graphic comparisons of two criteria: bridges, and parking spaces.
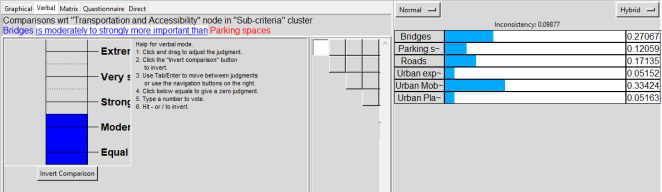
Figure 22. Verbal comparison of “bridges, and parking spaces”.
In
Figure 22, "bridges and parking spaces" are verbally compared. Clicking the "verbal" tab at the top of the center pane will allow you to enter this mode. Because the colored selection falls between these two assessments, you can see in
Figure 22 that we have determined that "bridges are moderately to strongly more important than parking spaces" in relation to our transportation and accessibility goals. The software does this internally, so we don't need to consider any way to translate spoken assessments into numerical numbers.
Every judgment is input using the comparison mode of your choosing, as indicated in
Figure 23's middle pane of the comparison page.
Figure 23 displays the computed priorities in the comparison interface's right pane after all comparisons have been completed. Experts' comparison assessments are displayed in
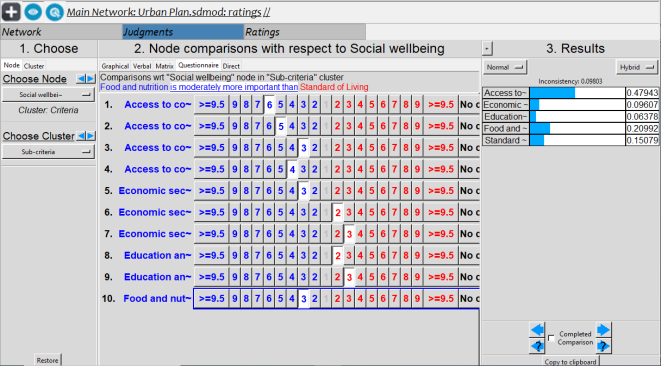
Figure 23 after they have chosen the intensity values that correspond to each comparison. The contrast, for instance, demonstrates that access to community resources is significantly more significant than economic security in terms of "Social wellbeing," as indicated by the number 6 on the left.
On the questionnaire's "access to community resources" section, an intensity of six has been chosen. Until all 10 pairwise comparisons have been made, the decision-maker enters the intensity judgments for each comparison.
The weight values extracted from the Super Decision algorithm are displayed in
Figure 23. A further examination of
Figure 23 reveals that the sub-criteria values of standard of living, education and health, economic security, food and nutrition, and access to community resources add up to 1.
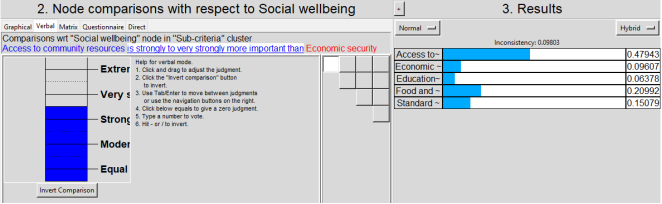
The sub criterion with the greatest priority value (0.479) based on the weight results is the access to community resources sub criterion. However, the consistency ratio must be smaller than 0.10 before we can consider these priorities as legitimate. The consistency of 0.0980, as shown in the right pane of the nodes comparison interface, is less than the suggested threshold of 0.10. The following sub-criteria were found: standard of life (0.150), food and nutrition (0.209), and access to community resources. Economic security (0.096) and health and education (0.063) were found to be the sub-criteria with the lowest weight values.
Figure 23. Comparison of criteria with respect to the “Social wellbeing” node.
We can compare using Super Decisions v3 in four distinct ways: graphical, verbal, matrix, and questionnaire. This lets us select the style that works best for us.
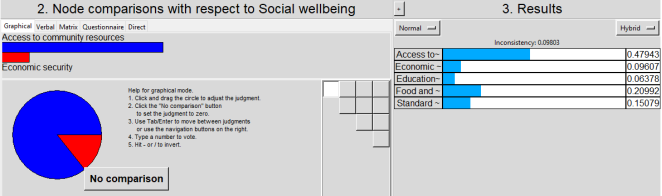
By selecting the "Graphical" tab in the middle pane, you may also view our comparisons graphically. The example of the graphical comparison of "economic security and access to community resources" is presented in
Figure 24. Instructions for using the graphical user interface interactively are provided in this pane.
In
Figure 25, the verbal comparison of "economic security and access to community resources" is displayed. You can switch to this mode by selecting the "verbal" tab at the top of the center pane. With regard to our objective of social wellbeing, we have determined that "access to community resources is strongly to very strongly more important than cc" (see
Figure 25). This is because the colored selection falls between these two evaluations. Also, note that the software does this internally, so we don't need to consider any way to translate spoken assessments into numerical numbers.
Figure 24. Graphic comparisons of two criteria: bridges, and parking spaces.
Figure 25. Verbal comparison of “access to community resources, and economic security”.
Figure 26. Comparison of criteria with respect to the “Design and Construction” node.
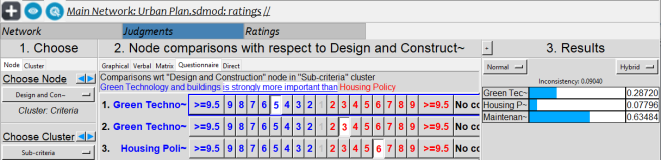
As seen in the comparison screen (middle pane of
Figure 26), each judgment is entered using the comparison option of your choice. As illustrated in
Figure 26, the computed priorities show up in the comparison interface's right pane after all comparisons have been completed. The findings of the experts' comparison judgments, which involved choosing the intensity levels that corresponded to each comparison, are displayed in
Figure 26. For instance, the second comparison (shown by the number 5 on the left) demonstrates that, in terms of "Design and Construction," green buildings and technology are much more significant than housing policy, which is similarly to somewhat more significant than design and construction.
The "green technology and buildings" section of the questionnaire provides a choice of intensity of 5. Each of the three pairwise comparisons has its intensity ratings entered by the decision-maker until all comparisons have been finished.
Figure 26 displays the weight values extracted from the Super Decision program. Upon closely examining
Figure 26, it is evident that the sub-criteria of housing policy, green buildings and technologies, and facility upkeep add up to 1. Examining the weight data, it can be observed that the sub criterion with the highest priority value (0.634) is related to facility upkeep.
However, we need to be sure that the consistency ratio is smaller than 0.10 before we can consider these priorities as legitimate. The consistency of 0.090, as seen in the right pane of the nodes comparison interface, is less than the suggested threshold of 0.10. Green buildings and technology met the sub criteria of facility upkeep (0.287). It was determined that the sub criterion with the lowest weight value was housing policy (0.077).
Figure 27. Graphic comparisons of two criteria: green technology and buildings, and housing policy.
Figure 28. Verbal comparison of “access to community resources, and economic security”.
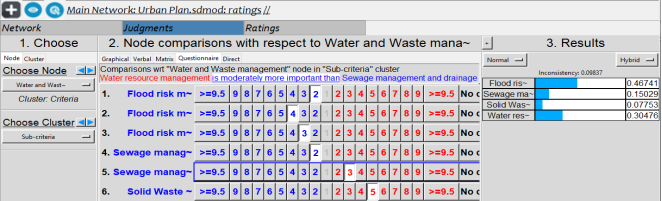
Figure 29. Comparison of criteria with respect to the “Water, and Waste management” node.
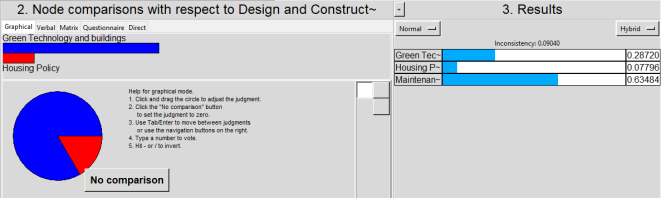
With Super Decisions v3, we may compare in four distinct ways: graphical, verbal, matrix, and questionnaire. This lets us select the style that works best for us. You may view our comparisons graphically by selecting the "Graphical" tab in the middle pane. The graphical comparison of "green technology and buildings, and housing policy" is depicted in
Figure 27. The instructions for using the graphical user interface interactively are provided in this pane.
In
Figure 28, the linguistic comparison of "green technology and buildings, and housing policy" is displayed. Clicking the "verbal" tab at the top of the center pane will allow you to enter this mode. The colored selection in
Figure 28 is between these two assessments, indicating that we have proven that "green technology and buildings are strongly more important than housing policy" in relation to our Design and Construction goal. The software does this internally, so we don't need to consider any way to translate spoken assessments into numerical numbers.
On the comparison panel (middle pane of
Figure 29), you enter each judgment using the comparison option of your choice.
Figure 29 displays the computed priorities in the comparison interface's right pane after all comparisons have been completed. Experts' comparison assessments are displayed in
Figure 29 after they have chosen the intensity values that correspond to each comparison. In terms of "water and waste management," for instance, flood risk management is equally to somewhat more significant than sewage management and drainage systems, as illustrated by the comparison (shown by the number 2 on the left).
On the "flood risk management" section of the survey, an intensity of 2 has been chosen. Up until all six pairwise comparisons are finished, the decision-maker enters the intensity judgments for each comparison. The Super Decision program's weight values are displayed in
Figure 29. A further examination of
Figure 29 reveals that the total of the values of the sub-criteria for solid waste management, flood risk management, sewage and drainage system management, and water resource management is 1. Examining the weight findings reveals that the sub criterion responsible for flood risk management has the greatest priority value, at 0.467.
However, we need to be sure that the consistency ratio is smaller than 0.10 before we can consider these priorities as legitimate. The consistency of 0.0983, as seen in the right pane of the nodes comparison interface, is less than the suggested threshold of 0.10. Water resource management was the next sub criteria of flood risk management (0.304). Conversely, the sub criterion with the lowest weight value was found to be solid waste management (0.077) and sewage management and drainage system (0.150).
We can compare using Super Decisions v3 in four distinct ways: graphical, verbal, matrix, and questionnaire. This lets us select the style that works best for us. By selecting the "Graphical" tab in the middle pane, you may also view our comparisons graphically.
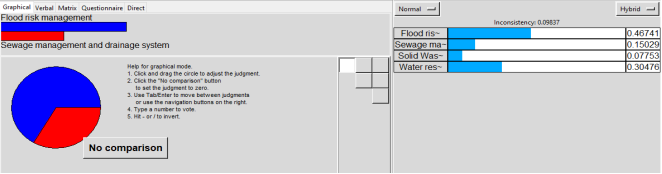
Figure 30. Graphic comparisons of two criteria: flood risk management, and sewage management and drainage system.
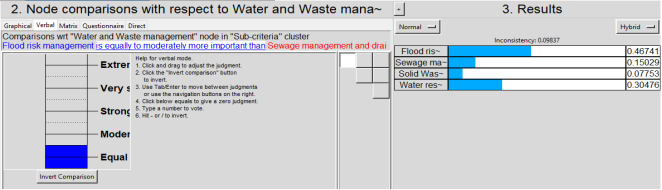
Figure 31. Verbal comparison of “access to community resources, and economic security”.
The example of the graphical comparison of "drainage system, sewage management, and flood risk management" is presented in
Figure 30. Instructions for using the graphical user interface interactively are provided in this pane.
In
Figure 31, "flood risk management, and sewage management and drainage system" are verbally compared. Clicking the "verbal" tab at the top of the center pane will allow you to enter this mode. Since the colored selection falls between these two judgments, you can see in
Figure 31 that, in relation to our objective of water and waste management, we have determined that "flood risk management is equally to moderately more important than sewage management and drainage system." The software does this internally, so we don't need to consider any way to translate spoken assessments into numerical numbers.
5. Discussions, Managerial Implications, and Limitations
5.1. Discussion of Main Finding
The purpose of this study is to examine how urban planning practices affect city beautification initiatives. During the literature review, the criteria and sub-criteria used to examine urban planning practices found in various studies were identified and submitted for evaluation to expert viewpoints. The study includes the primary criteria of sustainability, conservation, investment themes, green infrastructure, transportation, accessibility, social wellbeing, design and construction, water, and waste management, as well as sub-criteria that make up the hierarchical structure, according to a group decision made by experts with experience in the field.
The decision experts ranked sustainability (0.191) and conservation (0.255) as the most crucial urban planning practices after comparing the weights of each major criterion. The decision experts picked design and construction (0.121) as the next urban planning approach that contributes to city beautification, followed by investment themes (0.107) and green infrastructure (0.078). Water and waste management (0.048), transportation and accessibility (0.095), and social welfare (0.101) were found to be the least significant urban planning practices.
By looking more closely at each sub-criterion under its own dimension, monumental architecture (0.539) and air quality management (0.312) had the highest priority weighted values under the conservation category. In contrast, the subcriterion of cultural heritage preservation (0.087) and preservation of cultural heritage (0.06) were found to have the lowest weight value. In turn, the most significant urban planning practices were determined to be land (0.105), energy (0.459), and urban transport utilities (0.230). As the least significant urban planning practice, on the other hand, the subcriterion of housing (0.078) and tourism (0.036) were found to have the lowest weight value.
Additionally, green spaces (0.225), green network and open space (0.673), and green spaces (0.100) had the highest priority rankings under the green infrastructure criteria. Conversely, green spaces (0.100) and recreation (0.225) were found to be the least significant urban planning practices and the subcriterion with the lowest weight value. Furthermore, the most crucial urban planning practices were determined to be roads (0.171), parking spaces (0.120), bridges (0.270), and the urban mobility plan (0.334). On the other hand, urban planning (0.0516) and urban growth (0.0515) were found to be the least significant urban planning practices and the subcriterion with the lowest weight value.
Moreover, in the social wellness category, the most significant urban planning practices were as follows: standard of living (0.150), food and nutrition (0.209), and access to community resources (0.479). Education and health (0.063) and economic security (0.096) were found to be the least significant sub criteria, on the other hand. Green technologies, buildings, and facility maintenance had the highest priority rankings under the design and construction category (0.634, 0.287, respectively).
On the other hand, the least significant urban planning practice was determined to be the housing policy subcriterion with the lowest weight value (0.077). Lastly, flood risk management (0.467) and water resource management (0.304) had the highest priority values under the water and waste management categories. Conversely, solid waste management (0.077) and sewage management and drainage system (0.150) were found to be the least significant urban planning practice and the subcriterion with the lowest weight value.
5.2. Managerial Implications
The study offers a fresh and important addition to the progression of successful city master plan implementation. Enhancing the urban environment is the goal of this study because urban settlements' effectiveness is mostly determined by their level of planning, economic development, and management
| [28] | R. Nallathiga, “Assessing the Role of Master Plans in City Development: Reform Measures and Approaches,” 48, no. July, pp. 3–4, 2017. |
[28]
. Additionally, it accommodates residents' appropriate settlements in accordance with legal criteria. Planners and policymakers may find it useful in their overall endeavor to create and carry out the best city master plan for initiatives pertaining to municipal development and beauty.
Furthermore, the approach used aids in conducting an investigation based on their relative impotence, subjectivity, and uncertainties that are taken into consideration using the fuzzy set theory in a fuzzy environment in order to improve the study's validity and reliability.
Additionally, investigating this research contributes to the attractiveness of the city through its outward look, which shapes the perception of its residents in a steady, good manner. Lastly, the evaluation of city beautification projects for the local community and society at large is made possible by the appropriate execution of the master plan.
5.3. Limitations of the Study
The study was conducted with a small number of specialists, which is one of its shortcomings. In further research, a wider range of specialists can assess the criteria derived from this study's literature analysis section. The findings of this study's literature review and AHP analysis can therefore be applied to other research projects. The study's disregard for the links between the criteria which, according to the experts, are nonexistent is another source of constraint. Models can be created using techniques like the ANP if different specialists for various regions in subsequent research assert the presence of these links.
In order to generalize the findings, every criterion was taken into consideration during the study's application and literature analysis phases. Future research will build various models based on this work. Clearer and more consistent results can be obtained by carefully examining the importance levels for each criterion in accordance with urban planning practice.