Research Article | | Peer-Reviewed

Computer Vision-based Prediction and Mathematical Optimization of 5G Wireless Cellular Network Parameters

Received: 6 June 2025     Accepted: 23 June 2025     Published: 19 July 2025
Views:       Downloads:
Abstract

Objective - To investigate, analyze and optimize (where needed) the properties and predictive analyses of selected 5G Mobile wireless network parameters (i.e. Signal to interference noise ratio (SINR) and Throughput as measures of network performance) and Interference conditions in the presence of building obstacles; using the novel approach of combining signal data and visual data in wireless communications. Methods- Using a sample set (i.e., 200 data points) of real life 5G Outdoor Micro cellular tests data and urban building image datasets from validated open source data stores; experimental, investigative and comparative analyses were carried out using the novel approach of combining signal data and visual data using Machine Learning (i.e. Computer Vision) Hybrid deep learning artificial intelligence CNN-based model (i.e., High performance CNN), analytical and mathematical optimization algorithms. The key idea is to leverage camera imagery and Machine Learning (Computer Vision) to successfully predict and analyze network parameters like SINR, Throughput and amount of Interference in the presence of signal obstacles which usually attenuate received signals aperiodically. Additionally obstacle related losses were analysed and network parameter optimization was also demonstrated. Results - The predictive analyses in the presence of obstacles (i.e. concrete buildings) of selected 5G wireless network parameters of SINR and Throughput were carried out successfully using the Hybrid High performance CNN model (HP CNN); with the model showing excellent efficiency by using lesser resources and image datasets from a different environment. Furthermore, the analytical and predictive analyses of a representation of the user interference (i.e. I/PG) in the presence of obstacles were also successfully carried out, and a new OPL algorithm was also proposed in relation to important user obstacle penetration losses. Additionally, the 5G network parameter (i.e. SINR) was mathematically optimized with reference to minimal interference as a demonstration of being an effective tool for engineers and network designers to analytically tune and manage network performance in subsystems and systems more efficiently. Conclusions - This work and diverse related works being carried out; gives no doubt that this novel hybrid intelligent approach presents great possibilities and capabilities for the modern wireless communications field and associated technologies for now and in the future; and its a key approach to autonomous, more efficient network performance management and AI-driven network parameter, attenuation, and interference management.

Published in International Journal of Wireless Communications and Mobile Computing (Volume 12, Issue 2)
DOI 10.11648/j.wcmc.20251202.11
Page(s) 55-71
Creative Commons

This is an Open Access article, distributed under the terms of the Creative Commons Attribution 4.0 International License (http://creativecommons.org/licenses/by/4.0/), which permits unrestricted use, distribution and reproduction in any medium or format, provided the original work is properly cited.

Copyright

Copyright © The Author(s), 2025. Published by Science Publishing Group

Keywords

Wireless Communications, Prediction, 5G Networks, Obstacle Loss, Machine Learning, Computer Vision, Hybrid CNN, Optimization

1. Introduction
Mobile networks for the fifth generation (5G) and beyond has been the subject of attraction for the use of modern millimeter-wave (mmWave) communication technology . 5G networks and further generational upcoming networks comes with the capability to support high reliability, very low latency, high data rates and large traffic volumes in various modern applications such as virtual reality (VR), augmented reality (AR), and cloud services . The key advantage of larger bandwidth in the order of several GHz, thereby enabling mutil-Gbit/s data rates, is possessed by the mmWave band; to the extent that for next generation 60 GHz communication of the IEEE 802.11ay aims to enable up to 100 Gbits/s communication using over 4 GHz of bandwidth . Sensitivity to blockage is higher for mmWave communications than lower-frequency bands due to the use of directive antennas by the former, thereby it being unable to provide reliable wireless links in the presence of blockages. Such sudden losses could be as much as 20 dB or more on received power when a line-of-sight (LOS) path is blocked by obstacles such as vehicles and pedestrians . Additionally, such sudden losses or damaging attenuation can create packet losses, thereby degrading data rate and/or throughput; which is very much critical for modern communications systems like 5G and beyond; and associated applications. Therefore to overcome such limitations that comes with uncontrolled and challenging communication environments, and driven by recent advances in computer vision (CV) and machine learning (ML); visual data (e.g., RGB depth (RGB-D) camera imagery, LiDAR point cloud, etc.) generated that are prevalent in intelligent machines such as autonomous vehicles, drones and robots; and such visual data that are also from a variety of vision sensors, can be leveraged as a key enabler for beyond 5G URLLC (Ultra Reliable and Low Latency Communication). This leads to a line of work in wireless communications, called: “View to Communicate” (V2C), where such visual data enables the construction of high-definition 3D environmental maps for improved indoor navigation and positioning; and also enabling the accurate prediction of wireless channel dynamics, parameters and characteristics, such as future channel blockages and received power . Furthermore and alternatively, occlusions by environmental artifacts like lighting, human body, and walls, to visible light is an area of vulnerability for computer vision in some scenarios; which can also be resolved using WiFi, which involves leveraging radio frequency (RF) sensing; to detour, change and diffract blockages, thereby tracking user locations even behind walls more precisely, as opposed to the visible light approach. Such research direction, which more recently involved the non-invasive medical imaging by the penetration of body tissues by the high resolution sensing capabilities of mmWave and terahertz (THz) signals, is called: “Communicate to View” (C2V) .
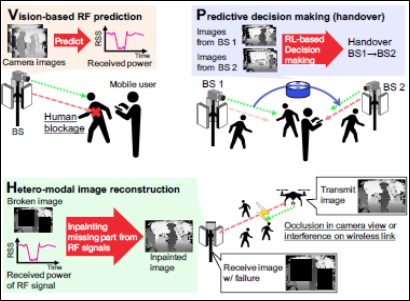
Figure 1. An illustration of vision aided wireless communication .
Therefore, novel predictive intelligent wireless communications actions like beam-switching and handover were also proposed in some previous works, and such works employed a mmWave radar and camera to detect a human approaching the LOS path respectively . Additionally, and with the new challenge of the prediction of received power based on images; the prediction problem of received power can be considered as a supervised learning regression problem, and with the application of Machine learning (ML) algorithms learn the mapping from the images to the received signal power values. This experimental and investigative research is hence aimed at investigating, analyzing and optimizing (where needed) the properties and predictive analyses of selected 5G Mobile wireless network parameters (i.e. Signal to interference noise ratio (SINR) and Throughput as measures of networks performance) and Interference conditions in the presence of building obstacles; using the novel approach of combining signal data and visual data using Machine Learning (i.e. Computer Vision) hybrid deep learning artificial intelligence CNN (Convolutional Neural Network) based model, analytical and mathematical optimization algorithms.
2. Literature Review
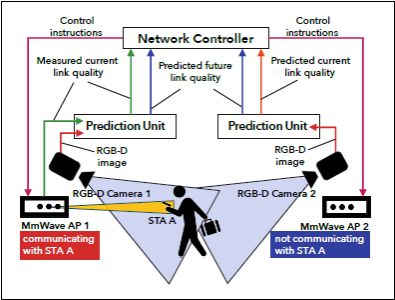
Figure 2. A System description showing the prediction units which predict the link quality from the depth images, an also the network controller .
As mentioned in previous works, there has been extensive stochastic and empirical analyses conducted with respect to blockages of mmWave channels and signals . Such previous analyses have been focused on outputs of stochastic prediction models; which has been confirmed to have a mean attenuation that follows a log-normal distribution; when induced by human blockage at 60Hz. As a key proposal, was the proactive and integrated blockage prediction and network control system for mmWave networks using the assistance of a camera. The system conducts efficient network operations such as proactive handover and flow control before a blockage occurs by capturing the mobility of the obstacles using depth cameras. Furthermore, some previous works have been based on time series analysis, which cannot predict periodic variations, but can predict long-term and periodic trends. Some works have also shown that in conventional microwave communications, the prediction of the time-series of link qualities, such as PRR, SNR, and capacity, were carried out successfully . Additionally, studies involving ML-based prediction methods have also been carried out using time series-data; and such methods predicts the received power or received signal parameter by using recurrent neural networks (RNNs) from learning long term and periodic trends like the time series analysis .
Another previous work obtained the predicted received power in an indoor experiment system which had two randomly moving people act as obstacles by blocking the communication link; by feeding historical or past RGBD images into a deep neural network (DNN). Similarly, another work also demonstrated by indoor experiment that accurate RF channels prediction can be obtained without the consumption of RF resources by using vision-based solutions within future 2.4GHz channel.
Furthermore, some previous works demonstrated the feasibility of THz-based NLOS imaging using common building materials, while operating in the 220-230GHz band . Additionally, studies were also done on the recognition of persons from their walking postures using a mmWave-based gait recognition method; which under NLOS (non-line-of-sight) scenarios, is expected to still be effective . Studies and researches of different approaches continues and one of such works, postulated that the predicted received power could be obtained by raytracing simulation ; such that if the future positions, materials and shapes of all objects in an environment (e.g., walls, furniture, and pedestrians) which defines the future communication environment which has a perfect geometry and can be obtained; ray-tracing simulation can then predict the received power by calculating all of the possible signal propagations. Also some other works demonstrated that localization accuracy or resolutions of image data can be improved by the cooperative use of multiple signals on different frequency bands. Such work involves utilizing a multi-band radar data on 3-12GHz bands and decimeter-level localization, leveraging multi-band signals on 900MHz, 2.4GHz, and 5GHz; thereby forming a super-resolution system of radar data as reported by previous studies .
3. Methodology
This research activity and study is very much data driven, as it involves the synthesis and integration of 5G mobile wireless network parameter datasets and Deep Learning or Artificial Intelligence Convolutional Neural Network (CNN) driven Computer Vision image datasets relating buildings obstacles in a typical urban environment’ by the use of a high performance hybrid simulation model. The analyses were carried out in three sections of firstly the Prediction of selected 5G Wireless network parameters using the Machine Learning drive hybrid model for the network parameter and CNN algorithm for the image dataset; secondly the Simulation and Predictive analysis of the 5G Interference and Obstacle loss factors in the wireless system; and thirdly the Optimization and Comparative analyses of the selected 5G network parameters and also the performances of the simulation algorithms using the Root Mean Square error (RMS) metric. In addition to the theoretical and practical concepts and parameters already known; new metrics are derived to indicate, measure and confirm key tests and analyses.
3.1. Data Collection and Preparation
Furthermore, for such various methodical analyses; data acquisition, data cleaning, data wrangling, image datasets preprocessing, sizing and cropping; are among key preliminary steps to ensure that the required data is importantly used for such analysis, following the key important steps:
1) Step 1: Acquire data from validated open access data stores and live data web portals.
2) Step 2: Clean the data, label it appropritely, process it, wrangle it and make it fit for purpose.
3) Step 3: Store the data and partition them accordingly for use.
4) Step 4: Feed the data into the particular analysis tool, model and process as required.
5) Step 5: Prepare and specify how results will be reported.
3.2. Key Assumptions and Network Simulation Specifications
Here, a summary of important scientific and engineering assumptions made for this experimental research work are presented to aid better understanding of this research paper. These key assumptions are:
1) The wireless transmitter (TX) is stationary (e.g. wireless base station or wireless hotspot), and the receiver (RX) is quasi-static (stationary or a very slow walking pace); thereby the change in time of the received signal is negligible. Therefore, the received signal analysis in this work is not based on time series.
2) The system is based on LOS (Line of Sight) propagation from TX to RX (e.g. point to point or point to multipoint) in mobile cellular mode. The NLOS (Non- Line of Sight) is assumed to be adequately handled by modern 5G beamforming and inherent multipath systems.
3) The Obstacle body is not mobile, but stationary, for example concrete buildings in a typical dense urban environment. Additionally the diffraction loss by the building obstacle on the incident received signal is negligible (i.e.: Ld = 0), and the incident angles of all user signals to the obstacle are equal.
Table 1. Simulation System Parameters.

System

5G

Frequency band

Midband (3.5GHz) and mmWave (24 - 100GHz); User (RX) Throughput = 100Mbps - 1Gbps

Cellular Type

Urban Outdoor Microcell

Modulation

16-QAM

Bandwidth

100 MHz

Simulation Thresholds

Throughput (100 Mbps) and SINR (10dB)

Noise power density (N0)

-174dBm/Hz

Obstacle Type

Urban Concrete buildings

Furthermore, a summary of the systems simulated had the following specifications, which were aimed at obtaining needed results in harmony with the aims and objectives of this research work. These key parameters are specified in Table 1.
3.3. Machine Learning-driven (CNN-based) Prediction of Network Parameters
Here the aim was to predict the received signal network parameters of Throughput and SINR, by using a hybrid predictive model that combines the training of the selected received signal parameter with Computer vision (i.e. CNN-Based) pre-trained image datasets; to predict the selected network parameter in the presence of obstacles as captured by cameras (typically RGB cameras); which is a similar principle demonstrated by previous works.
In our ML experiments, we employed the commonly used holdout method for the validation and test. In the holdout method, data are separated into two sets: one is used for training, and the other is used for evaluation. Furthermore, for this research work in particular, the received signal parameter dataset (i.e. Throughput or SINR) is read from file and standardized for better learning; then the CNN extracts image-based features from obstacles affecting signals. Additionally, this work utilized a High Performance (CNN) (i.e. HP CNN) which is actually a Fully Connected (Dense Layers) CNN (i.e. CNN + Dense model); for better model prediction and performance for such different datasets. This then predicts the required network parameter as an output having had the images of the obstacle and received signal parameter datasets as inputs. It is also pertinent to note that the SINR was a focal measure of the signal quality than just the SNR, so as to better represent a more practical, real life scenario, where signals typically experience interferences and losses.
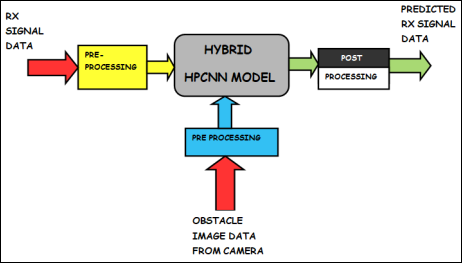
Figure 3. Simplified Hybrid Predictive 5G received signal (RX) System Model.
For situations where the received signal throughput or user received data rate or SINR datasets cannot be obtained by tests; such parameters can also be calculated by standard equations.
For SINR at the receiver (user mobile) from definition;
SINR =PSPI+PN(1)
Where: SINR is the Signal to Interference and Noise ratio; and it can be expressed as a reference to signal power in dB. PI is the Interference power from other users (both inter-cell and intra-cell). PN is the Noise power; and PS is the received signal power from the serving base station (i.e. TX).
Also for practical Throughput with user experience in 5G;
Tuser=BN. η.log2 (1+ PSPI+PN)(2)
Where: B is the total fixed bandwidth shared by the users; and Tuser is the throughput of each user for N number of users. η is the Efficiency factor (0.6-0.9 possibly due to coding, overhead, and retransmissions).
It is also worthy to note that as SINR increases, Throughput also gets better or increases.
Deleted Sub Heading
Figure 4. Architecture of Traditional CNN .
Computer Vision technologies are able to effectively and efficiently detect objects and classify images; and at the heart of their operation are CNNs, which have shown remarkable accuracy in complex tasks, such as object detection in challenging domains, and classifying images with high accuracy, and are now quite ubiquitous in applications ranging from smartphone photo enhancements to satellite image analysis. CNNs are actually artificial Neural Networks (ANN) optimized for image-related pattern recognition. CNNs are based on convolutional layers instead of fully connected layers. As shown in Figure 4, a convolutional layer is used to detect patterns in an image with a filter. A filter is just a matrix that is applied to a portion of an input image through a convolutional operation and the output will be another image (also called a feature map) with the highlighted patterns found by the filter .
A convolution is a specific type of matrix operation. For an input image, a filter of size n*n will go through a specific area of an image and apply an element-wise product and a sum and return the calculated value:
Figure 5. Convolutional operations .
In Figure 5, we applied a filter to the top-left part of the image. We then apply element-wise multiplication; then we will perform the same operation by sliding the filter to the right by one column from the input image. We keep sliding the filter until we have covered the entire image. Rather than sliding column by column, we can also slide by two, three, or more columns. The parameter defining the length of this sliding operation is called the stride. Furthermore, since a convolutional operation tend to decrease the size of an image after processing, we can retain the dimension of the image by applying padding; which is the addition of rows and columns with the value 0 around the border of the input image. A convolutional layer is just the application of the convolutional operation with multiple filters.
Additionally and as used in this research work, the Fully Connected (Dense Layers) is a neural network layer where each neuron in the current layer is connected to all the neurons in the previous layer; thereby greatly increasing the performance of the neural network .
3.4. Analytical and Machine Learning-driven Interference and Obstacle Losses Study
As earlier noted, another key focus of this research work is the analyses and prediction of the interference factor as an important channel characteristic for such a practical 5G wireless system.
Therefore, from definition,
SINR =PSGSLSI+N0(3)
Where: SINR is the Signal to Interference and Noise ratio at the receiver/user mobile (RX). PS is the transmit power of the desired signal,  GS is the Antenna gain of the desired signal. LS is the Path loss between the serving base station and the receiver, also in dB. I is the total interference power in dB, and N0 is the noise power.
Also,
For a 5G wireless system, the path loss is modeled and calculated using the log-distance path loss formula:
PL(d) =PL0 + 10nlog10d+ Xσ(4)
Where: PL0 is the path loss at reference distance; it’s in dB. n is the path loss exponent (it varies from 2 to 4, depending on the environment). d is the distance between interfering user and target receiver in (metres), and Xσ is the shadow fading component (Gaussian distributed).
Hence from Equation (3);
I/PSGS =LSSINR- N0(5)
Since for this research work and in harmony with a practical scenario, PSGS is constant. Therefore, I /PG is an effective measure of interference with reference to the transmit power; and this metric is called: Total User Interference per power gain, also in dB. This is very useful, as it enables this research to have a sharper focus on interference and its effects in a more practical sense and for more precise interference related analyses.
Therefore, for N users or mobiles, total interference per gain for N users is given as:
I/PGN =1N(LS (N)SINRN- N0 (N))(6)
Now for when the signal is affected by the presence of an Obstacle (e.g. concrete buildings) on the LOS; this research postulates that the signal received by the users is not only affected by user interference, multipath losses; but the signal also experiences attenuation losses due to the obstacle, which also affects the SINR of the user signal. This research work assumes that the multipath losses element will be handled by modern inherent beam forming, MIMO (Multiple Input Multiple Output), and intelligent multipath systems that are part of 5G wireless systems; and therefore, the focus is on the effects of interference and obstacle related attenuation/penetration losses.
Since from definition of the Combined Attenuation Model,
Lt=Ld + Lp(7)
Where: Lt is the total attenuation due to an obstacle; it’s in dB. Ld is the diffraction loss (also in dB). Lp is the penetration loss due to the obstructing obstacle (in dB).
Furthermore, it is assumed in this research work that the diffraction loss is negligible.
Therefore,
Lt=Lp(8)
Since from definition of the Penetration model represents the penetration loss as:
Lp=L0 + Kcosθ(9)
Where: L0 is the material-specific penetration loss at normal incidence; it is in dB (i.e. for Concrete it is between 40dB to 80dB); K is the empirical constant related to the material type (i.e. for Concrete and mmWave 5G, it is between 12dB to 18dB). ɵ is the angle of incidence of the signal relative to the normal of the concrete building surface. Hence, at higher mm Wave signal frequencies, penetration loss increases as ɵ increases.
It is also important to note that for this research work, L0 was assumed to be 40dB, K as 12dB and ɵ as 45 degrees.
Since total penetration loss is relative to alternating signal power, then the effective total penetration loss should be the root mean square (rms) value of the peak or absolute penetration loss value.
Therefore,
Lt(rms)=Lp(rms)= Lp2(10)
Furthermore, from theory the intensity of rays do not affect penetration rate in a medium; but the penetration loss is affected by the material of the medium and the incident angle of the ray. However, as the amount of signals or intensity of rays to the medium increases, it can be postulated that the angle of incident of each user signal decreases, thereby decreasing the penetration loss. Hence in a mobile cellular system, as number of users (N) increases; the total rms penetration loss by the obstacle decreases.
Additionally, it can also be postulated that the user signals undergo a convolution, thereby, multiplying their vector magnitudes, to create an overall user effect of loss reduction on the total rms penetration loss from the obstacle.
Therefore,
LpTN=1NN.n=1N Lp(rms)n (11)
Where: LpTN is the total penetration loss due to an obstacle by N users or mobile signal receivers; it’s in dB.
For this research work, the number of users is assumed to be 2 (i.e. N = 2).
Finally, and with reference to Equation (5); the total interference and obstacle related attenuation/penetration loss for N mobile users ( I/PGNTOTAL) is completely noted as:
I/PGNTOTAL =1N(LS (N)SINRN- N0 (N)) + LpTN (12)
Therefore, this research work refers to Equation (12) as the Obstacle-Penetration Loss (OPL) algorithm.
3.5. Mathematical Optimization of 5G Network Parameter
Here the elegant and efficient process of Mathematical modeling and optimization is employed to effectively define, analyse and fine tune a wireless 5G system for optimal performance. In most cases to optimize the full system involves modeling and optimizing sub-systems or functions or parameters of the communication system. For example, the system SNR, SINR, or Throughput could be optimized for maximum performance or the system Interference or losses could be optimized for minimum performance; which in both cases will lead to an overall optimization of the whole system for better and higher performance.
Therefore, the mathematical modeling and optimization process involves three key steps, which are:
Identification of the Decision Variables They are the components of the system or subsystem that describe its state, and that the analyst wants to determine. Or, they represent configurations of the system that are possible to modify in order to improve its performance. In general, if these variables are n in number, they are represented by a (column) 1 vector of Rn, often denoted by
x= (x1...xn)T,i.e.,x =x1xn(13)
1) Description of the function or method Here the formula or function that defines or assesses the state of the system or subsystem in question, given a set of decision variables. This function, called objective function, is denoted by f and the aforementioned measure obtained for the decision variables x is a real number denoted by f(x).
2) Specifying the Constraints Here the mathematical description of the circumstances or constraints specifying the values that the decision variables can take, are defined .
4. Results and Discussion
This section outlines the results obtained and the various associated interpretations, and discussions on the results obtained in harmony with theories derived and literature obtained.
4.1. Prediction Analysis of Throughput
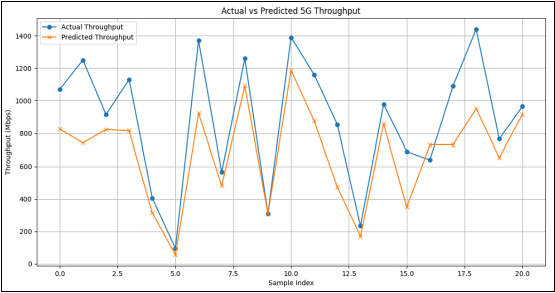
Figure 6. Predictive plots (for 100 sample points) for 5G Throughput.
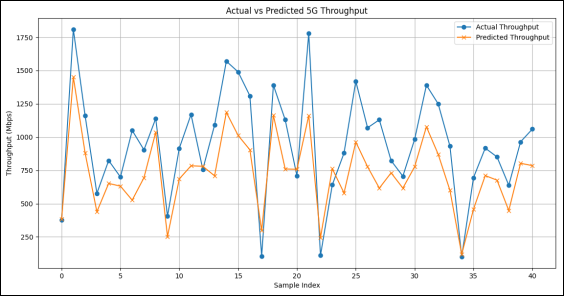
Figure 7. Predictive plots (for 200 sample points) for 5G Throughput.
As shown in Figure 6 and Figure 7; the actual (blue curve) and forecast (red curve) plots for the throughput (Mbps) as against specified sample index for the dataset points of the analysed 5G systems are shown. More data points (i.e. signal throughput and images dataset) indicated better prediction as expected, because the hybrid model does better with greater training data for better learning and output; though both plots showed good predictive output by the model, with accuracy levels of a minimum of 0.90, thereby indicating excellent performance of the model. Furthermore, the prediction results of the signal throughput from the plots, very well matches the ground truth (actual data), and both plots have low RMS error of about 10.10 Mbps - 10.20 Mbps, thereby further confirming the accuracy of the hybrid predictive model. This confirms the predictive ability of the hybrid image (high performance deep CNN) dataset algorithm and the signal dataset, on the throughput or data rate of a standard 5G communication system. The regular fluctuation of the data points also confirms the practical real life datasets that were used for the simulation experiment, as obtained from 5G mobile connection tests. Additionally, the 200 points plot indicate the actual and forecast curves achieves a higher throughput of the signal (maximum of about 1400 Mbps - 1800 Mbps) within lesser sample index ranges as against the 100 points curves, which indicated larger sample index ranges at lesser throughput values of a maximum of between about 1200 Mbps to 1500 Mbps; thereby indicating that the more the data points, the better the model can account for a greater range of values and can provide more details within of the signal profile.
Though the RMS error from the predictive curve is acceptably low; they could even be lower in the absence of potential ‘blind spots’, which are a major reason for increased error, whenever the LOS path of the signal was not adequately observed in the images. As earlier noted, with the increase in the number of data points; the accuracy of the model increased with also a corresponding decrease in RMS error; which aligned with a better working of the hybrid model. This is because the conv. layers of the high performance-deep CNN captures the features of the signal throughput more effectively; however, a larger model with more data points also can increase computational time and requires larger training dataset. Furthermore, the sample images used influenced the outcome of the signal; as it is noticed by the variations in accuracy of the signal throughput at certain points, due to different images captured by the camera from various positions around the obstacle, which further substantiates the effect of signal blockage by the obstacle, creating some blind spots and lesser accuracy than when there is minimal image and signal blockage leading to better prediction accuracy. Therefore, suggesting that image type of obstacle angle or position of image capture and/or camera position of the captured images, can also affect algorithm prediction accuracy.
4.2. Prediction Analysis of SINR
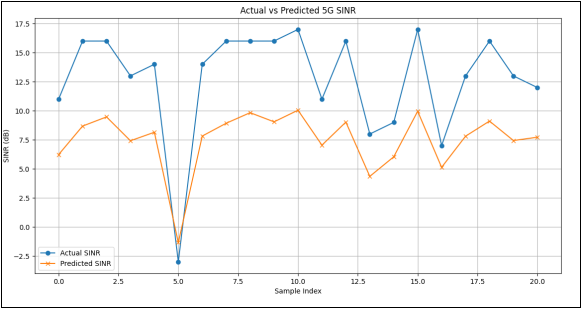
Figure 8. Predictive plots (for 100 sample points) for 5G SINR.
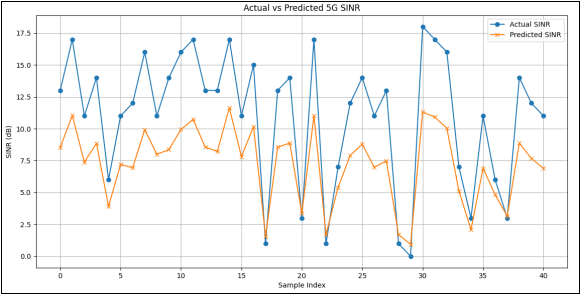
Figure 9. Predictive plots (for 200 sample points) for 5G SINR.
As also shown in Figure 8 and Figure 9; the actual (blue curve) and forecast (red curve) plots for the SINR (dB) as against specified sample index for the dataset points of the analysed 5G systems are shown. More data points (i.e. signal SINR and images dataset) also indicates better prediction as expected, which also indicates very good predictive output by the hybrid model, with accuracy levels of also a minimum of about 0.90 - 0.95, thereby indicating excellent performance of the model. Furthermore, the prediction results of the signal SINR from the plots, very well matches the actual SINR data, and both plots have fairly low RMS error of about 10.18 dB - 10.20 dB, thereby also further confirming the accuracy of the hybrid predictive model. This confirms the predictive ability of the hybrid image (high performance deep CNN) dataset algorithm and the signal dataset, on the total SINR of the tested and analysed 5G communication system. In similar pattern for the earlier described Throughput plot of Figure 6 and Figure 7; the 200 points plot indicate the actual and forecast curves achieves a higher SINR of the signal (maximum of about 11dB - 17.8 dB) within lesser sample index ranges as against the 100 points curves, which indicated larger sample index ranges at lesser SINR values of a maximum of between about 10 dB to 16 dB; thereby also indicating that the more the data points, the better the model can account for a greater range of values and can provide more details within of the signal profile.
As also earlier noted, and with respect to the influence of camera position, obstacle position, potential ‘blind spots’ and LOS; to predictive outcomes, the predictive plots of the SINR follows similar explanations as that of the Throughput. Also, it is pertinent to note that the predictive profile of the SINR signal, indicates a bit more deviation from the actual signal (which is more evident in smaller or lesser amount of signal sample data points); than the profile of the throughput; this is due to the distortion of the signal by the presence of user interference, the randomness of noise and the potential of further interference/loss by the building obstacles to the signal; which is typically reflected in the SINR data.
4.3. Prediction Analysis of Interference
Here the results of the analyses relating to the signal interference are presented. These analyses covered the predictive analysis of the interference per power gain metric (I/PG) of the sample signal, the utilization of the obstacle interference algorithm for the predictive analysis of the interference per power gain metric and a comparative analysis of the interference per power gain, signal SINR and penetration loss by the obstacle (concrete buildings) to the signal; as described in the methodology.
4.3.1. Prediction Analysis of Interference per Power Gain Metric (I/PG)
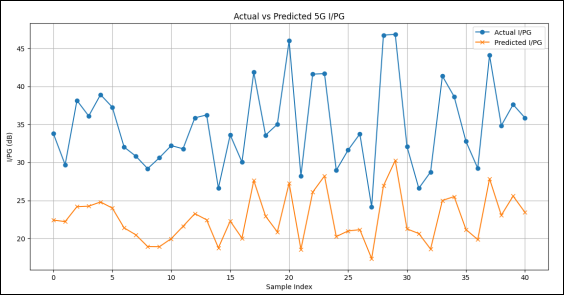
Figure 10. Predictive plots (for 200 sample points) for 5G Interference per power gain (I/PG).
As also shown in Figure 10; the actual (blue curve) and forecast (red curve) plots for the I/PG (dB) as against specified sample index for 200 dataset points (i.e. signal I/PG and images dataset) of the analysed 5G systems. The prediction results of the signal I/PG from the plot matches the actual signal I/PG data to an acceptable level, though not very well matched like the predictive plots of the signal throughput and SINR earlier analysed. This is due to the distortion of the signal by the presence of user interference, the randomness of noise, varying channel characteristics and the potential of further interference/loss by the building obstacles to the signal as earlier highlighted. This therefore further confirms the challenge with practically measuring, estimating and predicting interference experienced by signals in modern communication systems and the challenge of interference to signal quality; thereby 5G networks can minimize interference and enhance user experience by leveraging beamforming, coordinated multipoint (CoMP), and AI-driven interference management.
The predictive I/PG has an acceptably low RMS error of about 14.77 dB, thereby also further confirming the acceptable accuracy of the hybrid predictive model. Additionally, the 200 points plot indicate the actual and forecast curves achieves a maximum of about 30dB - 47 dB value of greater difference range within lesser sample index ranges than the respective predictive SINR and throughput curves. This is due to the factors affecting interference like random noise, user interference, obstacle losses as earlier noted and also importantly the transmit power and antenna gain being excluded from the experimental analysis and taken as constants so as to be able to more precisely predict and guage the amount and effect of interference on the signal and the needed precise transmission power and antenna gain to achieve a certain signal level and counter the amount of total interference. Furthermore, and in harmony with the predictive analyses of the signal SINR and throughput, the sample images used influenced the outcome of the signal and measured I/PG; as it is also noticed by the variations in prediction accuracy of the signal I/PG at certain points, due to different positions of the camera and thereby associated resultant images different images; as also earlier explained .
4.3.2. Prediction Analysis of I/PG Using Obstacle-penetration Loss (OPL) Algorithm
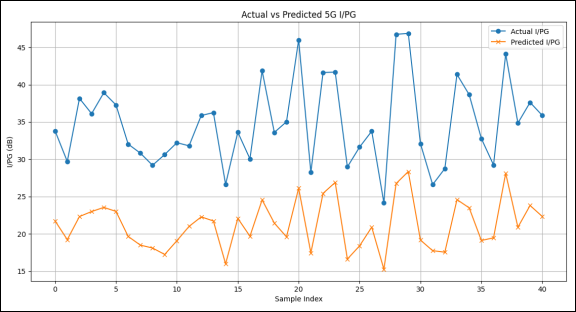
Figure 11. Predictive plots (for 200 sample points) for 5G (I/PG) using Obstacle-Penetration Loss (OPL) algorithm.
As also shown in Figure 11; the actual (blue curve) and forecast (red curve) plots for the I/PG (dB) as against specified sample index for 200 dataset points of signal I/PG from the OPL algorithm and the images dataset of the analysed 5G systems via the hybrid model. The prediction results of the signal I/PG (from OPL) of the plot matches the actual signal I/PG data to also an acceptable level (though not also very well matched like the predictive plots of the signal throughput and SINR earlier analysed, as earlier explained and expected) and it is very similar to the predictive plot of the I/PG signal, which indicates that the predictive value of I/PG (from OPL algorithm) matches at least the value of the signal I/PG, which means: predictive I/PG (from OPL) ≥ predictive I/PG; thereby confirming the accuracy of the OPL algorithm.
The predictive I/PG (from OPL) also has an acceptably low RMS error of about 14.96 dB, thereby also further confirming the acceptable accuracy of the hybrid predictive model. This confirms the predictive ability of the hybrid image (high performance deep CNN) dataset algorithm and the signal dataset, on the total I/PG (from OPL algorithm) of the tested and analysed 5G communication system. Additionally, the 200 points plot indicate in Figure 11, the actual and forecast curves achieves a maximum of about 30dB - 47 dB value of greater difference range within lesser sample index ranges than the respective predictive SINR and throughput curves; similar to the I/PG predictive plot and due to similar reasons as earlier highlighted.
Furthermore, and in harmony with the predictive analyses of the signal SINR and throughput, the sample images used influenced the outcome of the signal and measured I/PG (from OPL); as it is also noticed by the variations in accuracy of the signal I/PG (from OPL) at various index points, due also to different images captured by the camera from various positions around the obstacle.
4.3.3. Comparative Analysis Between Signal I/PG, SINR and Obstacle-penetration Loss (Lp)
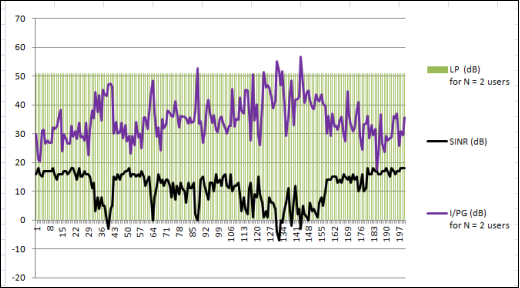
Figure 12. Plots (for 200 sample points) for 5G (I/PG), SINR and Lp.
As also shown in Figure 12; the plots are shown for the curves of I/PG (dB) (for 2 users), SINR (dB), and Lp (dB) respectively against specified sample index for 200 dataset points of the signal dataset of the analysed 5G systems. It is noticed that any point where the interference factor: I/PG peaks, there is a corresponding and reverse equivalent drop in SINR; further confirming the effect of user interference on signal strength (i.e. SINR), and this also makes SINR (which incorporates measure of interference) a more practical metric to measure signal strength than just SNR. As also observed in Figure 10; I/PG reaches a maximum value of about 57 dB (which is within the acceptable loss range for a standard applicable 5G cellular system), for a corresponding SINR minimum value of below 0 dB. Such comparative result, give systems designers information to set SINR targets balanced with the required interference factor benchmarks.
Also noticeably is that the Obstacle penetration loss (assuming diffraction loss is negligible) Lp, does not vary in harmony with the SINR. Lp is more affected by the characteristics of the obstacle (i.e. building) medium (concrete in this experiment), and the angle of incidence of the user signal to the building; as also stated in the methodology. For this research work, the angles of incidences of different user signals were assumed to be the same or equal, thereby a near constant Lp profile is observed; but a pertinent element to note is that Lp (for 2 users) was about 50 dB, which is quite significant. Therefore, in addition to the use of modern multipath loss mitigation techniques and systems; communications systems designers must also factor in such obstacle related losses in systems planning and link budget allocations, to ensure the signal strength is within an acceptable threshold and ‘strong’ enough to provide good service levels within environments with obstacles such as concrete buildings. Additionally, the experiment highlights angle of incidence of user signal as an important variable, that can also be predetermined and increased to limit the penetration by an obstacle or building.
4.4. Comparison of RMS Error of Algorithms
Here the root mean square (RMS) error values of the each of the algorithms applied in this experimental research work are presented and compared to reveal more relevant insights.
As also shown in Figure 13; the RMS values for the combinations of applied algorithms to each of the variables of SINR (dB), I/PG (dB) and I/PG (from OPL) (dB) respectively are shown in the plots. The different performances of the combinations of the High Performance CNN (HP CNN), and the earlier described Obstacle-Penetration-Loss (OPL) algorithms for selected 200 dataset points of the signal dataset of the analysed 5G systems are reflected in their various displayed RMS error plots. It is noticed that any point where the RMS error values for I/PG and I/PG (from OPL) are about 14.77 dB and 14.6 dB respectively; though having different algorithm combination; thereby indicating that the proposed OPL algorithm was efficient enough to achieve similar performance for the predictive analysis of the interference factor: I/PG, though with additional algorithm processing. Furthermore, this suggests that the total interference related loss experienced by mobile users in a 5G system, is affected by the inter user interference and the penetration loss by any obstructive obstacle to the signal; and both user interference and obstacle penetration losses in an urban setting (where available by concrete buildings), also affect each other.
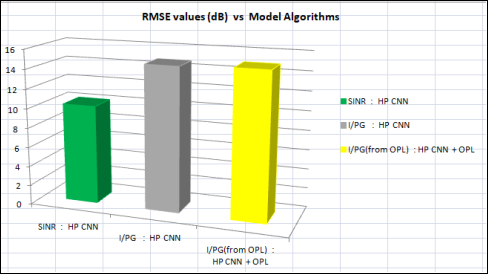
Figure 13. Plots (for 200 sample points) of RMSE values and Model Algorithms.
Also noticeably from Figure 13; is that the predictive analysis for SINR had the least RMS error of about 10.18 dB with the hybrid HP CNN combination with no extra algorithm, which showed excellent performance; thereby further confirming the greater challenge of measuring and predicting interference measure of real life mobile signals than SINR, due to noise randomness and varying interference related channel characteristics. It is also pertinent to note that the RMS errors for all three cases could be much lower, because the current higher values obtained are due to the fact that the image datasets used for this research and hybrid simulation model were from a different open source and not from the same environment the signal datasets were recorded; thereby having the expected increase in errors. Additionally, the real life nature of data used for this work comes with its imperfections and data ‘gaps’; in addition to the limited 200 points data sample utilized for ease of experimental tests as against larger datasets; would in both cases expectedly introduce more errors to the predictive simulations .
4.5. Mathematical Optimization of 5G Network SINR
As earlier described in the methodology; the process of Mathematical modeling and Optimisation is applied to optimize or maximize the SINR; which implies better performance of the system.
For the Variables influencing SINR are earlier defined, they are: N0, PS, GS, LS, and I.
Since the parameter of interest for this research work also involves analyzing and minimizing interference (I), which also greatly influences SINR in an inverse relationship; therefore, the Decision variable is I; where also variables: N0, PS, GS have been earlier defined as constants in this research work.
Hence,
The function or formula to define SINR is: SINR(I) = PSGSLSI+N0 as shown in Equation (3)
Since the aim is to maximize SINR; the Optimization problem is therefore defined as:
max (SINR(I))=PSGSLSI+N0;maxIϵR+PSGSLSI+N0(14)
After tests, the Constraints are defined as:
LS>0;I< LS(15)
Which implies that for SINR to be maximized, the path loss (LS) must typically be more than zero, as usual in a practical setting (i.e. cannot be practically less than zero), but the total interference/interference power of the system (I) must be less than the path loss; thereby keeping it minimal for an inversely maximum SINR.
Therefore, this process further confirms the Mathematical modeling and Optimization algorithmic procedure as an efficient, cost effective tool for engineers and system designers to tune, design the system accordingly and proactively test and set parameters for targeted good system performance at minimal resource usage.
5. Limitations and Recommendations of Study
This research study was focused on the Data and Machine Learning (i.e. Computer Vision) 5G Mobile wireless network parameters and interference prediction and optimization; using hybrid high performance deep learning artificial intelligence CNN algorithm, analytical algorithm and mathematical optimization algorithm. Though a focused and insightful analyses of selected 5G network parameters (i.e. SINR, Throughput) and channel condition (i.e. Interference), and the novel use of the combination of the network parameter data and images of obstacle (i.e. concrete buildings) datasets to predict and analyse network conditions; there were also a few limitations within the scope of this study. In terms of data acquisition, the datasets used were from approved and dedicated data stores, repositories and databanks; which did not cover every network parameter and channel condition influencing factor and scenario; for there are also the possibility of hetero-modal vision-based RF Channel and network parameters prediction, where more network parameters and channel conditions can be predicted at one go, using deep neural networks (i.e. DNN) and multiple cameras. From the prediction of handover methods, received power, beam forming data/patterns, and to even multipath transmissions; such systems can further enable efficient proactive and autonomous network decision making which would also improve overall network performance . Additionally, and it’s important to note that the image datasets (i.e. obstacle buildings) used where from a different scenario and environment from that of the network parameters as similarly proposed by some works with the advantage of reducing required time and data from training on site ; this situation can also sometimes affect the results from achieving a perfect score; but the excellent results obtained in this research work further confirms the rigorous ability of the algorithms and the hybrid model employed. So for optimal conditions within certain environments, the images should be taken from the same locations where the signal datasets are obtained.
Furthermore, many challenges and opportunities are associated with this novel approach, thereby necessitating more continuous research, collaborations across disciplines, algorithm and models development (for example extending the proposed OPL algorithm for interference and obstacle-penetration losses and also other channel conditions estimation algorithm such as the proposed Veni Vidi Dixi (VVD) algorithm; to minimize the challenges and exploit the huge potentials and opportunities of this hybrid approach to modern wireless network analyses, predictions and optimization.
6. Conclusions
In this work, the predictive analyses in the presence of obstacles (i.e. concrete buildings) of selected 5G wireless network parameters for a typical Outdoor Microcellular system of the SINR, Throughput or data rate and user Interference, was carried out using the modern predictive model approach of combining the received signal dataset and the image dataset of the obstacles using a hybrid high performance deep learning artificial intelligence fully connected CNN algorithm model (HP CNN); as a key novel approach to autonomous, more efficient network performance management and AI-driven network parameter and interference management. Datasets (including building images) from trustworthy and recognized data stores, portals, and sources were used for this study's research work, analyses, demonstrations and investigations; as a result, it may be assumed that the datasets are reliable and credible.
It is also worthy to note that the results obtained were excellent and at par with similar approaches which was carried out by time series based signal system and associated models . Furthermore, this research work obtained acceptable results within the required benchmarks by utilizing a sample dataset of 200 test sample points from the more than 56000 points obtained during the 5G test, which further confirms the efficiency of this system, rigorous ability of the intelligent algorithms and a pointer to how excellent results can still be obtained with limited datasets, limited resources, and with a faster approach which is needed in practice. Additionally, the analytical and predictive analyses of a representation of the user interference (i.e. I/PG) in the presence of obstacles was also successfully carried out, and also a new OPL algorithm which modeled and factored-in the important obstacle prediction loss, and it’s associated obtained acceptable results; was also proposed. Furthermore, the elegant mathematical modeling and optimization of a 5G network parameter (i.e. SINR) was demonstrated as an effective tool for engineers and network designers to analytically tune and manage network performance in subsystems and systems more efficiently. With diverse related works being carried out and more still to be proposed; there is no doubt that this novel hybrid intelligent approach presents great possibilities and capabilities for the modern wireless communications field and associated technologies for now and in the future.
Abbreviations

5G

Fifth Generation

ANN

Artificial Neural Network

C2V

Communicate to View

CNN

Convolutional Neural Network

CV

Computer Vision

DNN

Deep Neural Network

HP-CNN

High Performance Convolutional Neural Network

I/PG

Total User Interference per Power Gain

LOS

Line of Sight

MIMO

Multiple Input Multiple Output

ML

Machine Learning

NLOS

Non-line of Sight

OPL

Obstacle Penetration Loss

RMS

Root Mean Square

RNN

Recurrent Neural Network

RX

Receiver

SINR

Signal to Interference Noise Ratio

TX

Transmitter

V2C

View to Communicate

VVD

Veni Vixi Dixi

Author Contributions
Chikezie Kennedy Kalu is the sole author. The author read and approved the final manuscript.
Conflicts of Interest
The author declares no conflicts of interest.
References
[1] C. Dehos, J. González, A. De Domenico, D. Kténas, and L. Dussopt, “Millimeter-wave access and backhauling: The solution to the exponential data traffic increase in 5G mobile communications systems?” IEEE Commun. Mag., vol. 52, no. 9, pp. 88-95, Sep. 2014.
[2] K. Sakaguchi et al., “Millimeter-wave evolution for 5G cellular networks,” IEICE Trans. Commun., vol. E98-B, no. 3, pp. 388-402, Mar. 2015.
[3] Osseiran et al., “Scenarios for 5G mobile and wireless communications: The vision of the METIS project,” IEEE Commun. Mag., vol. 52, no. 5, pp. 26-35, May 2014.
[4] ITU-R Recommendation, “IMT vision-framework and overall objectives of the future development of IMT for 2020 and beyond,” Recommendation M. 2083, Sep. 2015.
[5] “IEEE Std. 802.11ad - 2016,” IEEE Standard Association, Dec. 2016.
[6] Y. Ghasempour, C. R. C. M. da Silva, C. Cordeiro, and E. W. Knightly, “IEEE 802.11ay: Next-generation 60 GHz communication for 100 Gb/s Wi-Fi,” IEEE Commun. Mag., vol. 55, no. 12, pp. 186-192, Dec. 2017.
[7] Yamamoto, K. Ogawa, T. Horimatsu, A. Kato, and M. Fujise, “Pathloss prediction models for intervehicle communication at 60 GHz,” IEEE Trans. Veh. Technol., vol. 57, no. 1, pp. 65-78, Jan. 2008.
[8] J. Park et al., “Extreme urllc: Vision, challenges, and key enablers,” arXiv preprint arXiv: 2001.09683, 2020.
[9] Alahi, A. Haque, and L. Fei-Fei, “RGB-W: When vision meets wireless,” in Proc. IEEE Int. Conf. Comput. Vision (ICCV), Dec. 2015.
[10] N. Takayuki et al., (2020): “ When Wireless Communications Meet Computer Vision in Beyond 5G”. October 2020.
[11] L. Simi´c, J. Arnold, M. Petrova, and P. Mähänen, “RadMAC: Radar enabled link obstruction avoidance for agile mm-wave beamsteering,” in Proc. ACM Workshop on Hot Topics in Wireless (HotWireless 2016), New York, NY, USA, Oct. 2016, pp. 61-65.
[12] K. Haneda, “Channel models and beamforming at millimeter-wave frequency bands,” IEICE Trans. Commun., vol. E98-B, no. 5, pp. 755- 772, May 2015.
[13] M. Di Renzo, “Stochastic geometry modeling and analysis of multitier millimeter wave cellular networks,” IEEE Trans. Wireless Commun., vol. 14, no. 9, pp. 5038-5057, Sep. 2015.
[14] M. Gapeyenko et al., “Analysis of human-body blockage in urban millimeter-wave cellular communications,” in Proc. IEEE Int. Conf. Commun. (ICC), Kuala Lumpur, Malaysia, May 2016, pp. 1-7.
[15] T. S. Rappaport, G. R. MacCartney, S. Sun, H. Yan, and S. Deng, “Small scale, local area, and transitional millimeter wave propagation for 5G communications,” IEEE Trans. Antennas Propag., vol. 65, no. 12, pp. 6474-6490, Dec. 2017.
[16] L. Liu, Y. Fan, J. Shu, and K. Yu, “A link quality prediction mechanism for WSNs based on time series model,” in Proc. Int. Conf. Ubiquitous Intell. & Comput. and Int. Conf. Autonomic & Trusted Comput. (UIC/ATC), Xian, Shaanxi, China, Oct. 2010, pp. 175-179.
[17] K. Farkas, T. Hossmann, F. Legendre, B. Plattner, and S. K. Das, “Link quality prediction in mesh networks,” Comput. Commun., vol. 31, no. 8, pp. 1497-1512, May 2008.
[18] J. Yao, S. S. Kanhere, and M. Hassan, “An empirical study of bandwidth predictability in mobile computing,” in Proc. ACM Int. Workshop Wireless Network Testbeds, Experimental Evaluation and Characterization (WiNTECH), San Francisco, CA, USA, Sep. 2008, pp. 11-18.
[19] J. Zhang and I. Marsic, “Link quality and signal-to-noise ratio in 802.11 WLAN with fading: A time-series analysis,” in Proc. IEEE Veh. Technol. Conf. (VTC2006-Fall), Montreal, Quebec, Canada, Sep. 2006, pp. 1-5.
[20] X. Long and B. Sikdar, “A real-time algorithm for long range signal strength prediction in wireless networks,” in Proc. IEEE Wireless Commun. and Networking Conf. (WCNC), Las Vegas, NV, USA, Apr. 2008, pp. 1120-1125.
[21] S. k. Doddalla and G. C. Trichopoulos, “Non-line of sight terahertz imaging from a single viewpoint,” in Proc. IEEE/MTT-S Int. Microw. Symp. (IMS), June 2018, pp. 1527-1529.
[22] Z. Meng et al., “Gait recognition for co-existing multiple people using millimeter wave sensing,” in Proc. AAAI Conf. Artif. Intell., vol. 34, no. 1, Feb. 2020, pp. 849-856.
[23] M. Jacob, S. Priebe, A. Maltsev, A. Lomayev, V. Erceg, and T. Kürner, “A ray tracing based stochastic human blockage model for the IEEE 802.11ad 60 GHz channel model,” in Proc. European Conf. Antennas Propag. (EuCAP), Rome, Italy, Apr. 2011, pp. 3084-3088.
[24] V. Degli-Esposti et al., “Ray-tracing-based mm-wave beamforming assessment,” IEEE Access, vol. 2, pp. 1314-1325, Oct. 2014.
[25] G. R. MacCartney, S. Deng, S. Sun, and T. S. Rappaport, “Millimeterwave human blockage at 73 GHz with a simple double knife-edge diffraction model and extension for directional antennas,” in Proc. IEEE Veh. Technol. Conf. (VTC2016-Fall), Montreal, Canada, Sep. 2016, pp. 1-6.
[26] H. H. Zhang and R. S. Chen, “Coherent processing and superresolution technique of multi-band radar data based on fast sparse bayesian learning algorithm,” IEEE Trans. Antennas Propag., vol. 62, no. 12, pp. 6217-6227, 2014.
[27] R. Kohavi, “A study of cross-validation and bootstrap for accuracy estimation and model selection,” in Proc. Int. Joint Conf. Artificial Intell. (IJCAI), Montreal, Quebec, Canada, Aug. 1995, pp. 1137-1143.
[28] Amidi and S. Amidi, (2018). Super VIP Cheatsheet: Deep Learning. November, 2018.
[29] So A. et al. The Applied Artificial Intelligence Workshop. Packt; 2020.
[30] Dadhich. Practical Computer Vision. Packt Publishing Ltd. 2018.
[31] M. Bierlaire. Optimization: Principles and Algorithms. EPFL Press; 2018.
[32] Y. Koda, K. Yamamoto, T. Nishio, and M. Morikura, “Measurement method of temporal attenuation by human body in off-the-shelf 60 GHz WLAN with HMM-based transmission state estimation,” Wireless Commun. Mobile Comput., vol. 2018, pp. 1-9, Apr. 2018.
[33] E. A. Garcia and H. He, “Learning from imbalanced data,” IEEE Trans. Knowl. Data Eng., vol. 21, no. 9, pp. 1263-1284, Sep. 2009.
[34] Ding and D. Tao, “Robust face recognition via multimodal deep face representation,” IEEE Trans. Multimedia, vol. 17, no. 11, pp. 2049-2058, 2015.
[35] Y. Koda et al., “Handover management for mmwave networks with proactive performance prediction using camera images and deep reinforcement learning,” IEEE Trans. Cogn. Commun. Netw., vol. 6, no. 2, pp. 802-816, 2020.
[36] Y. Koda et al., “Communication-efficient multimodal split learning for mmwave received power prediction,” IEEE Commun. Lett., vol. 24, no. 6, pp. 1284-1288, 2020.
[37] T. Mikuma, T. Nishio, M. Morikura, K. Yamamoto, Y. Asai, and R. Miyatake, “Transfer learning-based received power prediction using RGB-D camera in mmWave networks,” in Proc. IEEE Veh. Technol. Conf. (VTC2019-Spring), Kuala Lumpur, Malaysia, May 2019, pp. 1-5.
[38] S. Ji, W. Xu, M. Yang, and K. Yu, “3D convolutional neural networks for human action recognition,” IEEE Trans. Pattern Anal. Mach. Intell., vol. 35, no. 1, pp. 221-231, Jan. 2013.
[39] J. Biswas and M. Veloso, “Depth camera based indoor mobile robot localization and navigation,” in Proc. IEEE Int. Conf. Robotics and Automation (ICRA), St Paul, MN, USA, May 2012, pp. 1697-1702.
[40] N. Lazaros, G. C. Sirakoulis, and A. Gasteratos, “Review of stereo vision algorithms: From software to hardware,” Int. J. Optomechatronics, vol. 2, no. 4, pp. 435-462, Nov. 2008.
[41] X. Shi, Z. Chen, H. Wang, D. Yeung, W. Wong, and W. Woo, “Convolutional LSTM network: A machine learning approach for precipitation nowcasting,” in Proc. Neural Inform. Process. Syst. (NIPS), Montreal, Canada, Dec. 2015, pp. 802-810.
[42] V. Mnih et al., “Human-level control through deep reinforcement learning,” Nature, vol. 518, no. 7540, pp. 529-533, Feb. 2015.
[43] J. Gu et al., “Recent advances in convolutional neural networks,” Pattern Recogn., vol. 77, pp. 354-377, May 2018.
Cite This Article
  • APA Style

    Kalu, C. K. (2025). Computer Vision-based Prediction and Mathematical Optimization of 5G Wireless Cellular Network Parameters. International Journal of Wireless Communications and Mobile Computing, 12(2), 55-71. https://doi.org/10.11648/j.wcmc.20251202.11

    Copy | Download

    ACS Style

    Kalu, C. K. Computer Vision-based Prediction and Mathematical Optimization of 5G Wireless Cellular Network Parameters. Int. J. Wirel. Commun. Mobile Comput. 2025, 12(2), 55-71. doi: 10.11648/j.wcmc.20251202.11

    Copy | Download

    AMA Style

    Kalu CK. Computer Vision-based Prediction and Mathematical Optimization of 5G Wireless Cellular Network Parameters. Int J Wirel Commun Mobile Comput. 2025;12(2):55-71. doi: 10.11648/j.wcmc.20251202.11

    Copy | Download

  • @article{10.11648/j.wcmc.20251202.11,
      author = {Chikezie Kennedy Kalu},
      title = {Computer Vision-based Prediction and Mathematical Optimization of 5G Wireless Cellular Network Parameters
    },
      journal = {International Journal of Wireless Communications and Mobile Computing},
      volume = {12},
      number = {2},
      pages = {55-71},
      doi = {10.11648/j.wcmc.20251202.11},
      url = {https://doi.org/10.11648/j.wcmc.20251202.11},
      eprint = {https://article.sciencepublishinggroup.com/pdf/10.11648.j.wcmc.20251202.11},
      abstract = {Objective - To investigate, analyze and optimize (where needed) the properties and predictive analyses of selected 5G Mobile wireless network parameters (i.e. Signal to interference noise ratio (SINR) and Throughput as measures of network performance) and Interference conditions in the presence of building obstacles; using the novel approach of combining signal data and visual data in wireless communications. Methods- Using a sample set (i.e., 200 data points) of real life 5G Outdoor Micro cellular tests data and urban building image datasets from validated open source data stores; experimental, investigative and comparative analyses were carried out using the novel approach of combining signal data and visual data using Machine Learning (i.e. Computer Vision) Hybrid deep learning artificial intelligence CNN-based model (i.e., High performance CNN), analytical and mathematical optimization algorithms. The key idea is to leverage camera imagery and Machine Learning (Computer Vision) to successfully predict and analyze network parameters like SINR, Throughput and amount of Interference in the presence of signal obstacles which usually attenuate received signals aperiodically. Additionally obstacle related losses were analysed and network parameter optimization was also demonstrated. Results - The predictive analyses in the presence of obstacles (i.e. concrete buildings) of selected 5G wireless network parameters of SINR and Throughput were carried out successfully using the Hybrid High performance CNN model (HP CNN); with the model showing excellent efficiency by using lesser resources and image datasets from a different environment. Furthermore, the analytical and predictive analyses of a representation of the user interference (i.e. I/PG) in the presence of obstacles were also successfully carried out, and a new OPL algorithm was also proposed in relation to important user obstacle penetration losses. Additionally, the 5G network parameter (i.e. SINR) was mathematically optimized with reference to minimal interference as a demonstration of being an effective tool for engineers and network designers to analytically tune and manage network performance in subsystems and systems more efficiently. Conclusions - This work and diverse related works being carried out; gives no doubt that this novel hybrid intelligent approach presents great possibilities and capabilities for the modern wireless communications field and associated technologies for now and in the future; and its a key approach to autonomous, more efficient network performance management and AI-driven network parameter, attenuation, and interference management.},
     year = {2025}
    }
    

    Copy | Download

  • TY  - JOUR
    T1  - Computer Vision-based Prediction and Mathematical Optimization of 5G Wireless Cellular Network Parameters
    
    AU  - Chikezie Kennedy Kalu
    Y1  - 2025/07/19
    PY  - 2025
    N1  - https://doi.org/10.11648/j.wcmc.20251202.11
    DO  - 10.11648/j.wcmc.20251202.11
    T2  - International Journal of Wireless Communications and Mobile Computing
    JF  - International Journal of Wireless Communications and Mobile Computing
    JO  - International Journal of Wireless Communications and Mobile Computing
    SP  - 55
    EP  - 71
    PB  - Science Publishing Group
    SN  - 2330-1015
    UR  - https://doi.org/10.11648/j.wcmc.20251202.11
    AB  - Objective - To investigate, analyze and optimize (where needed) the properties and predictive analyses of selected 5G Mobile wireless network parameters (i.e. Signal to interference noise ratio (SINR) and Throughput as measures of network performance) and Interference conditions in the presence of building obstacles; using the novel approach of combining signal data and visual data in wireless communications. Methods- Using a sample set (i.e., 200 data points) of real life 5G Outdoor Micro cellular tests data and urban building image datasets from validated open source data stores; experimental, investigative and comparative analyses were carried out using the novel approach of combining signal data and visual data using Machine Learning (i.e. Computer Vision) Hybrid deep learning artificial intelligence CNN-based model (i.e., High performance CNN), analytical and mathematical optimization algorithms. The key idea is to leverage camera imagery and Machine Learning (Computer Vision) to successfully predict and analyze network parameters like SINR, Throughput and amount of Interference in the presence of signal obstacles which usually attenuate received signals aperiodically. Additionally obstacle related losses were analysed and network parameter optimization was also demonstrated. Results - The predictive analyses in the presence of obstacles (i.e. concrete buildings) of selected 5G wireless network parameters of SINR and Throughput were carried out successfully using the Hybrid High performance CNN model (HP CNN); with the model showing excellent efficiency by using lesser resources and image datasets from a different environment. Furthermore, the analytical and predictive analyses of a representation of the user interference (i.e. I/PG) in the presence of obstacles were also successfully carried out, and a new OPL algorithm was also proposed in relation to important user obstacle penetration losses. Additionally, the 5G network parameter (i.e. SINR) was mathematically optimized with reference to minimal interference as a demonstration of being an effective tool for engineers and network designers to analytically tune and manage network performance in subsystems and systems more efficiently. Conclusions - This work and diverse related works being carried out; gives no doubt that this novel hybrid intelligent approach presents great possibilities and capabilities for the modern wireless communications field and associated technologies for now and in the future; and its a key approach to autonomous, more efficient network performance management and AI-driven network parameter, attenuation, and interference management.
    VL  - 12
    IS  - 2
    ER  - 

    Copy | Download

Author Information
  • Independent Research Engineer, Egbeda, Nigeria

    Biography: Chikezie Kennedy Kalu’s field of research cuts across Technolo-gy, Engineering, ICT, Innovation and Management Science. He is from Nigeria and has a B. Eng. in Electronics Engineering from The University of Nigeria Nsukka; Nigeria (UNN) and a Masters (with Distinction) in Communication Engineering from The University of Manchester, UK. Chikezie has also presented his research works at various international conferences; and continues to receive more invites to share his works at international conferences and global webinars. He was also awarded the International Best Researcher in Management Science and Engineering at the Asia Research Awards (International Congress for Research Excellence 2024) in India, in March 2024. Chikezie’s research works and interests for which he has journals and book chapters publications, involves the use of modern data-driven technologies and methodologies to analyse, design, improve, manage and optimize diverse fields, which includes: Modern Wireless Communications Systems, Technologies, Innovation, Engineering, ICT, Health, Food/Agriculture, Sciences, Water, Energy, Environment, Man-agement Science, Construction, Projects, and various Social Ven-tures; for the good of humanity.

  • Abstract
  • Keywords
  • Document Sections

    1. 1. Introduction
    2. 2. Literature Review
    3. 3. Methodology
    4. 4. Results and Discussion
    5. 5. Limitations and Recommendations of Study
    6. 6. Conclusions
    Show Full Outline
  • Abbreviations
  • Author Contributions
  • Conflicts of Interest
  • References
  • Cite This Article
  • Author Information