2. Materials and Methods
2.1. Data Source
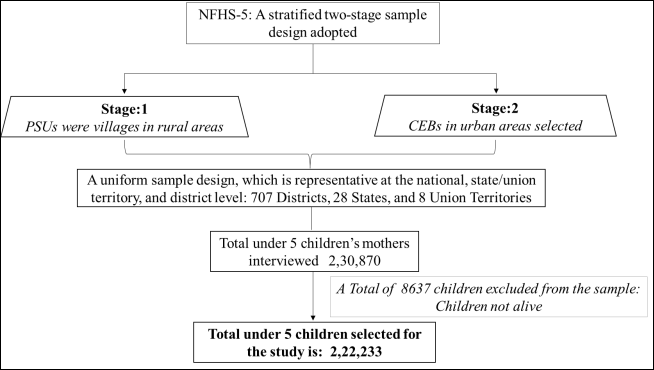
The data from the National Family Health Survey (NFHS) conducted in 2019-21, has been used in the study. It is an India-based Demographic and Health Survey (DHS). The NFHS is a comprehensive survey conducted in a representative sample of households across States/UTs and districts in India. The survey provides state and national data on various aspects of the maternal and child health domain. Child health-related information such as infant and child mortality, diarrohea, ARI, anaemia, and nutritional indicators were captured in the survey.
Figure 1. Flow chart of sample selection in NFHS-5 (2019-21).
2.2. Study Design and Sample Size
Two-stage stratified sampling techniques has been used for this large-scale survey. In urban area Census Enumeration Blocks (CEB) are selected and from rural residences, villages are selected as Primary sampling Units (PSUs). In the second stage, households have been selected both in urban and rural areas. NFHS-5 had gathered information from 636,699 household, in which 724,115 were women respondents (15-49) and 101,839 (15-54) were men respondents. Considering our study objectives, we have chosen responses from women respondents for the analysis. The total number of 230,870 mothers were interviewed, who had given live births in the previous five years from survey period. (n=230,870). Among them, 8637 dead children were excluded. Also, the children who lived elsewhere or who did not live with their mothers were also excluded (N=8637). Finally, a total of 2,22,233 under-five children’s mothers were interviewed. (
figure 1)
2.3. Methodology
Spatial Analysis: The technique of spatial autocorrelation analysis was utilized to identify patterns of spatial clusters (Ghosh et al., 2020). The current study used two methods to analyze the data. The first method is Moran's I, which provides a general indication of the spatial autocorrelation of a dataset. Another one is the local indicator of spatial association (LISA), which identifies spatial clusters or outliers for each location in a dataset.
Moran’s I: Measuring the overall clustering of a dataset across all districts can be done using global spatial autocorrelation, which quantifies the degree of spatial autocorrelation, and is often measured using Moran's I. Moran’s I statistics is a summary measure of spatial autocorrelation that evaluates the extent to which data points are random or perfectly clustered and similar to their spatial neighbours
| [22] | Anselin L. (2013). Spatial econometrics: methods and models (Vol. 4). Springer Science & Business Media. |
| [23] | Bivand R, Altman M, Anselin L (2022). Spatial Dependence: Weighting Schemes, Statistics and Models. Available from: https://cran.r-project.org/web/packages/spdep/spdep.pdf |
[22, 23]
. To measure spatial autocorrelation Moran’s I calculates a correlation coefficient that indicates the overall spatial autocorrelation of the dataset by measuring how similar an object is to its surrounding objects. The value of Moran’s- I ranges from −1 to +1
| [22] | Anselin L. (2013). Spatial econometrics: methods and models (Vol. 4). Springer Science & Business Media. |
| [23] | Bivand R, Altman M, Anselin L (2022). Spatial Dependence: Weighting Schemes, Statistics and Models. Available from: https://cran.r-project.org/web/packages/spdep/spdep.pdf |
| [24] | Ghosh K., Dhillon P., & Agrawal G. (2020). Prevalence and detecting spatial clustering of diabetes at the district level in India. Journal of Public Health, 28, 535-545. |
[22-24]
.
Local Indicators of Spatial Autocorrelation (LISA): Local Indicators of Spatial Autocorrelation (LISA) measure the extent of autocorrelation among the neighbourhood districts. The LISA values consent to the computation of its similarity with its neighbour districts and also test the level of significance for each location. LISA map portrays results in three scenarios-
1. Hot-Spots
High-high: High values with similar neighbours.
2. Cold-Spots:
Low-low: Low values with similar neighbours.
3. Spatial Outliers
a. Low-high: Low values but with higher values of neighbours.
b. High-low: High values but with low-value neighbours.
c. no significant local autocorrelation
The univariate and bivariate Moran’s I index measurements and spatial regression models were performed to assess the distribution of Acute Respiratory Infection among children in India.
Univariate Moran’s I: A Univariate Moran’s I analyzes the spatial autocorrelation of neighbouring values around a particular spatial location, which indicates how much spatial non-stationery and clustering is present in data. The formula used to calculate the Moran's I index is as follows:
Whereas
x
is the standardized weight matrix between observation i and j with zeroes on the diagonal
Bivariate Moran’s I: Bivariate Moran’s I looks at the local correlation between the outcome variable and particular region characteristics
| [22] | Anselin L. (2013). Spatial econometrics: methods and models (Vol. 4). Springer Science & Business Media. |
| [23] | Bivand R, Altman M, Anselin L (2022). Spatial Dependence: Weighting Schemes, Statistics and Models. Available from: https://cran.r-project.org/web/packages/spdep/spdep.pdf |
[22, 23]
.
Whereas
X and y: are the variables of interest
is the standardized weight matrix between observation i and j with zeroes on the diagonal
Univariate LISA: Univariate LISA is a method used to measure the spatial correlation of neighborhood values around a particular location
. This technique can help determine the spatial randomness and clustering level in the data. The formula for calculating the
[
] measure is as follows:
Bivariate LISA: Bivariate LISA was estimated to analyze the association between certain district characteristics and ARI prevalence. The bivariate LISA is presented below:
The spatial weights are only non-zero when two units, i and j, are neighbors
| [27] | Anselin L. (1995). Local indicators of spatial association—LISA. Geographical analysis, 27(2), 93-115. |
[27]
. Otherwise, it remains zero. As described by Anselin in 1995 and 2010, this method uses Queen Contiguity weights to represent whether spatial units share a boundary. If we denote the set of boundary points of unit I as the band (i), then we can define the Queen Contiguity Weight as follows:
Spatial units can share only one boundary point, such as a shared corner point on a grid of spatial units. However, a stronger condition is to require that some positive portion of their boundary be shared.
Spatial Regression Model
To establish the relationship between ARI prevalence and contextual correlates, we have applied and compared regression models: Ordinary Least Square (OLS), Spatial Error Model (SEM)
| [27] | Anselin L. (1995). Local indicators of spatial association—LISA. Geographical analysis, 27(2), 93-115. |
[27]
, and Spatial Lag Model (SLM)
| [22] | Anselin L. (2013). Spatial econometrics: methods and models (Vol. 4). Springer Science & Business Media. |
| [27] | Anselin L. (1995). Local indicators of spatial association—LISA. Geographical analysis, 27(2), 93-115. |
[22, 27]
, using Geoda.
Ordinary least square (OLS) regression model: We used the OLS regression model to determine the presence of autocorrelation in the error term. The OLS model confirmed the presence of spatial autocorrelation in the error term for the dependent variable. Therefore, we proceeded to estimate the SLM and SEM
| [22] | Anselin L. (2013). Spatial econometrics: methods and models (Vol. 4). Springer Science & Business Media. |
| [27] | Anselin L. (1995). Local indicators of spatial association—LISA. Geographical analysis, 27(2), 93-115. |
[22, 27]
. The SLM assumes that observations of the outcome variable are influenced by neighbouring areas, while the SEM accounts for the impact of variables that are not incorporated in the regression model but still affect the outcome variable. The SLM does not consider the spatial dependence of the error term, while the SEM does. The basic equation for OLS is expressed as follows:
Whereas
The spatial lag model (SLM): The spatial lag model (SLM) suggests that neighbouring units are spatially dependent and lag behind each other.
| [22] | Anselin L. (2013). Spatial econometrics: methods and models (Vol. 4). Springer Science & Business Media. |
| [23] | Bivand R, Altman M, Anselin L (2022). Spatial Dependence: Weighting Schemes, Statistics and Models. Available from: https://cran.r-project.org/web/packages/spdep/spdep.pdf |
[22, 23]
. A spatial lag model is a mathematical formula that is often used in spatial analysis. It can be written in the following format:
Whereas
is the residual
The spatial error model (SEM): On the other hand, the analysis considers the contribution of variables that were omitted from the model but may have a significant impact
. The following is the expression for a Spatial Error Model (SEM):
Whereas
is the residual
2.4. Dependent and Independent Variable
Acute Respiratory Infection (ARI): In the NFHS survey, mothers were asked if their children under the age of five had experienced a cough in the two weeks before the survey. This type of cough is characterized by quick, shallow breaths and chest discomfort. If the response was "yes," the corresponding variable was recoded as 1, indicating the presence of Acute Respiratory Infection (ARI). If the response was "no," it was recorded as 0, indicating no ARI.
Independent Variable: The covariates were selected from the previous studies in India
| [25] | Hasan M. M. Saha, K. K., Yunus R. M., & Alam K. (2022). Prevalence of acute respiratory infections among children in India: Regional inequalities and risk factors. Maternal and Child Health Journal, 26(7), 1594-1602. https://doi.org/10.1007/s10995-022-03289-7 |
| [26] | Varghese J. S., & Muhammad T. (2023). Prevalence, potential determinants, and treatment-seeking behaviour of acute respiratory infection among children under age five in India: Findings from the National Family Health Survey, 2019-21. BMC Pulmonary Medicine, 23(1), 195. |
[25, 26]
. We include the covariates that were found to increase the risk of ARI. The computation of the variables has been given below (
Table 1):
Table 1. Description of the Covariates.
Covariates | Description |
Households using unclean cooking fuel | The households use unclean cooking fuel for cooking. It includes kerosene, coal, lignite, charcoal, wood, straw/shrubs/grass, agricultural crops, animal dung, and other |
The household doesn't have a separate kitchen | The proportion of households without a separate kitchen |
Smoking exposure in the household | The proportion of households have smoking exposure (household members smoke inside the house). |
Rural household | The proportion of rural household |
Poor household | The proportion of households belongs to very poor and poor wealth quantile |
Illiterate mother | Proportion of illiterate mothers. |
Mothers smoke | Mothers with smoking behaviour. |
mothers with asthma/respiratory infection | Mothers living with asthma/respiratory infection |
Low birth weights | The proportion of children's birth weight <2500 grams |
Underweight children | The proportion of Children whose weight-for-age Z-score is below minus two standard deviations (-2 SD) from the median of the reference population are classified as underweight. |
Children ages <24 months | The age of the child at the time of the survey is recorded as <24 months |
The child had diarrhoea 2 weeks before the survey | A proportion of children had experienced diarrhoeal illnesses before the final two weeks of the survey. |
Particle matters 2.5 | Practical matters (PM2.5) concentration |
Multicollinearity
: The Variance Inflation Factors (VIFs) have been measured to find out the degree of multicollinearity in the model
| [28] | Midi H., Sarkar S. K., & Rana S. (2010). Collinearity diagnostics of binary logistic regression model. Journal of interdisciplinary mathematics, 13(3), 253-267. |
[28]
. The computed mean VIF is 2.15, which is less than the threshold value of five, indicating that multicollinearity does not exist in the analysed models.
3. Results
3.1. Spatial Clustering in the Prevalence of ARI Among Children in India (2019-21)
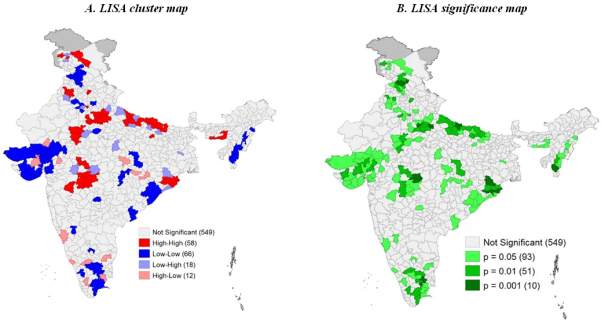
Figure 2. LISA cluster map and significance map for ARI prevalence among children in districts of India, 2019–21 (NFHS-V).
The figure describes the LISA cluster map and significance map for ARI prevalence among children across districts in India, 2019–21 (NFHS-5). The results showed that out of 707 districts 58 districts are detected as hotspot areas (
figure 2 (A)) with a Moran’s Index value of 0.27. Most of the hot-spot districts are located in Uttar Pradesh, Maharashtra, Panjab, Jammu & Kashmir, Odisha and Assam. On the other hand, 66 districts are showing cold spot areas from Gujarat, Tamil Nadu, and Mizoram. The level of significance map represents around 152 districts reported in clusters with ≤5% significance level (
Figure 2 (B)).
3.2. Univariate Moran’s I
The table (
Table 2) indicates that there is spatial autocorrelation between children who had ARI and those living in areas with high levels of Particulate Matter 2.5 (M’I=0.229), children of illiterate mothers (M’I=0.157), children who had diarrhoea 2 weeks before the survey (M’I=0.139), exposure to smoking in the household, low birth weight (M’I=0.068), and underweight children (M’I=0.052).
3.3. Bivariate Morans’I
Table 2 displays the values of bivariate Moran’s I statistics in India. The results indicate that the highest univariate Moran’s I among the predictors was the concentration of Particle Matters 2.5 (Moran’s I=0.953, p <0.001), followed by smoking exposure in the household (Moran’s I=0.81; p<0.001), mothers' smoking behaviour (Moran’s I = 0.778, p-value = 0.001), and poor household (Moran’s I=0.769; p<0.001).
Table 2. Univariate and Bivariate Moran’s I for ARI and predictors in India, 2019-21.
Predictors | Univariate Moran's I | Bivariate Moran's I |
ARI prevalence (%) | 0.271* | NA |
Households using unclean cooking fuel (%) | 0.703* | 0.070* |
The household doesn't have a separate kitchen (%) | 0.780* | 0.146* |
Smoking exposure in the household (%) | 0.808* | 0.097* |
Rural household (%) | 0.441* | 0.042* |
Poor household (%) | 0.769* | 0.088* |
Illiterate mother (%) | 0.680* | 0.164* |
Mothers smoke (%) | 0.778* | -0.059* |
mothers with asthma/respiratory infection (%) | 0.287* | 0.039* |
Low Birth Weights (%) | 0.563* | 0.051* |
Underweight children (%) | 0.660* | 0.035* |
Children ages <24 months (%) | 0.180* | -0.037* |
The child had diarrhoea 2 weeks before the survey | 0.405* | 0.155* |
Particle matters 2.5 | 0.953* | 0.241* |
3.4. Spatial Association Between ARI Prevalence with the Covariates Across the 707 Districts in India
The spatial relationship with using univariate LISA maps with the covariates represent in
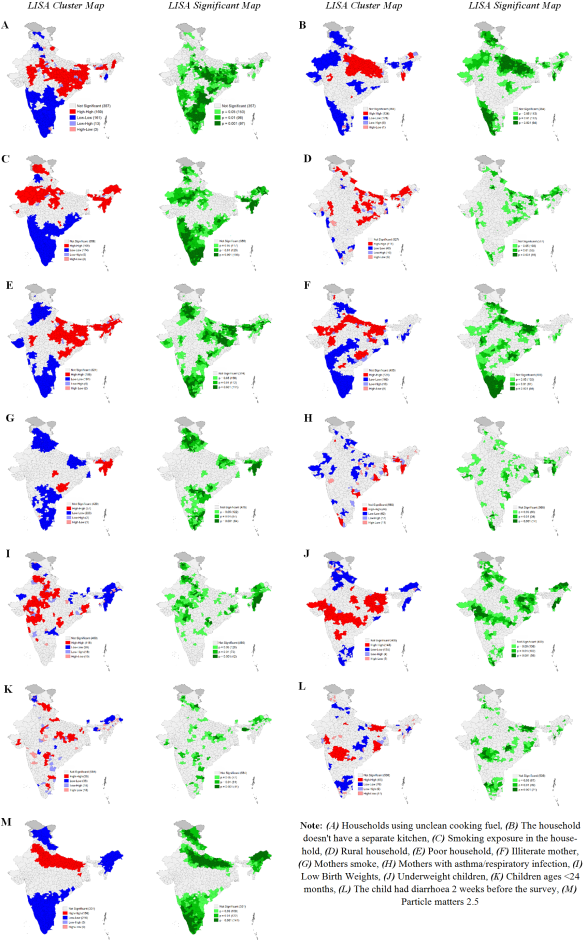
figure 2. The Moran's I statistic was 0.70, suggesting a significant high spatial clustering dependence in the prevalence of using unclean cooking fuel in India (
figure 3 (A)). A total of 169 districts from the central region (West Bengal, Odisha, Bihar, Jharkhand), some parts of the central region (Madhya Pradesh and Chhattisgarh), northern region (Rajasthan, and Uttarakhand), and the northeastern region (Assam, Nagaland) formed the hot spots (high-high), while 161 districts from all southern states (Andhra Pradesh, Telangana, Tamil Nadu, Karnataka, and Kerala), some parts of northern states (Jammu & Kashmir and Punjab), one northern state (Mizoram), and one western state (Maharashtra) were identified as the cold spots (low-low) for household using unclean cooking fuel (Moran’s I = 0.70, p-value = 0.001) across India.
The univariate LISA cluster map of households without a separate kitchen (Moran’s I = 0.78, p-value = 0.001) revealed 134 hotspots and 178 cold spots (
figure 3 (B)). The majority of hotspots are situated in the eastern region (Jharkhand, Bihar), central region (Uttar Pradesh, Madhya Pradesh, and Chhattisgarh), and some parts of the northeastern region (Arunachal Pradesh). Cold spots, on the other hand, are located in the western states (Gujarat), northern states (Rajasthan, Jammu & Kashmir, Punjab, and Himachal Pradesh), southern states (sections of Kerala, Karnataka, and Tamil Nadu), and northeastern states (Sikkim, Assam, Meghalaya, and Mizoram).
In the case of household smoking exposure, a total of 168 hot spot districts were detected in India (Moran’s I = 0.81, p-value < 0.001) (
figure 3 (C)). Most of the hotspot districts were located in the northeastern states (parts of Assam, Arunachal Pradesh, Meghalaya, Manipur, Tripura, and Mizoram), western state (Gujarat), central region (Uttar Pradesh and Madhya Pradesh), and the northern region (Rajasthan) of India. Additionally, 174 cold-spot districts were identified in the southern (Kerala, Karnataka, Tamil Nadu, Andhra Pradesh, and Odisha), northern (Punjab), and western (some from Maharashtra) regions of India.
The analysis of rural resident children using a Univariate LISA cluster map revealed a Moran’s I value of 0.44 with a p-value of 0.001 (
figure 3 (D)). This identified 111 "hotspots" and 48 "cold spots". The majority of hotspots are concentrated in Northern states (Himachal Pradesh, Jammu & Kashmir, Uttarakhand), Eastern states (parts of Bihar, Jharkhand, Orissa, West Bengal), Central regions (Uttar Pradesh and Madhya Pradesh), and North Eastern states (Assam, Arunachal Pradesh, Meghalaya, and Tripura). Conversely, hotspot incidence is lower in certain parts of Southern states (such as Karnataka, Andhra Pradesh, Tamil Nadu) and Western states (Maharashtra, Gujarat) in India.
In the case of poor households, a total of 188 hot-spot districts have been identified (Moran’s I = 0.77, p-value < 0.001) (
figure 3 (E)). The hot-spot districts are located in the following regions: North-eastern states (Assam, Arunachal Pradesh, Meghalaya, Manipur, Nagaland, and Tripura), eastern states (Bihar, Jharkhand, Odisha, and West Bengal), central India (Madhya Pradesh, Uttar Pradesh, Chhattisgarh, and some districts of Madhya Pradesh). Additionally, 181 districts from southern states (Kerala, Karnataka, Tamil Nadu, and Telangana), western states (some parts of Rajasthan, Gujarat, and Maharashtra), and northern states (Punjab, Himachal Pradesh, Haryana, and Uttarakhand) formed the cold spots (low-low) of poor wealth quintile children across India.
In addition, the Univariate LISA cluster map of literate mothers showed a Moran’s I of 0.68 with a p-value of 0.001, and it identified 124 hotspots and 166 cold spots (
figure 3 (F)). The hotspots were observed in districts located in Central India (Uttar Pradesh, Madhya Pradesh, and Chhattisgarh), Eastern India (Bihar and Jharkhand), South India (Telangana and Karnataka), and some districts in the Western part (Rajasthan, Gujarat, and Maharashtra). On the other hand, the cold spots were found in districts located in Southern India (Tamil Nadu, Kerala, Karnataka), Northern India, and in some districts in Western India (Maharashtra) and Northeastern states (Tripura, Mizoram, and Sikkim) in India.
The Univariate LISA cluster map of mother’s smoking behaviour (Moran’s I = 0.79, p-value = 0.001) revealed 57 hotspots and 233 cold spots (
figure 3 (G)). The majority of the hotspots are situated in the North-eastern region (Tripura, Mizoram, Manipur, Meghalaya, and Assam), with some in southern areas (Andhra Pradesh and Telangana) and a few in the central part (Madhya Pradesh) of India. The cold-spot districts are located in the Northern (Jammu & Kashmir, Delhi, Uttarakhand, Punjab, and Haryana), Eastern (Bihar, Jharkhand, and West Bengal), and southern parts (Maharashtra, Karnataka, Tamil Nadu, and Andhra Pradesh) of the country.
Similarly, in the univariate LISA cluster map of mothers with asthma/respiratory infection, a Moran’s I of 0.29 with a p-value of less than 0.001 identified 58 hotspots and 66 cold spots (
figure 3 (H)). Most of the hotspots are in Central (Uttar Pradesh and Madhya Pradesh), northern (Ladakh, Jammu & Kashmir, Rajasthan, Panjab), and western (Maharashtra) regions. The cold-spot districts are located in the Western region (Gujarat), Northern (Himachal Pradesh), and Southern (Tamil Nadu and Kerala) parts of India.
Likewise, the univariate LISA cluster map of children born with Low Birth Weights (LBW) revealed a Moran’s I of 0.56 with a p-value of less than 0.001, identifying 118 hotspots and 99 cold spots (
figure 3 (I)). The majority of hotspots are in the Eastern region (West Bengal), Central (Uttar Pradesh and Madhya Pradesh), western (Gujarat and Maharashtra), and some parts of the northern (Punjab and Haryana). The cold-spot districts are located in the Northeastern region (Assam, Meghalaya, Manipur, Mizoram, and Arunachal Pradesh), northern (Jammu & Kashmir, Rajasthan), and southern (Andhra Pradesh and Telangana) parts of India.
Similarly, the univariate LISA cluster map of underweight children revealed a Moran's I of 0.66 with a p-value of less than 0.001, identifying 148 hotspots and 135 cold spots (
figure 3 (J)). The majority of hotspots were in the Eastern region (Bihar, West Bengal, Odisha, and Jharkhand), western (Gujarat and Maharashtra), some parts of central (Madhya Pradesh and Chhattisgarh), and southern (Karnataka and Telangana) India. The cold-spot districts were located in the northeastern, northern, and southern parts of India.
The univariate LISA cluster map of children ages under 24 months showed a Moran's I of 0.18 with a p-value below 0.001 (
figure 3 (K)). This identified 50 hotspots and 33 cold spots. The majority of hotspots were found in the Eastern (Bihar and Jharkhand), Central (Uttar Pradesh and Madhya Pradesh), Southern (Tamil Nadu and Karnataka), and Northern (Himachal Pradesh and Uttarakhand) parts of India. The cold-spot districts were located in the Northeastern part (Assam, Arunachal Pradesh, and Meghalaya) and the Northern part (Jammu & Kashmir) of India.
Figure 3. Univariate LISA cluster and significance maps for independent variables for districts of India, 2019–21.
The univariate LISA cluster map of The child had diarrhoea 2 weeks before the survey showed a Moran's I of 0.41 with a p-value below 0.001, indicating 65 hotspots and 76 cold spots (
Figure 2 (L)). The majority of hotspots were found in the Eastern region (Bihar and Odisha) and western parts of India (Gujarat and Maharashtra). The cold-spot districts were located in Southern India (Tamil Nadu and Kerala), some parts of northern India (Nagaland and Manipur), and northern India (Punjab, Uttarakhand, and Himachal Pradesh).
The univariate LISA cluster map of Particulate Matter 2.5 revealed a Moran's I value of 0.95, indicating statistical significance with a p-value less than 0.001 (
Figure 3 (M)). The analysis identified 156 hotspots and 216 cold spots. Hotspots were predominantly concentrated in the Central region (Uttar Pradesh, Bihar, Madhya Pradesh) and northern region (Punjab, Haryana, and Rajasthan). Cold-spot districts were primarily located in the southern and northeastern states, as well as in certain areas of northern India.
3.5. Bivariate LISA
The Bivariate LISA cluster map shows the spatial correlation between the prevalence of ARI among children and various factors in the districts of India. On the other hand, the LISA significance map indicates that districts are clustered with a significance level of ≤ 5% (
Figure 4).
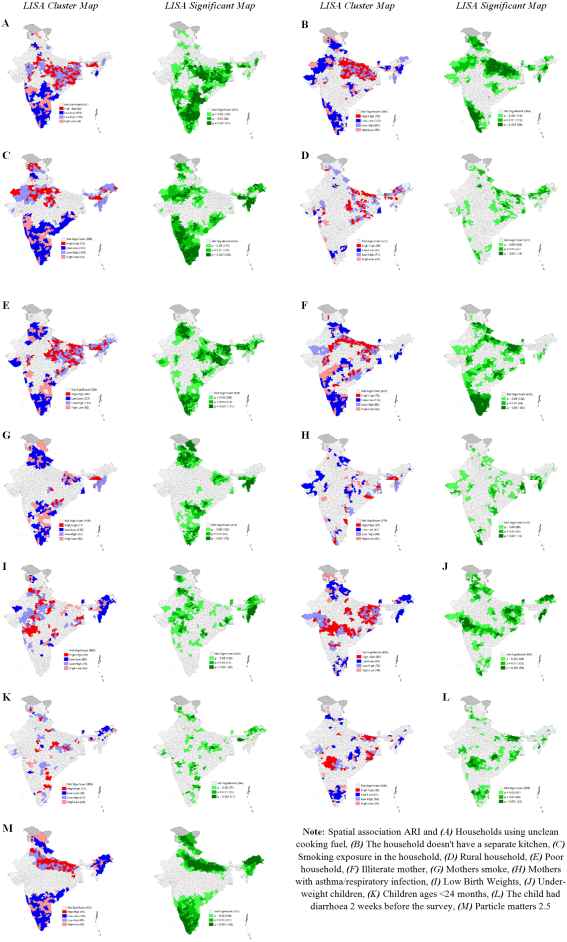
The LISA cluster map identifies 82 hot spots for ARI and households using unclean cooking fuel out of 707 districts (
Figure 4 (A)). These hot spots are located in the Central (Uttar Pradesh, Madhya Pradesh, Chhattisgarh), Eastern (Bihar, Orissa, Jharkhand, West Bengal), and northeastern (Assam, Meghalaya) regions of India. On the other hand, 110 districts have been identified as cold-spot areas in Southern (Karnataka, Tamil Nadu, Andhra Pradesh, Telangana, and Kerala) and some districts in northern (Punjab and Haryana) and northeast (Mizoram) states in India. The level of significance map shows that approximately 346 districts are clustered with a significance level of ≤ 5%.
Additionally, the LISA cluster map identifies 78 hot spots for ARI and households without a separate kitchen (
Figure 4 (B)). These hot spots are located in the eastern (Bihar, Jharkhand and West Bengal) and central (Uttar Pradesh and Madhya Pradesh) areas of India. On the other hand, 120 districts have been identified as cold-spot areas in South (Karnataka, Tamil Nadu, and Kerala), North (Jammu & Kashmir, Himachal Pradesh, Uttarakhand, Punjab, and Rajasthan), West (Gujarat), and northeast (Assam, Nagaland, and Manipur) in India. The level of significance map shows that approximately 319 districts are clustered with a significance level of ≤ 5%.
Furthermore, the LISA cluster map identifies 73 hot spots for ARI and smoking exposure in households out of 707 districts (
Figure 4 (C)). These hot spots are located in the Western (Rajasthan), Central (Uttar Pradesh and Madhya Pradesh), Northern (Jammu & Kashmir, Ladakh), and Northeastern (Assam, Meghalaya, Arunachal Pradesh) regions of India. On the other hand, 121 districts have been identified as cold-spot areas in Southern (Karnataka, Tamil Nadu, Andhra Pradesh, Telangana, and Kerala) and some districts in northern (Punjab and Haryana) states in India. The level of significance map shows that approximately 347 districts are clustered with a significance level of ≤ 5%.
Moreover, the LISA cluster map identifies 50 hot spots for ARI and rural households out of 707 districts (
Figure 4 (D)). These hot spots are located in the Eastern (Bihar and Jharkhand), Central (Uttar Pradesh, Madhya Pradesh, and Chhattisgarh), and Northeast (Assam, Meghalaya, and Arunachal Pradesh) in India. On the other hand, 35 districts have been identified as cold-spot areas in the South (Tamil Nadu and Kerala) and some districts in the West (Gujarat and Maharashtra) and East (West Bengal) of India. The level of significance map shows that approximately 176 districts are clustered with a significance level of ≤ 5%.
Additionally, the LISA cluster map identifies 86 hot spots for ARI and poor households out of 707 districts (
Figure 4 (E)). These hot spots are located in the Eastern (Bihar, Jharkhand, Orissa, West Bengal), Central (Uttar Pradesh, Madhya Pradesh), and Northeastern (Assam, Meghalaya, Arunachal Pradesh) in India. On the other hand, 121 districts have been identified as cold-spot areas in Southern (Kerala, Karnataka, and Tamil Nadu), Western (Gujarat and Maharashtra), and northern (Punjab, Haryana, Himachal Pradesh, and Uttarakhand) states in India. The level of significance map shows that approximately 379 districts are clustered with a significance level of ≤ 5%.
Furthermore, the LISA cluster map shows 72 hot spots for ARI and illiterate mothers out of 707 districts (
Figure 4 (F)). These hot spots are located in the Eastern (Bihar, Jharkhand, Orissa, West Bengal) and Central (Uttar Pradesh, Madhya Pradesh) regions of India. On the other hand, 114 districts have been identified as cold-spot areas in Southern (Karnataka, Kerala, and Tamil Nadu), Northern states (Mizoram, Manipur, and Nagaland), and Northern (Punjab, Haryana, Himachal Pradesh, and Uttarakhand) in India. The level of significance map shows that approximately 300 districts are clustered with a significance level of ≤ 5%.
Finally, the map demonstrates 17 hot spots for Acute Respiratory Infection (ARI) and exposure to maternal smokeout in 707 districts in India (
Figure 4 (G)). These hot spots are located in the Northeast region (specifically Assam and Meghalaya) and the Central region (Madhya Pradesh and Chhattisgarh). On the other hand, 133 districts have been identified as cold-spot areas in the Southern region (Kerala, Karnataka, Andhra Pradesh, and Tamil Nadu), the northern states (Jammu and Kashmir, Punjab, Haryana, Uttarakhand, and Himachal Pradesh), and some districts in the Eastern part (West Bengal and Bihar) of India. The significance map demonstrates that around 285 districts are clustered with a significance level of ≤ 5%.
Figure 4. Bivariate LISA cluster and significance maps for childhood ARI and independent variables for districts of India, 2019–21.
The LISA cluster map identifies several hot spots for ARI in India (
Figure 4 (H)). Out of 707 districts examined, 27 hot spots for ARI and mothers with asthma/respiratory infection were found in the Northeast (Assam and Meghalaya), eastern (West Bengal and Orissa), and southern (Andhra Pradesh and Kerala) regions. Alternatively, 47 districts have been identified as cold-spot areas in central (Uttar Pradesh, Madhya Pradesh, and Chhattisgarh) and northern (Rajasthan, Himachal Pradesh, Uttarakhand) India. The level of significance map shows that approximately 133 districts are clustered with a significance level of ≤ 5%.
Additionally, the LISA cluster map also identifies hot spots for ARI and Low Birth Weights, with 59 hot spots located in the Western (Maharashtra), Central (Uttar Pradesh, Madhya Pradesh, and Chhattisgarh), Northern (Punjab, Haryana), and Eastern (West Bengal, Orissa) regions, and cold-spot areas located in Northeastern states (Arunachal Pradesh, Nagaland, Mizoram, Manipur, Sikkim) and some districts in northern India (Rajasthan and Jammu & Kashmir). The significance map shows that approximately 243 districts are clustered with a significance level of ≤ 5% (
Figure 4 (I)).
Similarly, the LISA cluster map identifies hot spots for ARI and underweight children, with 80 hot spots located in the Eastern (West Bengal, Jharkhand, Bihar, and Orissa), Central (Madhya Pradesh, Uttar Pradesh, Chhattisgarh), Western (Maharashtra, Gujarat), and Southern (Karnataka) regions, and cold-spot areas in the Northern states, Northeast, and Southern regions of India. The level of significance map shows approximately 294 districts clustered with a significance level of ≤ 5% (
Figure 4 (J)).
Moreover, hot spots for ARI and children ages <24 months are identified, with 21 hot spots located in Central (Chattisgarh, Uttar Pradash and Madhya Pradesh) and Southern India ((Andhra Pradesh, Tamil Nadu) and cold-spot areas identified in the Northeast (Arunachal Pradesh and Assam and Sikkim) and some districts from Northern (Jammu & Kashmir) state. The significance map shows approximately 119 districts clustered with a significance level of ≤ 5% (
Figure 4 (K)).
Additionally, hot spots for ARI and children who had diarrhea 2 weeks before the survey are identified. The hot spots are located in the Western (Maharastra), Eastern (Orissa, West Bengal and Bihar), and Central region (Madhya Pradesh) of India, while cold-spot areas are found in Central, Southern, Northeastern, and Northern parts of India. The significance map shows that approximately 167 districts are clustered with a significance level of ≤ 5% (
Figure 4 (L)).
Finally, hot spots for ARI and Particle Matter 2.5 are identified in the eastern (Bihar, West Bengal, and Jharkhand), central (Uttar Pradesh and Madhya Pradesh), and northern (Panjab, Haryana, Delhi) areas of India, while cold-spot areas are found in Northeastern (Arunachal Pradesh, Nagaland, Mizoram, Manipur, and Assam), Southern (Karnataka, Tamil Nadu, Andhra Pradesh, Telangana, and Kerala), and Northern (Jammu & Kashmir, Himachal Pradesh, Uttrakhand) India. The significance map shows that approximately 372 districts are clustered with a significance level of ≤ 5% (
Figure 4 (M)).
3.6. Spatial Association Between ARI with the Covariates Across the Districts in India (2019-21)
The spatial regression estimates for children with ARI and its covariates across 707 districts of India in 2021 are provided in
table 3. We examined three models: OLS, SLM, and SEM. According to the theory of spatial regression models, the model with the lowest AIC value and the highest R
2 value is regarded as the best-fit model.
Based on the Ordinary Least Squares (OLS) estimate, it was confirmed that smoking exposure in the household (β: 0.2, p < 0.001), living in a rural area (β: 0.01), having an illiterate mother (β: 0.01, p < 0.001), having a mother with asthma/respiratory infection (β: 0.33), and low birth weight (β: 0.06, p < 0.001) were all significant predictors of children's Acute Respiratory Infection (ARI) in India. Additionally, experiencing diarrhea two weeks before the survey (β: 0.14) and exposure to particle matters 2.5 (β: 0.02) were found to be significant spatial predictors of children's ARI. The adjusted R 2 value was 0.25, and the AIC value was 2,849.
The Spatial Lag Model (SLM) estimate confirmed that smoking exposure in the household (β: 0.02), living in rural households (β: 0.01), having a mother with asthma/respiratory infection (β: 0.28), low birth weight (β: 0.05), experiencing diarrhea two weeks before the survey (β: 0.13), and exposure to particle matters 2.5 (β: 0.01) were significant spatial predictors of children's ARI in India. The adjusted R 2 value was 0.32, and the AIC value was 2,803.
According to our model estimates, the spatial error model (SEM) had the lowest AIC and the highest adjusted R2 value, making it the best-fit model among the three. The spatial error model had an AIC value of 2,795 and an adjusted R-squared value of 0.33. Interestingly, the value of Lambda (spatial autoregressive coefficient)/error lag value was 0.40 (p < 0.001), which indicates that spatial influence on ARI prevalence exists due to omitted variables do not present in the SEM.
The results show that Smoking exposure in the household (β: 0.03, p<0.05), mothers with asthma/respiratory infection (β: 0.27, p<0.001), children born with low birth weights (β: 0.06, p<0.01), children who had diarrhoea 2 weeks before the survey (β: 0.15, p<0.001), and concentration of particulate matter 2.5 (β: 0.02, p<0.001) were positively associated with ARI prevalence.
The model shows that if household smoking exposure in a district increases by 10%, then the prevalence of ARI in children increases by 3%. Similarly, if the percentage of mothers with asthma/respiratory infection in a district increases by 10%, then the prevalence of ARI in children increases by 27%. Likewise, an increase of 10% in the prevalence of low birth weight and diarrhea in children in a district result in a 6% and 15% increase in ARI prevalence, respectively. Additionally, if the concentration of particulate matter 2.5 in a district increases by 10%, then the ARI prevalence increases by 2%.
Table 3. Spatial regression model for estimating spatial association between ARI prevalence and covariates in India, 2019-21.
Covariates | OLS | SLM | SEM |
Households using unclean cooking fuel (%) | -0.02 | -0.02* | -0.02 |
The household doesn't have a separate kitchen (%) | -0.01 | -0.01 | -0.01 |
Smoking exposure in the household (%) | 0.02*** | 0.02*** | 0.03* |
Rural household (%) | 0.01* | 0.01* | 0.01 |
Poor household (%) | 0.02 | 0.01 | 0.01 |
Illiterate mother (%) | 0.01* | 0.01 | 0.01 |
Mothers smoke (%) | -0.02** | -0.02 | -0.01 |
Mothers with asthma/respiratory infection (%) | 0.33*** | 0.28*** | 0.27*** |
Low Birth Weights (%) | 0.06*** | 0.05*** | 0.06** |
Underweight children (%) | -0.01 | -0.01 | 0.01 |
Children ages <24 months (%) | -0.04* | -0.04* | -0.04 |
The child had diarrhoea 2 weeks before the survey | 0.14*** | 0.13*** | 0.15*** |
Particle matters 2.5 | 0.02*** | 0.01* | 0.02* |
Number of Observations | 707 | 707 | 707 |
Lag coefficient (Rho) | - | 0.35*** | - |
Lag coefficient (Lambda) | - | - | 0.40*** |
Akaike info criterion (AIC) | 2849.29 | 2802.87 | 2794.77 |
Adjusted R-squared | 0.252754 | 0.318969 | 0.330429 |
4. Discussion
The present study focuses on identifying the spatial clustering of ARI among children (0-59 months) and the spatial association with the covariates across the districts in India using NFHS-5 (2019-21) data.
The results of Moran’s I=0.27 (p<0.001) indicate that spatial clustering exists in the prevalence of ARI among children across the districts in India. As a result, it detects 58 hot-spot and 66 cold-spot districts in India. Most of the hot-spot districts are from Uttar Pradesh, Bihar, Delhi, and some districts from Maharashtra, Panjab, Jammu & Kashmir, Odisha and Assam. A possible reason may be the districts with the highest occurrences of ARI cases were primarily located in the states/union territories of Uttar Pradesh, Bihar, Delhi, Haryana, and Punjab, which are inhabited by Indo-Gangetic Plain residents
| [29] | Balasubramani K., Prasad K. A., Kodali N. K., Abdul Rasheed N. K., Chellappan S., Sarma D. K.,... & Balabaskaran Nina P. (2022). Spatial epidemiology of acute respiratory infections in children under 5 years and associated risk factors in India: District-level analysis of health, household, and environmental datasets. Frontiers in Public Health, 10, 906248. |
[29]
. The northern and northwest borders of the western section of Punjab are adjacent to the Khyber Pakhtun Khawan, the snowcapped Hindu Kush mountains, and the high Karakoram Range
| [13] | Kumar S. G., Majumdar A., Kumar V., Naik B. N., Selvaraj K., & Balajee K. (2015). Prevalence of acute respiratory infection among under-five children in urban and rural areas of puducherry, India. Journal of natural science, biology, and medicine, 6(1), 3. |
| [30] | Aftab A., Noor A., & Aslam M. (2022). Housing quality and its impact on Acute Respiratory Infection (ARI) symptoms among children in Punjab, Pakistan. PLOS Global Public Health, 2(9), e0000949. |
[13, 30]
. The increased dry seasonal pattern in western Punjab
| [13] | Kumar S. G., Majumdar A., Kumar V., Naik B. N., Selvaraj K., & Balajee K. (2015). Prevalence of acute respiratory infection among under-five children in urban and rural areas of puducherry, India. Journal of natural science, biology, and medicine, 6(1), 3. |
| [30] | Aftab A., Noor A., & Aslam M. (2022). Housing quality and its impact on Acute Respiratory Infection (ARI) symptoms among children in Punjab, Pakistan. PLOS Global Public Health, 2(9), e0000949. |
[13, 30]
may result in a higher likelihood of children experiencing ARI symptoms. During dry seasons, pathogens are often transported in the air with dust, thereby increasing the risk of infections in children
| [31] | Akinyemi J. O., & Morakinyo O. M. (2018). Household environment and symptoms of childhood acute respiratory tract infections in Nigeria, 2003-2013: A decade of progress and stagnation. BMC Infectious Diseases, 18(1). https://doi.org/10.1186/s12879-018-3207-5 |
[31]
. Numerous studies have highlighted a correlation between higher population density and urbanization with an increased prevalence of ARI. Regions with high population density, such as Uttar Pradesh, Punjab, Bihar, and West Bengal (with a density of >800 persons/sq. km), have exhibited a high incidence of ARI
| [29] | Balasubramani K., Prasad K. A., Kodali N. K., Abdul Rasheed N. K., Chellappan S., Sarma D. K.,... & Balabaskaran Nina P. (2022). Spatial epidemiology of acute respiratory infections in children under 5 years and associated risk factors in India: District-level analysis of health, household, and environmental datasets. Frontiers in Public Health, 10, 906248. |
| [32] | Mueller D., Uibel S., Braun M., Klingelhoefer D., Takemura M., & Groneberg D. A. (2011). Tobacco smoke particles and indoor air quality (ToPIQ)—The protocol of a new study. Journal of Occupational Medicine and Toxicology, 6(1), 35. https://doi.org/10.1186/1745-6673-6-35 |
[29, 32]
. This association between high population density and ARI prevalence has been highlighted in various studies
| [25] | Hasan M. M. Saha, K. K., Yunus R. M., & Alam K. (2022). Prevalence of acute respiratory infections among children in India: Regional inequalities and risk factors. Maternal and Child Health Journal, 26(7), 1594-1602. https://doi.org/10.1007/s10995-022-03289-7 |
| [33] | Savitha A. K., & Gopalakrishnan S. (2018). Determinants of acute respiratory infections among under five children in a rural area of Tamil Nadu, India. Journal of family medicine and primary care, 7(6), 1268-1273. |
[25, 33]
, indicating that population density may be a significant contributing factor to the prevalence of ARI. Another thing is that bidi consumption is highly prevalent in the states of West Bengal, Himachal Pradesh, Haryana, Uttarakhand, and Madhya Pradesh so most of the hotspot districts for ARI hotspot located in those states
| [29] | Balasubramani K., Prasad K. A., Kodali N. K., Abdul Rasheed N. K., Chellappan S., Sarma D. K.,... & Balabaskaran Nina P. (2022). Spatial epidemiology of acute respiratory infections in children under 5 years and associated risk factors in India: District-level analysis of health, household, and environmental datasets. Frontiers in Public Health, 10, 906248. |
[29]
. Tobacco consumption and smoking behaviours, increase indoor air pollution, which increase the prevalence ARI
| [29] | Balasubramani K., Prasad K. A., Kodali N. K., Abdul Rasheed N. K., Chellappan S., Sarma D. K.,... & Balabaskaran Nina P. (2022). Spatial epidemiology of acute respiratory infections in children under 5 years and associated risk factors in India: District-level analysis of health, household, and environmental datasets. Frontiers in Public Health, 10, 906248. |
| [32] | Mueller D., Uibel S., Braun M., Klingelhoefer D., Takemura M., & Groneberg D. A. (2011). Tobacco smoke particles and indoor air quality (ToPIQ)—The protocol of a new study. Journal of Occupational Medicine and Toxicology, 6(1), 35. https://doi.org/10.1186/1745-6673-6-35 |
[29, 32]
. Our study highlighted that the concentration of PM2.5 is highest in Delhi and Uttar Pradesh, followed by the North Indian plain, West Bengal, and parts of Chhattisgarh. It is moderate in central India and relatively low in southern India, Uttarakhand, Himachal, and Northeast India. This indicates that the prevalence of ARI is associated with PM2.5 levels. Therefore, the level of PM 2.5 concentration may be a probable reason behind the hot spot.
The spatial regression model suggested that the households using unclean cooking fuel, mothers with asthma/respiratory infection children born with low birth weights, children who had diarrhoea 2 weeks before the survey, and a concentration of particulate matter 2.5 were positively associated with ARI prevalence. Cchildren whose mothers have respiratory diseases or asthma are more likely to get ARI compared to those without these conditions
| [26] | Varghese J. S., & Muhammad T. (2023). Prevalence, potential determinants, and treatment-seeking behaviour of acute respiratory infection among children under age five in India: Findings from the National Family Health Survey, 2019-21. BMC Pulmonary Medicine, 23(1), 195. |
| [34] | Ramani V. K., Pattankar J., & Puttahonnappa S. K. (2016). Acute respiratory infections among under-five age group children at urban slums of Gulbarga City: A longitudinal study. Journal of Clinical and Diagnostic Research, 10(5), LC08-LC13. https://doi.org/10.7860/JCDR/2016/19378.7748 |
[26, 34]
. The possible reason may be that since children typically spend most of their time indoors, they are more vulnerable to contracting infections from family members with respiratory illnesses
| [33] | Savitha A. K., & Gopalakrishnan S. (2018). Determinants of acute respiratory infections among under five children in a rural area of Tamil Nadu, India. Journal of family medicine and primary care, 7(6), 1268-1273. |
[33]
. Our research indicates that, children who have recently experienced diarrhoea are at a higher risk of contracting this infection. This correlation was also observed in recent research conducted in both India and Ethiopia
| [25] | Hasan M. M. Saha, K. K., Yunus R. M., & Alam K. (2022). Prevalence of acute respiratory infections among children in India: Regional inequalities and risk factors. Maternal and Child Health Journal, 26(7), 1594-1602. https://doi.org/10.1007/s10995-022-03289-7 |
| [35] | Merera A. M. (2021). Determinants of acute respiratory infection among under-five children in rural Ethiopia. BMC Infectious Diseases, 21, 1-12. https://doi.org/10.1186/s12879-021-05974-5 |
[25, 35]
. A recent episode of diarrhea may indicate weakened immunity, which could make the child more susceptible to further infections. Our study also found that children born with normal birth weight had a lower risk of ARI compared to those born with low birth weight. Birth weight plays a crucial role in the physical and mental growth and development of infants. Infants with low birth weight are at a higher risk of mortality compared to those with adequate birth weight, especially in the first few months after birth. This increased risk is due to the inadequate formation of anti-immune substances, which makes them more vulnerable to infectious diseases such as pneumonia and other respiratory illnesses. Low birth weight infants often encounter respiratory issues like ARIs because of the underdeveloped lungs and weak respiratory muscles
| [36] | Walter E. C., Ehlenbach W. J., Hotchkin D. L., Chien J. W., & Koepsell T. D. (2009). Low birth weight and respiratory disease in adulthood: a population-based case-control study. American journal of respiratory and critical care medicine, 180(2), 176-180. |
[36]
.
The current study highlighted that PM2.5 increase the risk of ARI prevalence. Several research studies have investigated the correlation between PM2.5 pollution and ARI in India among children
| [37] | Nidhi N., & Jayaraman G. (2007). Air quality and respiratory health in Delhi. Environmental monitoring and assessment, 135, 313-325. |
| [38] | Jayaraman G., & Nidhi N. (2008). Air pollution and associated respiratory morbidity in Delhi. Health Care Management Science, 11, 132-138 |
[37, 38]
. Exposure to fine particulate matter (PM) can lead to oxidative stress and inflammation in the respiratory system, potentially causing damage to the respiratory epithelial cells and reducing their ability to remove pathogens and pollutants from the airways
| [39] | Adhikary M., Mal P., & Saikia N. (2024). Exploring the link between particulate matter pollution and acute respiratory infection risk in children using generalized estimating equations analysis: a robust statistical approach. Environmental Health, 23(1), 12. |
[39]
. This can result in an increased susceptibility to respiratory infections, such as ARI
| [40] | Sigaud S., Goldsmith C. A. W., Zhou H., Yang Z., Fedulov A., Imrich A., & Kobzik L. (2007). Air pollution particles diminish bacterial clearance in the primed lungs of mice. Toxicology and applied pharmacology, 223(1), 1-9. |
[40]
. Another finding is that PM pollution may hinder the immune system's function, especially in children with developing immune systems
| [39] | Adhikary M., Mal P., & Saikia N. (2024). Exploring the link between particulate matter pollution and acute respiratory infection risk in children using generalized estimating equations analysis: a robust statistical approach. Environmental Health, 23(1), 12. |
| [40] | Sigaud S., Goldsmith C. A. W., Zhou H., Yang Z., Fedulov A., Imrich A., & Kobzik L. (2007). Air pollution particles diminish bacterial clearance in the primed lungs of mice. Toxicology and applied pharmacology, 223(1), 1-9. |
[39, 40]
.
While previous studies have explored childhood illnesses and their spatial patterns in India, the present study offers a novel contribution by focusing specifically on the spatial clustering of ARI and its association with key environmental and household-level covariates. For instance, Ranjan and Singh (2024) conducted a regional analysis of childhood illnesses in the North-East states of India, focusing on general health outcomes but without a specific emphasis on ARI or spatial associations with environmental exposures
| [41] | Ranjan M., & Singh A. (2024). Health matters: a statistical approach to understand childhood illnesses in the North-East States of India, 2019–2021. BMC Public Health, 24(1), 1-22. |
[41]
. Similarly, Sehgal, Jatrana, and Johnson (2024) developed a comprehensive health index for India, offering valuable insights into the broader health landscape but lacking disease-specific spatial clustering analyses
| [42] | Sehgal M., Jatrana S., & Johnson, L. (2024). A comprehensive health index for India: development, validation, and spatial variation. Journal of Population Research, 41(3), 21. |
[42]
. Ghosh, Chakraborty, and SenGupta (2023) identified spatial clustering of diarrhoeal diseases across 707 districts in India, which laid important groundwork for understanding regional disparities in child health
| [43] | Ghosh K., Chakraborty, A. S., & SenGupta S. (2023). Identifying spatial clustering of diarrhoea among children under 5 years across 707 districts in India: a cross sectional study. BMC pediatrics, 23(1), 272. |
[43]
. Building upon these foundational works, our study extends the scope by integrating spatial regression techniques and high-resolution environmental data (such as PM2.5 concentration) to uncover the geographical heterogeneity of ARI prevalence. This targeted approach helps bridge a significant gap in the literature by linking respiratory health outcomes in children with socio-environmental risk factors at the district level across India.
Limitations of the Study
The current study has some limitations. Firstly, Childhood ARI was classified as per the signs and symptoms reported by their mother, without confirmation from medical professionals. Secondly, mothers were asked to recall their children's symptoms from the past 2 weeks of the survey, which may raise the possibility of recall bias. Thirdly, a cross-sectional design prevented the establishment of a cause-and-effect relationship. Fourthly, the analysis was strict to the district, which limits the scope of the findings. Finally, while the NFHS-IV does provide district-level information, we focused exclusively on NFHS-V as it is the most recent data set available for India. Future research should aim to conduct a comparative analysis using both NFHS-IV and NFHS-V data to gain deeper insights.