Abstract
The role of Weighted Distribution in statistical modeling is influenced by a particular weighting mechanism. This paper introduces the Weighted Two-Parameter Rayleigh (W2R) distribution, an extension of the Rayleigh distribution, achieved by extending the baseline distribution by using an inverted weight function with an additional parameter. This modification provides greater flexibility, making the W2R distribution more suitable for diverse applications in reliability analysis and survival studies modeling. Theoretical and statistical properties of the new weighted distribution such as survival function, hazard function, reversed hazard function, moments, coefficient of variation, coefficient of skewness, coefficient of kurtosis, harmonic mean, moment generating function, mean-deviation, Rényi entropy, and order statistics were explicitly derived. This was to assess the flexibility and applicability of W2RD, moments, and the associated measures of W2RD distribution. The new weighted Rayleigh distribution parameters were estimated using the Maximum Likelihood Estimation (MLE) performance evaluators. A comparative analysis of W2R distribution with other existing distributions using remission time analysis was applied to two real-life datasets to evaluate its effectiveness. The models performances were assessed using Log-Likelihood and Akaike Information Criterion (AIC) and the results indicated that the W2R distribution provides a superior fit to real-world data compared to competing distributions. The study therefore highlights the potential of the W2R distribution as a more robust and versatile alternative for statistical modeling in various fields.
Keywords
Order Statistics, Rayleigh Distribution, Reliability Analysis, Renyi Entropy, Weighted Rayleigh Distribution
1. Introduction
Proper statistical distributions are required to make a valid statistical inference while wrong specification can lead to invalid inference giving birth to error. Weighted probability distributions have been applied in various real-world fields, particularly to adjust event probabilities by incorporating a weight function into the baseline distribution. This approach provides a useful method for addressing data interpretation challenges and helps in specifying appropriate and effective models.
The concept of weighted distribution was first introduced by
| [1] | Fisher, R. (1934). The Effects of Methods of Ascertainment Upon the Estimation of Frequencies. Ann. Eugenics, 6, pp 13-25. |
[1]
Fisher and later improved upon by
| [2] | Rao, C. (1965). On Discrete Distributions Arising Out of Methods of Ascertainment: In Patil, G. (Eds) Classical and Contagious Discrete Distributions. Statistical Publishing Society, Calcutta, pp 320 -332. |
[2]
as a method of adjustment applicable to many situations. In environmental science, observations may often fall into the non-experimental category, as noted by
| [3] | Patil, G. (2002). Weighted Distributions: In El-Shaarawi A., Piegorsch, W. (Eds) Encyclopedia of Environmetrics. Wiley, Chichester, pp 2369-2377. |
[3]
.
Many authors have employed the concept of weighted distribution to develop effective distributions for skewed data. Lehmann Type II Weighted Weibull distribution was introduced by
| [4] | Badmus, N. I., Bamiduro, T. A. & Ogunobi, S. G. (2014). Lehmann Type II Weighted Weibull Distribution. International Journal of Physical Sciences, 9(4), pp. 71-78. |
[4]
as an extension of the standard Weibull distribution, incorporating a weighting mechanism to enhance its flexibility in modeling real-world data. The study focused on deriving the probability density function, cumulative distribution function, and other statistical properties of the proposed distribution. The authors also examined its survival and hazard functions, demonstrating its applicability in reliability analysis and lifetime data modeling.
Contributions were made by
| [5] | Ilori, A. & Oladimeji, D. (2022). The Weighted Inverse Weibull Distribution. International Journal of Research & Innovation in Applied Sciences, 8(4), pp 14-19. |
[5]
to the field of probability modeling by offering an alternative distribution with enhanced applicability in reliability engineering, medical research, and environmental studies. Their work highlights the importance of weighted distributions in capturing complex real-life data patterns. Furthermore, the study by
| [6] | Ilori A., Omaku, P. E., Kole, E., Dayo, V. K. & Adebisi, M. (2024). Weighted Rayleigh Distribution. International Journal of Research & Innovation In Applied Science, 8(9), pp 323-336. |
[6]
explores the Weighted Rayleigh Distribution (WRD) and its applications in statistical modeling. The Rayleigh distribution is widely used in reliability analysis, engineering, and environmental sciences, but the weighted extension provides greater flexibility in modeling real-world phenomena. The authors introduce a modification to the standard Rayleigh distribution by incorporating a weight function, allowing for enhanced adaptability in describing datasets with varying characteristics.
Weighted distributions play a significant role in statistical modeling, particularly in scenarios where the underlying data is influenced by a specific weighting mechanism. Two weighted distributions introduced by
| [7] | Mahdavi, A. (2015). Two Weighted Distributions Generated by Exponential Distribution. Journal of Mathematical Extension, 9(1), pp 1-12. |
[7]
were derived from the exponential distribution, offering a novel approach to modeling lifetime data and reliability analysis. In his study, he explored the properties of these distributions, including their probability density functions, cumulative distribution functions, moments, and hazard functions. One of the key contributions of Mahdavi's work is the extension of the classical exponential distribution, which is widely used in reliability engineering and survival analysis, to a weighted framework. This modification allows for greater flexibility in capturing real-world phenomena where standard distributions may not provide an adequate fit. By incorporating weight functions, the proposed distributions address variations in data influenced by sampling mechanisms, environmental factors, or other external influences.
The Double Weighted Rayleigh Distribution (DWRD) was introduced and analyzed by
| [8] | Rashwan, N. I. (2013). Double Weighted Rayleigh Distribution Properties and Estimation. International Journal of Scientific & Engineering Research, 4(12), 1084-1089. |
[8]
to expand on the conventional Rayleigh distribution by incorporating additional weighting functions. The study thoroughly examined the statistical properties of the proposed distribution, including its probability density function, cumulative distribution function, moments, and survival function. The author also explored various estimation techniques for the model parameters, comparing methods such as the Maximum Likelihood Estimation (MLE) and the Method of Moments (MoM) to assess their efficiency and applicability.
This study seeks to develop a novel statistical model, termed the Weighted Two-Parameter Rayleigh Distribution, by extending the traditional Rayleigh Distribution through the incorporation of an inverse weight function with an additional parameter. This modification and introduction of an additional parameter in the Weighted 2-Parameter Rayleigh Distribution (W2RD) is essential for enhancing the flexibility and adaptability of the Rayleigh Distribution. This modification allows for more precise modeling of real-world data, making the distribution suitable for applications in reliability analysis and survival studies modeling.
One of the key advantages of the additional parameter is its ability to improve tail behavior, providing better control over the skewness and kurtosis of the distribution. This flexibility is particularly useful when dealing with datasets that exhibit varying degrees of dispersion. Furthermore, the inclusion of this parameter enhances the overall shape of the distribution, allowing it to accommodate a wider range of data patterns. In many practical scenarios, the Rayleigh Distribution may be too restrictive, failing to capture the complexities present in empirical data.
Additionally, the extra parameter contributes to better data fitting by reducing estimation errors and increasing predictive accuracy. Many datasets encountered in real-world applications do not conform precisely to a single-parameter model, making it necessary to introduce a more adaptable distribution. Therefore, W2RD extends the applicability of the Rayleigh model to various domains, including engineering reliability and medical survival analysis
| [9] | Marshall, A. W. & Olkin, I. (1997). A New Method for Adding a Parameter to a Family of Distributions with Applications to Survival Analysis. Biometrika, 84(3), pp 641-652. |
| [13] | Azzalini, A. (1985). A Class of Distributions Which Includes the Normal Ones. Scandinavian Journal of Statistics, 12(2), pp171 - 178. |
| [14] | Oguntunde, P. E. & Adejumo, A. O. (2015). The Generalized Inverted Generalized Exponential Distribution with an Application to a Censored Data. Journal of Statistics Applications & Probability, 230(2), pp 223-230. |
[9, 13, 14]
. This study comprares Weighted 2 Rayleigh (W2R) with Weighted Rayleigh Distribution (WRD), Weighted Inverse Weibull Distribution (WIWD), Inverse Weighted Distribution (IWD) and Rayleigh Distribution using remission time analysis.
1.1. The New Model
The cumulative distribution function (cdfand probability density function of Rayleigh distribution with parameter

are defined respectively by equations (
1) and (
2):
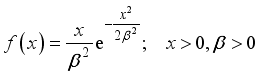 (2)
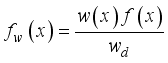
(2) If X is a non-negative random variable with probability density function,

as defined in equation (
2) and the weighted version of X, weigh function w(x) is denoted by random variable
, then the distribution of
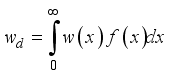
is called the weighted distribution with probability density function given by
Where
A particular case of weighted distribution is obtained when we substitude

as defined in equation (
2) and

in equation (
3). The resulting distribution called weighted 2-parameter Rayleigh distribution with probability density function and cumulative distribution function are derived as in equations (
3) and (
4) respectively:
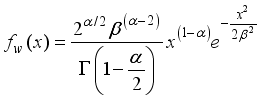
 (3)
(3) and
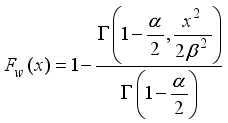

(4),
where are the shape and scale parameters respectively.
When α =1, the resulting distribution is Weighted Rayleigh distribution
| [6] | Ilori A., Omaku, P. E., Kole, E., Dayo, V. K. & Adebisi, M. (2024). Weighted Rayleigh Distribution. International Journal of Research & Innovation In Applied Science, 8(9), pp 323-336. |
[6]
.
1.2. Proof of Validity of W2R Distribution
For the probability density function to be valid, it suffices that;
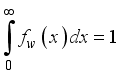
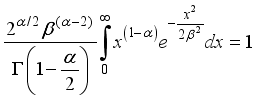 (5)
(5) (6)
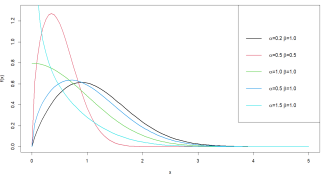
Figure 1. Plot of the Probability Density Function for the W2R Distribution.
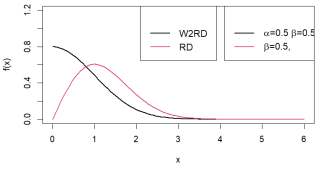
Figure 2. Plots of the Probability Density Function of Rayleigh and W2R distributions.
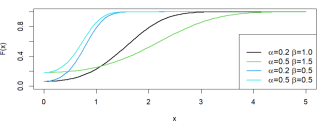
Figure 3. Plot of Cumulative Distribution Function of W2R distribution.
Figure 1 presents the probability density function plot of the Weighted 2-Parameter Rayleigh (W2R) distribution, illustrating its shape and behavior. The plot showcases how the distribution varies with different parameter values, highlighting its flexibility in modeling real-world data. Its unimodal (inverted bathtub) and decreasing shapes depending on the value of the shape parameter.
Figure 2 displays the probability density function plots for the Rayleigh Distribution (RD) and the Weighted 2-Parameter Rayleigh Distribution (W2RD). The plot highlights the impact of the additional parameter in W2RD, which modifies the shape of the distribution, allowing for greater flexibility in modeling diverse data patterns. Specifically, W2RD exhibits a higher peak and a steeper decline compared to RD, suggesting its enhanced adaptability for applications in reliability analysis and survival studies modeling. It further revealed that the distribution is unimodal.
Figure 3 depicts the cumulative density function of the Weighted 2-Parameter Rayleigh distribution for different parameter values, confirming the validity of the distribution, as none of the curves exceed one.
2. Reliability Analysis
2.1. Survival Function
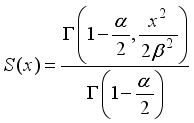
The survivor function quantifies the probability that a given event of interest has not yet occurred by a specific time x. In the context of reliability analysis and survival studies, if X represents the time until failure of a system or an individual, then the survival function S(x) expresses the probability of survival beyond time x. Mathematically, it is derived as the complement of the cumulative distribution function (CDF), ensuring that the probability remains within the range of 0 to 1. The survival (or reliability) function plays a crucial role in various fields, including engineering, biomedical research, and risk assessment, as it helps estimate the longevity and performance of systems under study. The survival (or reliability) function is obtained as:
 (9)
(9) 2.2. Hazard Function
The hazard function, also known as the failure rate or risk function, quantifies the instantaneous likelihood that an event of interest (such as device failure) will occur within a small time interval [t, t + dt], given that the system or subject has survived up to time t. It provides valuable insights into the underlying failure mechanism of a process or system. The hazard function is defined as the ratio of the probability density function

to the survival function S(x), expressed as:
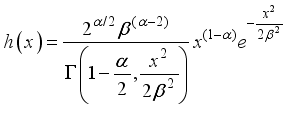 (10)
(10) 2.3. Reversed Hazard Function of W2R Distribution
The Reversed Hazard (RH) function quantifies the likelihood of an event occurring at a given time, conditioned on the fact that the event has already occurred. It is defined as the ratio of the probability density function to the cumulative distribution function. Its provide insights into the failure rate of systems and components.
Mathematically, the Reversed Hazard function for the W2R distribution is given by:
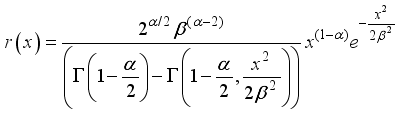 (11)
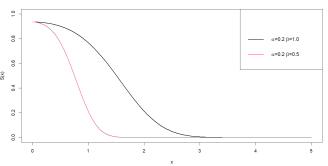
(11) Figure 4. Survival plot of the Weighted 2-Parameter Rayleigh Distribution.
Figure 4 illustrates the survival function of the Weighted 2-Parameter Rayleigh distribution for different parameter values. It demonstrates that as the scale parameter (β) value increases, the survival time also increases.
3. Moments and Associated Measures of W2R Distribution
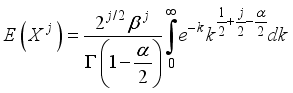
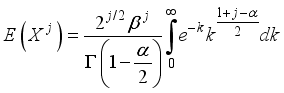
The concept of moments plays a fundamental role in characterizing a probability distribution by providing insights into its key properties, including central tendency, dispersion, asymmetry, and peakedness. Moments serve as the foundation for deriving essential statistical measures such as the mean, variance, skewness, and kurtosis, which help in understanding the shape and behavior of a distribution. In the case of the Weighted 2-Parameter Rayleigh Distribution (W2RD), moments are particularly useful in assessing its flexibility and applicability in various real-world scenarios. Mathematically, the jth moment of a non-negative random variable X is defined as follows:
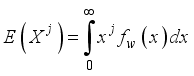 (12)
(12) 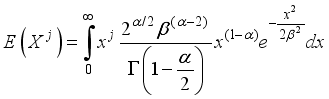 (13)
(13)  (14)
(14)  (15)
(15) 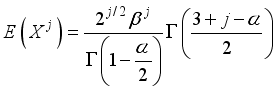 (16)
(16) 3.1. The Mean of W2R Distribution
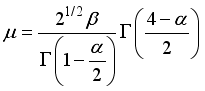 (17)
(17) 3.2. Variance of W2R Distribution
 (18)
(18) 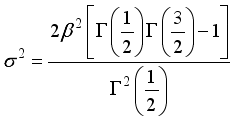 (19)
(19) 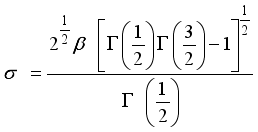 (20)
(20) 3.3. Coefficient of Variation of W2R Distribution
 (21)
(21) 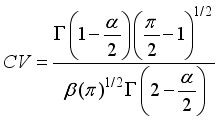 (22)
(22) 3.4. Coefficient of Skewness of W2R Distribution
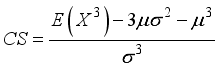 (23)
(23) 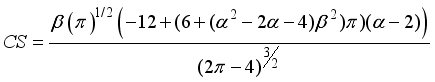 (24)
(24) 3.5. Coefficient of Kurtosis of W2R Distribution
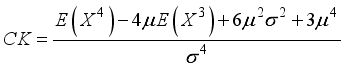 (25)
(25)  (26)
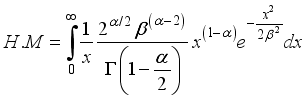
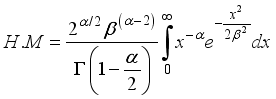
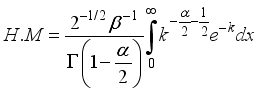
(26) 3.6. Harmonic Mean of W2R Distribution
The Harmonic Mean of the weighted 2-parameter Rayleigh distribution can be obtained as
Where
 (27)
(27)  (28)
(28)  (29)
(29)  (30)
(30) 3.7. Moment Generating Function of W2R Distribution
The moment generating function (MGF) provides a means to compute moments of a distribution efficiently. According to
| [10] | Cordeiro, G. & Castro, M. (2011). A New Family of Generalized Distributions. Journal of Statistical Computation & Simulation, 81(7), pp 883-898. |
[10]
, the moment generating function for a random variable x that follows the Weighted 2-Parameter Rayleigh (W2R) distribution is derived as follows:
 (31)
(31) Let X have a Weighted 2-Parameter Rayleigh distribution, then the Moment Generating Function of X is obtained as:
 (32)
(32) and
 (33)
(33) substituting equation (
33) into (
32), we have
 (34)
(34) Using Taylor’s series, equation (
34) becomes
 (35)
(35)  (36)
(36) where E(X
j) is defined in equation (
16).
Therefore,
 (37)
(37) 3.8. Mean Deviation of W2R Distribution
The deviation from the mean measures the spread and how values differ from the mean. Let x be a random variable following a Weighted 2-Parameter Rayleigh (W2R) distribution with a mean

. The mean deviation is expressed as follows:
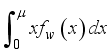
 (38)
(38)  (39)
(39)  (40)
(40) where

in Equation (
40) is obtained as
 (41)
(41) also
in Equation (
40) is obtained as
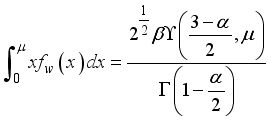 (42)
(42) where
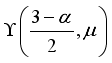
is expression for lower incomplete gamma function.
Substituting equation (
41) and (
42) into (
40), then the Mean Deviation (MD) is given as;
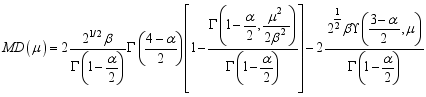 (43)
(43) 3.9. Renyi Entropy
The entropy of X is a randomness measure of the system and defined as
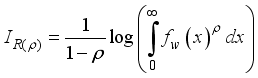 (44)
(44) where
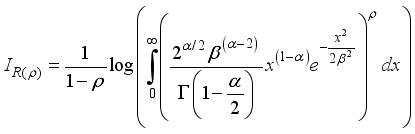 (45)
(45)  (46)
(46) 
 (47)
(47)  (48)
(48) 3.10. Order Statistics
Let …, be the order statistics of a random sample , , , …, drawn from weighted 2-parameter Rayleigh distribution, then the pdf of rth order statistics is given by
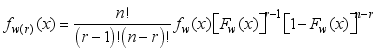 (49)
(49) Substituting equations (
3) and (
4) in the equation (
49), then the probability density function of r
th order statistics
of the weighted 2-parameter Rayleigh distribution is given by
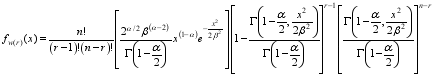 (50)
(50) Hence, the probability density function of higher order statistics can be obtained as
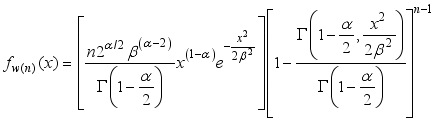 (51)
(51) And the probability density function of the first order statistics can also be obtained as
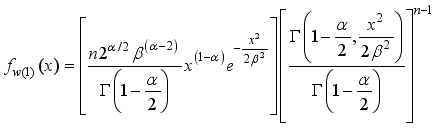 (52)
(52) 4. Parameter Estimation of W2R Distribution
The estimation of the parameters for the weighted 2-Parameter Rayleigh distribution is obtained using Maximum Likelihood Estimation (MLE) as follows:
Let
be a random sample of size “n” from the Weighted 2-Parameter Rayleigh distribution, as defined in equations (
3) and (
4). The likelihood function

is then given by
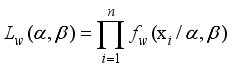 (53)
(53) The likelihood function of Weighted 2-Parameter Rayleigh is expressed as:
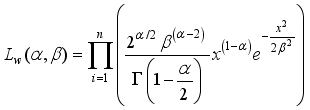 (54)
(54)  (55)
(55) The solution of the non-linear system of equations obtained by differentiating equation (55) with respect to

and
gives the maximum likelihood estimates of the model parameters.
Application to Real Life
Two real-life data sets were analyzed using the Weighted 2-Parameter Rayleigh (W2R), Weighted Rayleigh (WR), Rayleigh (R), Weighted Inverse Weibull (WIW), and Inverse Weibull (IW) distributions to evaluate their effectiveness in modeling real-world scenarios. The performance of the W2R distribution was assessed in comparison to these established distributions using key statistical criteria, including the log-likelihood and Akaike Information Criterion (AIC). These measures provided insights into the goodness-of-fit and model complexity, allowing for a comprehensive evaluation of W2R's suitability for diverse applications, particularly in reliability analysis and survival studies.
The first data set, previously utilized by
| [11] | Ghitany, M. E. & Agostinelli, C. (2015). Weighted Exponential Distribution: Different Methods of Estimations. Applied Mathematics & Information Sciences, 9(3), pp 1167-1173. |
[11]
, represents the waiting time (in minutes) before service for 100 bank customers. This data set provides valuable insights into customer service efficiency and queue management in banking operations.
Table 1. Summary of waiting time (Minutes) before service of bank Customers.
N | Mean | Med. | Var. | Skewness | Kurtosis |
100 | 9.877 | 8.100 | 52.3741 | 1.4727 | 5.5403 |
Table 2. Analysis of competing distributions performance on waiting time before service of bank Customers.
Models | Estimates | LL | AIC |
W2R | 
| -321.0227 | 646.0453 |
WRD | 
| -322.9123 | 647.8247 |
RD | 
| -329.24 | 660.4801 |
WIWD | 
| -327.8677 | 659.7354 |
IWD | 
| -334.3810 | 672.7620 |
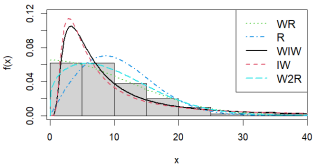
Figure 5. Histogram with competing distributions on waiting time data set.
Table 2 presents the estimated parameter values (along with their standard errors), log-likelihood (LL), and Akaike Information Criterion (AIC) values for the Weighted 2-Parameter Rayleigh (W2R) distribution alongside several existing distributions. The comparative performance analysis, based on LL and AIC, indicates that the W2R distribution provides the best fit to the data, achieving the highest log-likelihood value (-321.0227) and the lowest AIC (646.0453). This suggests that the W2R distribution offers superior flexibility and accuracy in modeling the given dataset.
Among the competing distributions, the Weighted Rayleigh distribution follows closely in performance. The standard Rayleigh (RD), Weighted Inverse Weibull (WIWD), and Inverse Weibull (IWD) distributions exhibit progressively weaker fits, with the IWD distribution performing the worst, as evidenced by its highest AIC value (672.7620). Additionally,
Figure 6 visually reinforces these findings, demonstrating that the Weighted Rayleigh distribution provides a more precise fit to the data compared to the other distributions. This highlights the effectiveness of weighting mechanisms in improving distributional adaptability for real-world applications.
The second data set, previously analyzed by
| [12] | Lee, E. & Wang, J. (2003). Statistical Methods for Survival Data Analysis. John Wiley & Sons, 3rd ed., New York, pp 534. |
[12]
, comprises the remission times (measured in months) for a randomly selected sample of 128 bladder cancer patients. This dataset is particularly valuable in medical and survival analysis studies, as it provides insights into the duration of remission following treatment.
Table 3. Summary of Remission time (Months) of Cancer Patient’s.
N | mean | Med. | Var. | Skewness | Kurtosis |
128 | 9.365 | 6.395 | 110.433 | 3.286 | 18.483 |
Table 4. Analysis of competing distributions performance on Remission time (Months) of Cancer Patients.
Models | Estimates | LL | AIC |
W2R | 
| -426.5927 | 857.1853 |
WRD | 
| -431.1156 | 864.2312 |
RD | 
| -491.2986 | 984.5971 |
WIWD | 
| -428.6478 | 861.2956 |
IWD | 
| -443.9773 | 891.9547 |
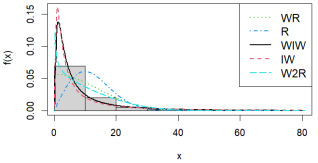
Figure 6. Histogram with competing distributions on Remission time (Months) of Cancer Patients.
Table 5 presents the estimated parameter values (along with their standard errors), log-likelihood (LL), and Akaike Information Criterion (AIC) values for the Weighted 2-Parameter Rayleigh (W2R) distribution and other existing distributions. These statistical measures are crucial for evaluating the goodness-of-fit of each model to the dataset.
The comparative analysis of the competing distributions, based on remission time (in months) of cancer patients, demonstrates that the W2R distribution provides the best fit. It achieves the highest log-likelihood value (-426.5927) and the lowest AIC (857.1853), indicating superior model performance. The Weighted Rayleigh Distribution (WRD) and Weighted Inverse Weibull Distribution (WIWD) follow closely, with slightly higher AIC values of 864.2312 and 861.2956, respectively.
In contrast, the Rayleigh Distribution (RD) exhibits the poorest fit, as evidenced by its lowest log-likelihood (-491.2986) and the highest AIC (984.5971). Similarly, the Inverse Weibull Distribution (IWD) also performs suboptimally, with an AIC of 891.9547. These results highlight the advantage of incorporating additional flexibility in distribution modeling, as seen in the weighted versions.
Furthermore,
Figure 6 visually reinforces these findings, illustrating that the weighted 2-Parameter Rayleigh distribution (W2R) provides a better curve fit to the dataset compared to other models. This confirms the effectiveness of weighted distributions in capturing the underlying patterns in cancer remission time data.
5. Conclusion
In conclusion, the introduction of the Weighted 2-Parameter Rayleigh (W2R) distribution demonstrates its flexibility and superior performance when compared to existing models like the Weighted Rayleigh (WR), Rayleigh (R), Weighted Inverse Weibull (WIW), and Inverse Weibull (IW) distributions. Through the fusion of an inverted weight function with an additional parameter, the W2R distribution offers improved modeling capabilities, as seen in its theoretical and statistical properties, including survival and hazard functions, moments, and entropy. The estimation of its parameters was conducted using Maximum Likelihood Estimation (MLE), and two real-life data sets were analyzed to assess its effectiveness. The results show that the W2R distribution consistently provides a better fit based on log-likelihood and Akaike Information Criterion (AIC) values. The performance comparison of the competing distributions further highlights the W2R distribution's superiority. In both data sets, the W2R distribution achieved the highest log-likelihood and the lowest AIC values, indicating a better fit than the other models. Specifically, in the remission time analysis, the W2R model outperformed the WRD, WIWD, RD, and IWD distributions, with the Rayleigh distribution showing the worst fit. Overall, the Weighted 2-Parameter Rayleigh distribution proves to be a more robust and flexible model for real-life data analysis.
Abbreviations
AIC | Akaike Information Criteria |
RH | Reversed Hazard |
W2RD | Weighted 2 Parameter Rayleigh Distribution |
RD | Rayleigh Distribution |
WIWD | Weighted Inverse Weibull Dsitribution |
WRD | Weighted Rayleigh Distribution |
MLE | Maximum Likelihood Estimation |
IW | Inverse Weibull |
WIW | Weighted Inverse Weibull |
Conflicts of Interest
The authors declare no conflicts of interest.
References
| [1] |
Fisher, R. (1934). The Effects of Methods of Ascertainment Upon the Estimation of Frequencies. Ann. Eugenics, 6, pp 13-25.
|
| [2] |
Rao, C. (1965). On Discrete Distributions Arising Out of Methods of Ascertainment: In Patil, G. (Eds) Classical and Contagious Discrete Distributions. Statistical Publishing Society, Calcutta, pp 320 -332.
|
| [3] |
Patil, G. (2002). Weighted Distributions: In El-Shaarawi A., Piegorsch, W. (Eds) Encyclopedia of Environmetrics. Wiley, Chichester, pp 2369-2377.
|
| [4] |
Badmus, N. I., Bamiduro, T. A. & Ogunobi, S. G. (2014). Lehmann Type II Weighted Weibull Distribution. International Journal of Physical Sciences, 9(4), pp. 71-78.
|
| [5] |
Ilori, A. & Oladimeji, D. (2022). The Weighted Inverse Weibull Distribution. International Journal of Research & Innovation in Applied Sciences, 8(4), pp 14-19.
|
| [6] |
Ilori A., Omaku, P. E., Kole, E., Dayo, V. K. & Adebisi, M. (2024). Weighted Rayleigh Distribution. International Journal of Research & Innovation In Applied Science, 8(9), pp 323-336.
|
| [7] |
Mahdavi, A. (2015). Two Weighted Distributions Generated by Exponential Distribution. Journal of Mathematical Extension, 9(1), pp 1-12.
|
| [8] |
Rashwan, N. I. (2013). Double Weighted Rayleigh Distribution Properties and Estimation. International Journal of Scientific & Engineering Research, 4(12), 1084-1089.
|
| [9] |
Marshall, A. W. & Olkin, I. (1997). A New Method for Adding a Parameter to a Family of Distributions with Applications to Survival Analysis. Biometrika, 84(3), pp 641-652.
|
| [10] |
Cordeiro, G. & Castro, M. (2011). A New Family of Generalized Distributions. Journal of Statistical Computation & Simulation, 81(7), pp 883-898.
|
| [11] |
Ghitany, M. E. & Agostinelli, C. (2015). Weighted Exponential Distribution: Different Methods of Estimations. Applied Mathematics & Information Sciences, 9(3), pp 1167-1173.
|
| [12] |
Lee, E. & Wang, J. (2003). Statistical Methods for Survival Data Analysis. John Wiley & Sons, 3rd ed., New York, pp 534.
|
| [13] |
Azzalini, A. (1985). A Class of Distributions Which Includes the Normal Ones. Scandinavian Journal of Statistics, 12(2), pp171 - 178.
|
| [14] |
Oguntunde, P. E. & Adejumo, A. O. (2015). The Generalized Inverted Generalized Exponential Distribution with an Application to a Censored Data. Journal of Statistics Applications & Probability, 230(2), pp 223-230.
|
Cite This Article
-
APA Style
Ilori, A. K., Adeyeye, A. C., Oladimeji, D., Adebambo, T., Michael, A. (2025). On the Weighted 2-Parameter Rayleigh Distribution. International Journal of Statistical Distributions and Applications, 11(2), 56-65. https://doi.org/10.11648/j.ijsda.20251102.14
 Copy
|
Copy
|
 Download
ACS Style
Ilori, A. K.; Adeyeye, A. C.; Oladimeji, D.; Adebambo, T.; Michael, A. On the Weighted 2-Parameter Rayleigh Distribution. Int. J. Stat. Distrib. Appl. 2025, 11(2), 56-65. doi: 10.11648/j.ijsda.20251102.14
Copy
|
Download
AMA Style
Ilori AK, Adeyeye AC, Oladimeji D, Adebambo T, Michael A. On the Weighted 2-Parameter Rayleigh Distribution. Int J Stat Distrib Appl. 2025;11(2):56-65. doi: 10.11648/j.ijsda.20251102.14
Copy
|
Download
-
@article{10.11648/j.ijsda.20251102.14,
  author = {Adetunji Kolawole Ilori and Awogbemi Clement Adeyeye and Damilare Oladimeji and Toyosi Adebambo and Adebisi Michael},
  title = {On the Weighted 2-Parameter Rayleigh Distribution
},
  journal = {International Journal of Statistical Distributions and Applications},
  volume = {11},
  number = {2},
  pages = {56-65},
  doi = {10.11648/j.ijsda.20251102.14},
  url = {https://doi.org/10.11648/j.ijsda.20251102.14},
  eprint = {https://article.sciencepublishinggroup.com/pdf/10.11648.j.ijsda.20251102.14},
  abstract = {The role of Weighted Distribution in statistical modeling is influenced by a particular weighting mechanism. This paper introduces the Weighted Two-Parameter Rayleigh (W2R) distribution, an extension of the Rayleigh distribution, achieved by extending the baseline distribution by using an inverted weight function with an additional parameter. This modification provides greater flexibility, making the W2R distribution more suitable for diverse applications in reliability analysis and survival studies modeling. Theoretical and statistical properties of the new weighted distribution such as survival function, hazard function, reversed hazard function, moments, coefficient of variation, coefficient of skewness, coefficient of kurtosis, harmonic mean, moment generating function, mean-deviation, Rényi entropy, and order statistics were explicitly derived. This was to assess the flexibility and applicability of W2RD, moments, and the associated measures of W2RD distribution. The new weighted Rayleigh distribution parameters were estimated using the Maximum Likelihood Estimation (MLE) performance evaluators. A comparative analysis of W2R distribution with other existing distributions using remission time analysis was applied to two real-life datasets to evaluate its effectiveness. The models performances were assessed using Log-Likelihood and Akaike Information Criterion (AIC) and the results indicated that the W2R distribution provides a superior fit to real-world data compared to competing distributions. The study therefore highlights the potential of the W2R distribution as a more robust and versatile alternative for statistical modeling in various fields.
},
 year = {2025}
}
Copy
|
Download
-
TY  - JOUR
T1  - On the Weighted 2-Parameter Rayleigh Distribution

AU  - Adetunji Kolawole Ilori
AU  - Awogbemi Clement Adeyeye
AU  - Damilare Oladimeji
AU  - Toyosi Adebambo
AU  - Adebisi Michael
Y1  - 2025/06/06
PY  - 2025
N1  - https://doi.org/10.11648/j.ijsda.20251102.14
DO  - 10.11648/j.ijsda.20251102.14
T2  - International Journal of Statistical Distributions and Applications
JF  - International Journal of Statistical Distributions and Applications
JO  - International Journal of Statistical Distributions and Applications
SP  - 56
EP  - 65
PB  - Science Publishing Group
SN  - 2472-3509
UR  - https://doi.org/10.11648/j.ijsda.20251102.14
AB  - The role of Weighted Distribution in statistical modeling is influenced by a particular weighting mechanism. This paper introduces the Weighted Two-Parameter Rayleigh (W2R) distribution, an extension of the Rayleigh distribution, achieved by extending the baseline distribution by using an inverted weight function with an additional parameter. This modification provides greater flexibility, making the W2R distribution more suitable for diverse applications in reliability analysis and survival studies modeling. Theoretical and statistical properties of the new weighted distribution such as survival function, hazard function, reversed hazard function, moments, coefficient of variation, coefficient of skewness, coefficient of kurtosis, harmonic mean, moment generating function, mean-deviation, Rényi entropy, and order statistics were explicitly derived. This was to assess the flexibility and applicability of W2RD, moments, and the associated measures of W2RD distribution. The new weighted Rayleigh distribution parameters were estimated using the Maximum Likelihood Estimation (MLE) performance evaluators. A comparative analysis of W2R distribution with other existing distributions using remission time analysis was applied to two real-life datasets to evaluate its effectiveness. The models performances were assessed using Log-Likelihood and Akaike Information Criterion (AIC) and the results indicated that the W2R distribution provides a superior fit to real-world data compared to competing distributions. The study therefore highlights the potential of the W2R distribution as a more robust and versatile alternative for statistical modeling in various fields.

VL  - 11
IS  - 2
ER  -
Copy
|
Download
 such that
  and
and 
 such that
  and
and 
 such that
  and
and