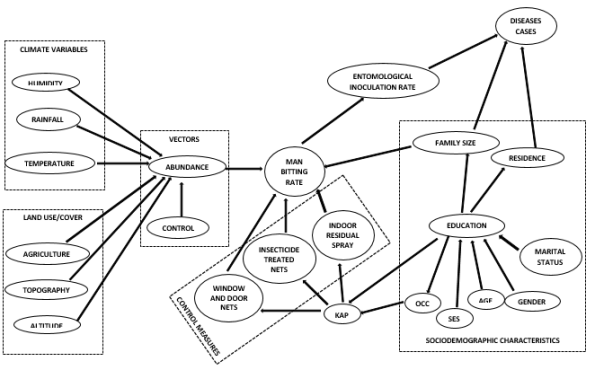
Bayesian Belief Network (BBN) is an emerging modeling technique that provides a decision support framework for problem relating to uncertainty, complexity and probabilistic cognitive. The specification of Bayesian network is made up of graph structure of networks (qualitative part) and the specification of the conditional probability distributions (quantitative part). The technique conceptualizes a system of interest as a network of connected nodes and linkages. In spite of the versatile and general acceptability of estimation of disease cases from various available methods in literature, incorporating model uncertainty remains an open issue. In this article, we derived a probability based graphical model using expert opinions in related studies on malaria and its hypothesized predictors with a BBN. This approach is well applied in ecological studies and other environmental sciences in recent times for various estimations and predictions based on Bayesian reasoning. The study therefore examines the application of BBN with a view to estimate the model parameters by deriving a probability based networks applicable to malaria epidemics. While Markov Chain principles were explored as they relates to a BBN formulation and useful guidelines for developing the preliminary structure of the network, the topology of a BBN was derived as a directed acyclic graph with malaria predictors as network nodes.
| Published in | International Journal of Statistical Distributions and Applications (Volume 11, Issue 2) |
| DOI | 10.11648/j.ijsda.20251102.15 |
| Page(s) | 66-73 |
| Creative Commons |
This is an Open Access article, distributed under the terms of the Creative Commons Attribution 4.0 International License (http://creativecommons.org/licenses/by/4.0/), which permits unrestricted use, distribution and reproduction in any medium or format, provided the original work is properly cited. |
| Copyright |
Copyright © The Author(s), 2025. Published by Science Publishing Group |
Bayesian Networks, Directed Acyclic Graph, Malaria, Probability Distributions, Uncertainty
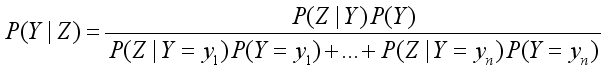
 ) of event Z given event Y has occurred, the marginal probability (prior) of Y is written as
  and the normalizing term
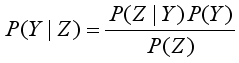
  as the denominator. Bayes theorem serves as a pivot where the Bayesian statistics hangs. The inferences in belief networks operate with the application of the principles embedded in the Bayes rule of probability popularly known as Bayes theorem. Equation 3 becomes (4) using the concept of total probability. Hence, . For all values of y, the denominator remains constant.
 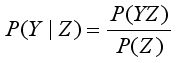 (1)
(1)  (2)
(2)  (3)
(3)  (4)
(4)  , then the joint probability distribution of the structure of the network is thus given as the product of the conditional probabilities at various nodes given individual parent (5).
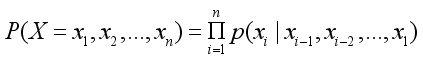
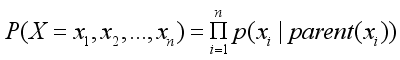 (5)
(5)  ) is the parent to node
  and equation 5 specify the probability model of
  given the graphical structure of the network.
 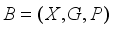 for some given set of random variables
  for all
 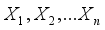 .
. 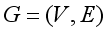 is an acyclic directed graph with nodes
 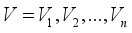 and links
 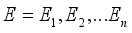 . Each node in
  represents the random variable
  with a finite set of mutually exclusive states and the directed link
  is the (conditional) dependence and independence of the nodes given the parent(s) for all
  of the probability
  in the network
  between the random variables according to the d-separation criterion.
 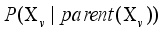 is the conditional probability of the child given the parent for each node in the probability network.
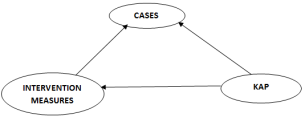
 KAP-node | |
|---|---|
G | P |
0.65 | 0.35 |
KAP-node | ||
|---|---|---|
Intervention measure | G | P |
Yes | 0.7 | 0.25 |
No | 0.3 | 0.75 |
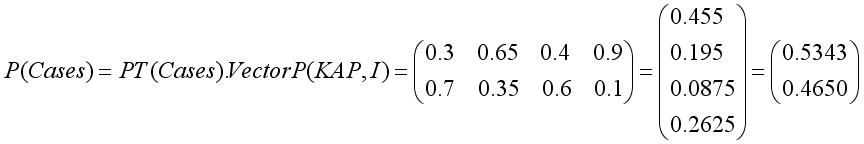
KAP-node | |||||
|---|---|---|---|---|---|
G | P | ||||
Intervention Measure-node | Yes | No | Yes | No | |
Cases-node | |||||
Yes | 0.3 | 0.65 | 0.4 | 0.9 | |
No | 0.7 | 0.35 | 0.60 | 0.1 | |


Node | Probability |
|---|---|
KAP | |
G | 0.65 |
P | 0.35 |
Intervention measure | |
Yes | 0.54 |
No | 0.46 |
Cases | |
Yes | 0.53 |
No | 0.47 |
BBN | Bayesian Belief Network |
CPTs | Conditional Probability Tables |
EIR | Entomological Inoculation Rate |
ANN | Artificial Neural Network |
MBR | Man Bitting Rate |
| [1] | Stamelos, I. Angelis, L. Dimou, P. and Sakellaris, E.(2003). On the use of Bayesian belief networks for the prediction of software productivity. Information and Software Technology, vol. 45, pp 51-60. |
| [2] | Landuyt, D. Broekx, S. & D’hondt R. (2013). A review of Bayesian belief networks in ecosystem service modelling. Environmental Modelling and Software, vol. 46, pp 1-11. |
| [3] | Oguntade, E. S., Shohaimi, S., Nallapan, M., Lamidi-sarumoh, A. A., & Salari, N. (2020). Statistical Modelling of the Effects of Weather Factors on Malaria Occurrence in Abuja, Nigeria. Int. J. Environ. Res. Public Health, 17(3474;), pp 1-12. |
| [4] | Rogers, D. J. (2006). Models for Vector Borne Diseases. Advanced Parasitol, 62, pp 1-35. |
| [5] | Hens, N., Shkedy Z., Faes, C., Van Damme P., & Bentels, P. (2012). Modeling Infectious Disease Based on Serological and Social Contact Data. A Modern Statistical Perspective. Springer; New York. |
| [6] | Hagenlocher, M. & Castro, M. C. (2015). Mapping malaria risk and vulnerability in the United Republic of Tanzania: a spatial explicit model. Population Health Metrics, 13(2), pp 1-14. |
| [7] | Bartlet M. S (1957). Measles periodicity and community size. Journal of Royal Stat Soc; 120 pp 48-70. |
| [8] | Oguntade, E. S., Abah, R. S, & Oladimeji, M. D. (2025). Exploring the Epidemiological Patterns and the Dynamics of Diphtheria Outbreakin Nigeria: A Compartment Model Approach. Bima Jounal of Science and Technology, 9(1A), pp. 166-174. |
| [9] | Kermack W. O. McKendric, A. G. (1927). A Contribution to the Mathematical Theory of Epidemics. Proc. Royal Soc., Lond. A115, pp 700-721. |
| [10] | Darazirar, R. (2024) Global Behaviour and travelling waves of a Monkeypox epidemic Model with Vaccination Impact. Open Journal of Mathematical Science; 8(2024), pp 185-207. |
| [11] | Yadav, S. K. and Akhter, Y. (2021). Statistical Modeling for the prediction of infectious disease dissemination with special reference to COVID-19 spread Frontiers in Public Health |
| [12] | Landuyt, D., Broekx, S. & Goethals P. L. M.(2016). Bayesian belief networks to analyse trade-offs among ecosystem services at the regional scale, Ecological Indicators, vol. 71, pp. 327-335. |
| [13] | Victora, C. G., Huttly, S. R., Fuchs, S. C. & Olinto, M. T. (1997). The role of conceptual frameworks in epidemiological analysis: A hierarchical approach. International Journal of Epidemiology, vol. 26, no. 1, pp. 224-227. |
| [14] | Khodakarami, V. and Abdi, A. (2014). Project cost risk analysis: A Bayesian networks approach for modeling dependencies between cost items. International Journal of Project Management, vol. 32 no. 7, pp. 1233-1245. |
| [15] | Korb, K. B. and Nicholson, A. E. (2004). Bayesian artificial intelligence, USA: Chapman & Hall/CRC. |
| [16] | Nagarajan, R., Scutari, M. & L`ebre, S. (2015). Bayesian networks in R with application in systems biology. New York: Springer, 2013. |
| [17] | Scutari, M. & Denis, J. B. "Bayesian networks with examples in R. New York: A Chapman & Hall Book/CRC. |
| [18] | Dlamini, W. M. (2010). A Bayesian belief network analysis of factors influencing wildfire occurrence in Swaziland. Environmental Modelling and Software, vol. 25 no. 2, pp. 199-208. |
| [19] | Ho, S. H., Speldewinde, P. & Cook, A.(2017). Predicting arboviral disease emergence using Bayesian networks : a case study of dengue virus in estern Australia," Epidemiology and Infection, vol. 145(May), pp. 54-66, 2017. |
| [20] | Papakosta, P. Xanthopoulos, G. A. & Straub, D. (2017). Probabilistic prediction of wildfire economic losses to housing in Cyprus using Bayesian network analysis. International Journal of Wildland Fire, vol. 26, pp. 10-23. |
| [21] | Nguefack-Tsague, G. (2011). Using bayesian networks to model hierarchical relationships in epidemiological studies. Epidemiology and Health, vol. 33, pp. 1-8. |
| [22] | Pearl, J. (2000). Causality: models, reasoning, and inference. Cambridge university press, (2nd ed). UK: |
| [23] | Salini, S. & Kenett, R. S. (2007). Bayesian network of customer satisfaction survey data. Pubblicazione Depositata Ai Sensi Della L. Italy: University of Milan, 2007. Retrieved from |
| [24] | Kaczmarek, L. (2016). Review of the Use of Bayesian Networks in Finance. Business and Enterpreneurship, Science and Technology, pp. 1-14, 2016. |
| [25] | Kita, E., Zuo, Y. Harada, M. & Mizuno, T. (2012). Application of Bayesian network to stock price prediction. Sciedu Press, vol. 1, no. 2, pp. 171-184. |
| [26] | Zuo, Y.& Kita, E.(2012). Up/Down analysis of stock index by using Bayesian network. Engineering Management Research, vol. 1, no. 2, pp 46-52. |
| [27] | Papakosta, P. & Straub, D. (2016). Probabilistic prediction of daily fire occurrence in the Mediterranean with readily available spatio-temporal data. iForest, vol. 10, pp. 32-40, |
| [28] | Bøttcher, S. G. & Dethlefsen, C. (2003). Learning Bayesian networks with R: In Proceedings of the 3rd International Workshop on Distributed Statistical Computing (DSC 2003) March 20-22, 2003, Vienna, Austria. Australia: Kurt Hornik, Friedrich Leisch & Achim Zeileis (eds.). Retrieved from |
| [29] | Onyango, E. A., Sahin, O. Awiti, A., Chu, C. & Mackey, B. (2016). An integrated risk and vulnerability assessment framework for climate change and malaria transmission in East Africa. Malaria Journal, vol. 15, no. 551, pp. 1-12. |
| [30] | Zhang, H. Zhu, L.& Xu, S. (2016). Modeling the city distribution system reliability with Bayesian networks to identify influence factors. Scientific Programming, vol. 2016(ID 7109235), pp. 1-9. |
| [31] | Ducher, M., Kalbacher, E. & Combarnous, F. (2013). Comparison of a Bayesian network with a logistic regression model to forecast IgA nephropathy. BioMed Research International, 2013(ID 686150), pp. 1-6. |
| [32] | Marcot, B. G., Steventon, J. D., Sutherland, G. D. & McCann, R. K. (2006). "Guidelines for developing and updating Bayesia belief networks applied to ecology modelling and conservation. Canadian Journal of Forestry Research, vol. 36, pp. 3063-3074. |
| [33] | Baume, C. A. & Franca-koh, A. C.(2011). Predictors of mosquito net use in Ghana. Malaria Journal, vol. 10, no. 265, pp. 1- 6. |
| [34] | Ebenezer, A., Noutcha, A. E. M. & Okiwelu, S. N. (2016). Relationship of annual entomological inoculation rates to malaria transmission indices, Bayelsa State, Nigeria. Journal of Vector Borne Disease, vol. 53, pp. 46-53. |
| [35] | Babajide, S., Perry, B. & Hufferet, F. W. (2015). Effect of meteorological variables on malaria incidence in Ogun State, Nigeria. International Journal of Public Health and Epidemiology, vol. 4, 10, pp. 205-215. |
| [36] | Omonijo, A. G., Matzarakis, A. Oguntoke, O. & Adeofun, C. O.(2011). Influence of weather and climate on malaria occurrence based on human-biometeorological methods in Ondo State, Nigeria. Journal of Environmental Science and Engineering, vol. 5, pp. 1215-1228. |
| [37] | Githeko, A. K., Ogallo, L., Lemnge, M., Okia, M. & Ototo, E. N.(2014). Development and validation of climate and ecosystem-based early malaria epidemic prediction models in East Africa. Malarial Journal, vol. 13, no. 1, pp. 329. |
| [38] | Woyessa, K., Deressa, W., Ali, A. & Lindtjørn, B.(2013). Malaria risk factors in Butajira area, south-central Ethiopia: a multilevel analysis," Malaria Journal, vol. 12, pp. 273. |
| [39] | Dhimal, M., Aryal, K. K. & Dhimal M. L. (2014). Knowledge, attitude and practice regarding dengue fever among the healthy population of highland and Lowland communities in central Nepal. PLoS ONE, vol. 9, no. 7, pp. 1-15. |
| [40] | K. Yadav, S. Dhiman, B., Rabha, P., Saikia, & V. Veer, V. (2014). Socio-economic determinants for malaria transmission risk in an endemic primary health centre in Assam, India, Infectious Diseases of Poverty, vol. 3, no. 1, pp. 19. |
| [41] | Adedokun, O. & Adeyemi, G. E. (2013). Mother’s socio-economic status and malaria prevention : implications for infant mortality in Nigeria. Humanities and Social Sciences Review, vol. 2, no. 4, pp. 65-82. |
| [42] | Fayehun, O. A.& Salami, K. K.(2014). Older persons and malaria treatment in Nigeria. Etude de La Population Africaine, vol. 27, no 2 (SUPPL.), pp. 424-433. |
| [43] | K. refis, A. C., Schwarz, N. G & Nkrumah B. (2010). Principal component analysis of socioeconomic factors and their association with malaria in children from the Ashanti region, Ghana. Malaria Journal, vol. 9, pp. 201. |
| [44] | Yusuf, O. B., Adeoye, B. W., Oladepo, O. O., Peters, D. H. & Bishai, D. (2010). Poverty and fever vulnerability in Nigeria: a multilevel analysis. Malaria Journal, vol. 9, no. 1, pp. 235. |
APA Style
Oguntade, E. S., Adeyeye, A. C., Kolawole, I. A. (2025). On the Use of Bayesian Probability Networks with Hypothesized Malaria Influence Diagrams. International Journal of Statistical Distributions and Applications, 11(2), 66-73. https://doi.org/10.11648/j.ijsda.20251102.15
ACS Style
Oguntade, E. S.; Adeyeye, A. C.; Kolawole, I. A. On the Use of Bayesian Probability Networks with Hypothesized Malaria Influence Diagrams. Int. J. Stat. Distrib. Appl. 2025, 11(2), 66-73. doi: 10.11648/j.ijsda.20251102.15
@article{10.11648/j.ijsda.20251102.15,
  author = {Emmanuel Segun Oguntade and Awogbemi Clement Adeyeye and Ilori Adetunji Kolawole},
  title = {On the Use of Bayesian Probability Networks with Hypothesized Malaria Influence Diagrams},
  journal = {International Journal of Statistical Distributions and Applications},
  volume = {11},
  number = {2},
  pages = {66-73},
  doi = {10.11648/j.ijsda.20251102.15},
  url = {https://doi.org/10.11648/j.ijsda.20251102.15},
  eprint = {https://article.sciencepublishinggroup.com/pdf/10.11648.j.ijsda.20251102.15},
  abstract = {Bayesian Belief Network (BBN) is an emerging modeling technique that provides a decision support framework for problem relating to uncertainty, complexity and probabilistic cognitive. The specification of Bayesian network is made up of graph structure of networks (qualitative part) and the specification of the conditional probability distributions (quantitative part). The technique conceptualizes a system of interest as a network of connected nodes and linkages. In spite of the versatile and general acceptability of estimation of disease cases from various available methods in literature, incorporating model uncertainty remains an open issue. In this article, we derived a probability based graphical model using expert opinions in related studies on malaria and its hypothesized predictors with a BBN. This approach is well applied in ecological studies and other environmental sciences in recent times for various estimations and predictions based on Bayesian reasoning. The study therefore examines the application of BBN with a view to estimate the model parameters by deriving a probability based networks applicable to malaria epidemics. While Markov Chain principles were explored as they relates to a BBN formulation and useful guidelines for developing the preliminary structure of the network, the topology of a BBN was derived as a directed acyclic graph with malaria predictors as network nodes.
},
 year = {2025}
}
TY  - JOUR
T1  - On the Use of Bayesian Probability Networks with Hypothesized Malaria Influence Diagrams
AU  - Emmanuel Segun Oguntade
AU  - Awogbemi Clement Adeyeye
AU  - Ilori Adetunji Kolawole
Y1  - 2025/06/06
PY  - 2025
N1  - https://doi.org/10.11648/j.ijsda.20251102.15
DO  - 10.11648/j.ijsda.20251102.15
T2  - International Journal of Statistical Distributions and Applications
JF  - International Journal of Statistical Distributions and Applications
JO  - International Journal of Statistical Distributions and Applications
SP  - 66
EP  - 73
PB  - Science Publishing Group
SN  - 2472-3509
UR  - https://doi.org/10.11648/j.ijsda.20251102.15
AB  - Bayesian Belief Network (BBN) is an emerging modeling technique that provides a decision support framework for problem relating to uncertainty, complexity and probabilistic cognitive. The specification of Bayesian network is made up of graph structure of networks (qualitative part) and the specification of the conditional probability distributions (quantitative part). The technique conceptualizes a system of interest as a network of connected nodes and linkages. In spite of the versatile and general acceptability of estimation of disease cases from various available methods in literature, incorporating model uncertainty remains an open issue. In this article, we derived a probability based graphical model using expert opinions in related studies on malaria and its hypothesized predictors with a BBN. This approach is well applied in ecological studies and other environmental sciences in recent times for various estimations and predictions based on Bayesian reasoning. The study therefore examines the application of BBN with a view to estimate the model parameters by deriving a probability based networks applicable to malaria epidemics. While Markov Chain principles were explored as they relates to a BBN formulation and useful guidelines for developing the preliminary structure of the network, the topology of a BBN was derived as a directed acyclic graph with malaria predictors as network nodes.

VL  - 11
IS  - 2
ER  -
Statistics Department, University of Abuja, Abuja, Nigeria
Statistics Programme, National Mathematical Centre, Abuja, Nigeria
Information