Research Article | | Peer-Reviewed

Intellimice Classifier: Towards Smart Object Detection and Classification of Laboratory Mice Using Multi-Sensor Integration

Received: 10 January 2025     Accepted: 24 January 2025     Published: 27 February 2025
Views:       Downloads:
Abstract

Laboratory mice (Mus musculus) play a crucial role in scientific research, where accurate classification and sorting are essential for ensuring reliable experimental results. This study presents an intelligent multi-sensor system for the automated classification and sorting of laboratory mice based on three key parameters: health status, gender, and weight. The system integrates thermal imaging cameras AMG8833 for monitoring the health status of mice, object detection algorithms (YOLOv8) for gender classification, and load cell HX711 sensors for weight measurement. The integration of these sensors leverages advanced sensor fusion techniques to improve classification accuracy and efficiency. Thermal imaging detects physiological anomalies to assess the health condition of the mice, while object detection algorithms identify gender characteristics in real-time with high precision. Additionally, load cell sensors provide accurate weight data for further categorization. The combined system eliminates the need for manual intervention, ensuring a non-invasive, efficient, and scalable approach to laboratory animal management. The proposed system performed evaluation through multiple test scenarios aimed at assessing the health of mice and classifying their weight. The detection of mice gender was evaluated using a dataset comprising over 6,722 images stored in the STASRG laboratory. The test results indicated that the accuracy of animal sorting across three parameters achieved a 100% success rate. The accuracy of gender sorting was 86.67%, while the accuracy of weight measurement exhibited a difference of approximately 0.1 gram. The overall response time for sorting was 19 seconds. This multi-sensor integration demonstrates the potential to enhance laboratory workflows, minimize human error, and promote the welfare of laboratory animals via automated, data-driven processes.

Published in Journal of Electrical and Electronic Engineering (Volume 13, Issue 1)
DOI 10.11648/j.jeee.20251301.16
Page(s) 59-81
Creative Commons

This is an Open Access article, distributed under the terms of the Creative Commons Attribution 4.0 International License (http://creativecommons.org/licenses/by/4.0/), which permits unrestricted use, distribution and reproduction in any medium or format, provided the original work is properly cited.

Copyright

Copyright © The Author(s), 2025. Published by Science Publishing Group

Keywords

Mice, Object Detection, Multi-Sensor, Integration, Fusion Sensor, Deep Learning, Mus Musculus, YOLOv8

1. Introduction
Laboratory mice (Mus musculus) are one of the most commonly used animal models in scientific study, particularly in biomedicine, pharmacy, genetics, and behavioral studies . Mice are selected because of their various benefits, including their short life cycle, genetic resemblance to humans, and quantifiable reactions to certain treatments . Mice are easy to maintain, exhibit a high reproductive rate, and can be genetically modified to meet specific research requirements . Therefore, mice play an important role in producing relevant data and supporting the advancement of science.
However, the effectiveness of utilizing mice in research is significantly contingent upon the initial process, specifically the classification and sorting of animals according to defined parameters. Scientists consider several variables when utilizing mice as experimental animal models. Health status, gender, and body weight are the primary criteria . Sick or stressed mice can substantially influence research outcomes. Gender classification, often linked to hormonal conditions and body weight categorization, is essential for ensuring consistency in specific trials, particularly in research involving physiological variables .
Unfortunately, the classification and sorting of mice currently depend on manual processes and the expertise of animal caretakers, resulting in several limitations. This process is time-consuming and susceptible to human error. The presence of animal caretakers is essential and must be consistently available when laboratory animals are required for research purposes. The manual sorting process is consistently susceptible to disease, bites, or scratches . Furthermore, direct human intervention may induce stress in animals, potentially compromising their health and the integrity of research findings. This issue is particularly significant in large laboratories, where it is necessary to sort hundreds to thousands of mice within a limited timeframe.
To address such gaps, technological advances such as sensor fusion and object detection provide opportunities to address these challenges. Sensor fusion technology integrates data from various sensors, resulting in enhanced accuracy and reliability of information compared to the use of a single sensor. Numerous studies employ sensor fusion or multiple sensors in diverse systems for object detection. The field of precision agriculture employs various sensors to monitor multiple agricultural parameters . Various sensors are employed in the military domain to assess the ergonomic parameters of combat vehicles . Multiple fusion sensors are employed to assess parameters of animal behavior . Object detection, facilitated by deep learning algorithms like YOLOv8, can detect and classify objects in real-time with high precision . The integration of these technologies enables the automation of mice classification, thereby enhancing efficiency and minimizing errors. Applications of YOLOv8 in object detection include animal behavior analysis, agricultural parameter assessment, and medical diagnostics.
This study presents the development of a multi-sensor system that combines three distinct technologies: a thermal camera, object detection utilizing YOLOv8, and a load cell sensor. The thermal camera serves to assess the health condition of mice by analyzing body temperature and identifying physiological anomalies. The object detection algorithm operates to determine the gender of mice in real-time using visual images. In the meantime, the load cell sensor is employed to accurately measure the weight of mice with great precision. The combination of these three elements is implemented via a sensor fusion method to create a more intelligent and effective system for sorting and classifying mice.
The multi-sensor system created in this study is designed to support animal caretakers in fulfilling their responsibilities, addressing the demands for time-intensive and error-prone manual sorting, while ensuring the efficient and precise classification of mice according to health status, gender, and weight. Thus, this system can reduce the time required for the classification process of mice in large numbers and provide convenience in processing mice data with an integrated automation system. This system presents a significant technological advancement by integrating sensor fusion technology, thermal imaging, object detection, and load cell measurement into an integrated system. This system exemplifies the application of advanced technology in laboratory automation, demonstrating adaptability for other animal models or similar applications. Consequently, this system has the potential to assist laboratories in adopting more contemporary technology-driven processes. This system plays a significant role in enhancing animal welfare by minimizing stress in mice, a factor that can influence research outcomes. Additionally, it promotes the adoption of improved ethical standards in the management of laboratory animals.
The proposed system, as described, provides a solution for automating the mice classification process while also contributing to broader implications, including enhancing the welfare of laboratory animals and decreasing the manual workload in laboratory settings. This system is anticipated to establish a new benchmark in laboratory animal management, particularly regarding precise, efficient, and non-invasive data-driven automatic sorting. This approach presents opportunities for further development in laboratory automation, encompassing applications in various animal models and additional classification parameters. This research enhances operational efficiency and simultaneously elevates the overall quality of scientific research outcomes.
This paper will be organized into several chapters for extensive review. The second chapter provides a detailed overview of the research methodology, outlining the structural framework of this paper. This chapter includes a comprehensive examination of existing literature, a detailed outline of system design and planning, as well as a thorough analysis of system testing scenarios. The third chapter will provide a detailed analysis of the test results derived from multiple scenarios. Chapter four will provide a detailed analysis of the research results. Chapter five will provide a detailed analysis of the conclusions drawn and outline the recommended future work for system development.
2. Material and Methodology
This system refers to a methodology for research and development that is based on prototypes . This methodology facilitates the design, development, and integration of multi-sensor systems. A literature review was conducted in the initial stages, drawing on prior research reviews or related studies. This review concentrates on conducting a needs analysis to identify critical parameters, including health, gender, and weight, that require measurement. Select the suitable technology and hardware, such as a thermal camera, YOLOv8, or load cell.
Subsequently, the system design is implemented. The block diagram design is currently being developed, outlining the system workflow, which encompasses data collection, processing, and classification decisions. This system architecture is designed to detect three parameters. The subsequent phase is the development of the prototype. The system is currently implemented with the Python programming language and deep learning libraries.
Utilizing a mice dataset to train the YOLOv8 model for gender detection. At this stage, data from the thermal camera, YOLOv8 algorithm, and load cell are integrated using a sensor fusion approach. The system will subsequently proceed to the trial and improvement iteration phase to evaluate the prototype's performance in sorting laboratory mice across diverse scenarios. The final stage of this methodology involves drawing conclusions based on the analysis and discussion of the test results conducted in the preceding stage.
2.1. Literature Review
Laboratory animals are typically classified as vertebrate species, including traditional laboratory animals, agricultural animals, wildlife, and aquatic species, that are bred or utilized for research, testing, or educational purposes . Laboratory animals frequently utilized include rabbits, horses, hamsters, and mice . Mice are small rodents belonging to the species Mus musculus . Laboratory mice have been domesticated by humans for numerous generations. Additional distinguishing biological characteristics encompass highly developed hearing, a well-developed sense of smell, limited vision, small body size, and short generation intervals. Mice are the predominant laboratory animals utilized in research .
Identifying the selection parameter factors is essential when conducting animal trials on mice in the laboratory . Three primary factors must be considered: health factors, mice gender, and mice weight . The health status of mice is the primary criterion for their selection. The necessity of using healthy mice for testing ensures that the validation of research results aligns with the anticipated outcomes. The second factor is the gender variable. Neurobiological differences contribute to behavioral variations between male and female mice. These differences are often linked to variations in neurological foundations and are associated with differences in brain morphology, neurochemistry, neuroendocrinology, and neurobiology . Gender-based differences in behavior among males and females can influence responses to stress or treatment, subsequently impacting hormone levels in mice, which may ultimately affect the outcomes of laboratory trials .
The subsequent factor is the weight of the mice. The weight of the mice significantly influences the outcomes of laboratory trials . In pharmaceutical research, drug dosages are typically determined according to the weight of the mice, expressed in milligrams per kilogram (mg/kg) . Weight discrepancies may result in improper dosing, thereby influencing the study's outcomes. The weight of the mice influences metabolism, drug distribution, and response to specific treatments. Mice exhibiting varying weights may demonstrate differing responses to treatment or intervention .
2.1.1. Defining Mice Healthy Parameter
A mice is considered to be in excellent condition when its body temperature ranges from 36.5°C to 38.0°C . The body temperature of mice exhibits minor variations influenced by environmental conditions, activity levels, and stress factors . A mice experiences hypothermia when its body temperature falls below 36.0°C, which may signify adverse health conditions, including dehydration, severe infection, or shock . Elevated body temperature exceeding 38.5°C typically signifies the presence of infection or inflammation, potentially resulting from bacterial or viral agents, or an immune response. Mice may exhibit sunken eyes as a result of dehydration or infection . A sick mice may exhibit a runny and bloody nose, indicating a potential respiratory infection or trauma . Mice exhibit reduced mobility or lack of responsiveness to stimuli as indicators of behavioral changes. Sick mice may, in certain instances, display aggressive or restless behavior as a result of pain. In addition, the fur of sick mice exhibits changes, appearing more tangled and oily .
Numerous studies utilize temperature sensors to detect temperature variations in animals. The TH01M sensor serves as an internal animal temperature monitoring device, functioning as a contact-based temperature measuring instrument or electronic thermometer, along with sensor telemetry capabilities . Various studies employ sensors that utilize thermocouples or thermistances for temperature detection . However, it is important to note that temperature-based examinations often require invasive procedures, potentially leading to stress or trauma for the animal.
To facilitate the decrease in contact with the mice object, the chosen system should implement contactless measurement techniques. A thermal infrared camera serves as a key component in a contactless system. The comparison table presented in Table 1 outlines various thermal camera sensors.
Table 1. The comparison of infrared-camera thermal.

Sensor

Technology

Accuracy

Range

Resolution

Main Application

AMG8833

Infrared grid

±2.5°C

1-5 m

8 x 8

Small Animal

MLX90614

infrared

±0.5°C

0.5-2 m

Single point

Body temperture

MLX90640

infrared

±1.5°C

0.5-4 m

32 x 24

Thermal analysis

FLIR Lepton

Thermal imaging

±1°C

0.5-10 m

80 x 60

Temperature visualization

D6T (omron)

thermopile

±0.5°C

0.5-3 m

Multi-point

Human/animal presence

TMP006

thermopile

±0.5°C

01-0.5 m

Single-point

Skin Surface

The data presented in the table indicates that the AMG8833, MLX906014, and MLX90640 sensors are well-suited for this study. They are capable of detecting infrared radiation without the need for direct contact, making them appropriate for use with laboratory animals like mice, while also providing high accuracy and a rapid response time . The selection of the AMG8833 sensor is justified by its infrared grid technology and its operational principle of thermal infrared imaging, which involves measuring the infrared radiation emitted by an object to ascertain its surface temperature . The AMG8833 thermal camera is employed due to its effectiveness in identifying health parameters in mice, which are characterized by their small size. The AMG8833 thermal camera presents a cost-effective solution with a pixel resolution of 8 x 8. Its compact design facilitates seamless integration with various hardware components, including microprocessors. This sensor, although it has low resolution, demonstrates an effective capability in detecting the temperature distribution of small objects.
The AMG8833 thermal camera can detect temperature distribution on the surface of the mice’s body. The AMG8833 is capable of identifying regions on the mice's body exhibiting abnormal temperature variations, including hyperthermia and hypothermia. The measurement process does not necessitate direct contact, thereby minimizing stress in the mice. The capacity to detect temperatures up to 80°C is adequate for measuring the body temperature of mice, which typically falls between 36.5°C and 38.0°C .
2.1.2. Defining Mice Gender Parameter
Sex or gender is a complex biological construct that encompasses anatomy, physiology, genetics, and hormonal influences . All animals, including humans, engage in sexual reproduction. Sex is typically categorized as male or female, although there are variations in the biological components that constitute sex and the expression of these characteristics. Sexual reproduction in living organisms, particularly in animals, entails the process of reproduction that typically requires interaction between male and female individuals . This mechanism is crucial for species survival as it facilitates offspring production. Sexual reproduction facilitates population regeneration and enhances species survival and adaptation to changing environmental conditions. Additionally, sexual reproduction enhances genetic diversity through the combination of genetic material essential for species adaptation. In the absence of reproduction, populations are likely to decrease, which may lead to ecological imbalances .
The physical, behavioral, and physiological distinctions between male and female mice render them significant for diverse research applications . Comprehending these characteristics is crucial for effective management of mice and the integrity of experimental outcomes. Male mice are frequently utilized in research concerning aggressiveness, metabolism, and hormonal responses to testosterone. Male mice typically yield more consistent results due to the absence of an estrus cycle, which can introduce variability in research outcomes. Female mice are frequently utilized in reproductive, genetic, and hormonal research related to the estrus cycle . Male mice often exhibit rougher and slightly tangled fur compared to females based on their appearance. Female mice exhibit smoother fur and a neater appearance, attributed to their more intense grooming behavior.
Table 2 below presents the characteristics of mice categorized by gender . The table illustrates significant differences in the characteristics of male and female mice, as evidenced by variations in anogenital distance, nipple development, body size, testicular presence, levels of aggressiveness, reproductiv cycles, dominant hormones, behavioral patterns, mating responses, and typical research parameters employed.
Table 2. The comparison of the characteristics of male and female mice.

Characteristic

Male Mice

Female Mice

Anogenital distance

Longer

Shorter

Nipples

Not visible

Visible, especially after maturation

Body size

Larger

Smaller

Testes

Visible (in mature males)

Absent

Aggressiveness

More aggressive, specially toward other males

Less aggressive, more social

Reproductive Cycle

Absent

Has an estrous cycle (4-5 days)

Dominant Hormones

Testosterone

Estrogen and progesterone

Behavioural Pattern

Territorial, Frequent marking with urine

Less territorial, less frequent marking

Response to mating

Actively seeks mate

Receptive only during estrus

Use in research

Common in study, aggression, metabolism, and testosterone

Common in studies on reproduction and estrogen-related effects

Visual techniques, including the measurement of anogenital distance and the observation of testes, are frequently employed to differentiate gender, particularly in juvenile mice. However, The most straightforward method to determine the gender of a mice involves the application of computer vision technology, which relies on image scanning that focuses on anogenital distances. Anogenital distance, or AGD, serves as a primary metric for differentiating the gender of mice, particularly during the neonatal phase. A longer anogenital distance typically suggests the presence of a male mice, whereas a shorter anogenital distance is indicative of a female mice. AGD serves as a significant parameter in the fields of reproductive biology and toxicology research . Figure 1 illustrates the distinctions in gender characteristics between male and female mice.
Based on to Figure 1, the anogenital distance varies between male mice (right) and female mice (left), indicating sexual differentiation. The distance from the anus to the external genitalia is shorter in female mice compared to male mice . Determining the gender of young mice based on anogenital distance is challenging compared to adult mice . The determination of gender in mice can be conducted on the 21st postnatal day, utilizing anogenital distance as a criterion. Mice utilized in research typically range in age from 4 to 12 weeks . This age is frequently utilized in numerous studies due to the stable physiological condition and sexual maturity of the mice. However, mice aged 6 to 12 weeks are most frequently utilized.
According to the reviewed literature, these mice are utilized in various studies, including pharmacological research, which typically involves drug testing and dosage calculations based on body weight. Reproductive research is employed in the study of fertility and estrus cycles, particularly in females. Research on metabolism employs mice for investigations concerning obesity, diabetes, and hormonal responses. Cancer research frequently employs mice models, as tumors or cancer typically initiate at this age .
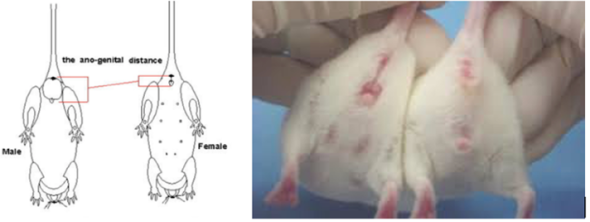
Figure 1. Anogenital distance male and female mice.
Object detection and deep learning are critical methodologies utilized across numerous biological and zoological applications . These technologies facilitate the detection, classification, and monitoring of animals in both laboratory and natural environments. Object detection facilitates the automatic identification and recognition of animal species in images or videos. Camera traps integrated with deep learning facilitate the monitoring of wildlife populations and their behaviors . Object detection facilitates the tracking of animal movement and social behavior within groups . Deep learning is employed to identify physical or behavioral anomalies that suggest the presence of disease .
The strengths and weaknesses of YOLO, Faster R-CNN, and SSD are summarized in Table 3 below.
Table 3. The strengths and weakness of deep learning algorithms.

Aspect

YOLO

Faster R-CNN

SSD

Speed

Very fast

Slow

Moderate

Detection Accuracy

Good, especially for larger objects

Excellent, for small objects

Good, but sometimes inconsistent

Small Object Detection

Improved in newer version

Highly accurate

Good, but not always consistent

Overlapping Object Detection

Limited

Very good

Limited

Computational Requirement

Low to moderate

High

Moderate

Bounding Box Precision

Good, but less precise

Highly precise

Good

Deep learning algorithms, including YOLO, Faster R-CNN, and SSD, are frequently employed for this classification task . Deep learning algorithms facilitate real-time detection of animals with high precision. Deep learning algorithms can be trained to identify various species and patterns using diverse datasets . This technology is applicable to diverse scales of research in both laboratory and field settings. CNN is employed for the identification of insect species in microscopic images . Faster R-CNN is employed for the identification of individual elephants through their ear patterns . YOLO is employed for the detection of sick or injured cattle by analyzing behavior and body position .
This study employs the YOLOv8 algorithm. Based on Table 3, it can be seen that the speed of YOLO is very fast and suitable for real-time applications. YOLOv8, a newer version, is a single-stage object detection algorithm, indicating that the detection process occurs in a single step, allowing it to operate on hardware with medium specifications. YOLOv8 demonstrates efficacy in object detection across diverse lighting conditions and camera angles. YOLOv8 demonstrates enhanced efficacy in the detection of small objects, including mice. Highly efficient and appropriate for real-time applications, including laboratory mice monitoring.
The two-stage processes of SSD and Faster R-CNN result in slower performance compared to YOLO, rendering them less appropriate for real-time applications. Consequently, it necessitates hardware with substantial computing capabilities (e.g., advanced GPUs), which may pose a limitation for certain laboratories.
2.1.3. Defining Mice Weight Parameter
The age of mice (6-12 weeks) significantly correlates with body weight, as this period represents a transition from active growth to physiological stability. At 4-6 weeks of age, mice demonstrate the capacity for independent living. Mice undergo a notable increase in body weight along with the development of organs, tissues, and metabolic functions between 6 and 12 weeks of age. Body weight stabilizaes by 12 weeks of age, rendering mice suitable for studies necessitating mature and consistent physiological conditions . Maintaining stable body weight at this age facilitates more reliable research in metabolic studies, including obesity, diabetes, and cardiovascular disease. Table 4 presents the average body weight of normal mice categorized by age and gender.
Table 4. The average body weight of normal mice.

Age (week)

Male Weight (gr)

Female Weight (gr)

6

18-22

15-19

8

20-25

17-21

10

22-30

18-23

12

25-35

20-25

In pharmacology and toxicology studies, drug doses are typically expressed in mg/kg body weight, making consistent body weight among subjects crucial for the validity of the results . Mice aged 6 to 12 weeks possess adequate body weight for effective drug metabolism, thereby minimizing result variability.
Variability in body weight among mice in an experimental group can lead to increased variability in research outcomes; therefore, it is advisable for researchers to select mice whose body weight falls within the normal range. Studies utilizing mice with a standard body weight yield more reliable data, particularly in research related to metabolism, pharmacological responses, or toxicology .
To obtain measurements of mice weight parameters, various sensors are available for use in measuring mice. The sensors include load cells, strain gauges, and capacitive resistors. Numerous studies employ load cell sensors for weight detection, including applications in cattle weight measurement . Load cell sensors are utilized in the pharmaceutical and health sectors for applications such as infusion monitoring , human weight measurement , and precision agriculture . Additionally, other areas of focus include bridge load weight measurements for pedestrians and traffic monitoring through weight-in-motion systems .
According to Table 5, The load cell is the most appropriate sensor for measuring mice weight due to its high accuracy and sensitivity, which are suitable for small weights. It can detect minor changes in weight, a critical factor for mice weighing between 18 and 35 grams.
Table 5. The comparison of weight sensors.

Aspect

Load Cell

Strain Gauge

Capacitive Sensor

Accuracy

Very high

High

Moderate

Response Time

fast

Fast

Fast

Measurement Range

Low to high range

Low to high range

Limited to light weight

Sensitivity

Good for small weight

Excellent for small weight

Low for small weight

Suitability for mice

Highly suitable

Suitable

Less suitable

Weakness

Sensitive to vibrations

Requires signal amplification

Prone to environmental noise

Cost

Moderate

Moderate

Relatively low

Implementation

Easy

Requires additional circuitry

Easy

Furthermore, load cells offer real-time results characterized by a high degree of precision. Load cells can be readily integrated with electronic systems utilizing microcontrollers or computers for data processing. Strain gauge sensors serve as a viable alternative for applications necessitating high accuracy; however, they necessitate supplementary circuits, including signal amplifiers. Capacitive sensors represent a potential option for non-invasive applications; however, they are suboptimal for measuring mice weight, which necessitates high precision.
Consequently, a load cell with a capacity of 50 grams was selected for this system. This is due to the potential for more precise measurement results. Moreover, the weight measurement system that incorporates the Kalman filter will successfully address the noise present in the sensor's measurement results .
2.2. Design and Architecture of the Proposed System
The literature review indicates that the majority of sorting processes for laboratory animals continue to employ manual methods dependent on the expertise of animal handlers. Certain automatic selection systems remain confined to large laboratories and operate based solely on a single parameter. In a sorting process, multiple sorting parameters are required rather than relying on a single parameter. Consequently, these limitations create a gap stemming from the absence of an automation system that simultaneously integrates health, gender, and weight parameters. The proposal for the design, planning, and integration of a laboratory animal sorting system will focus on three parameters: health, gender, and weight of mice. It is anticipated that this approach will address the accuracy and efficiency limitations of comparable systems in laboratory research, as well as the absence of sensor fusion applications for managing laboratory mice.
Figure 2 presents a block diagram of the proposed mice sorting system. The selection chamber consists of three sequential sections. The initial chamber is designated as a temperature chamber. An infrared sensor is installed in this chamber to quantify and detect the presence of mice in chamber 1. The AMG8833 Thermal Sensor is positioned in chamber 1 to measure the body temperature of mice for health assessment purposes. The Servo SG90 regulates the door's movement, facilitating the opening and closing of mice access to the chamber. Servo MG995 adjusts the vertical position of the mice platform.
The second chamber is designated for gender classification. A webcam is present in this chamber to detect mice for the purpose of gender classification utilizing an object detection algorithm. Infrared sensors are utilized to quantify and identify the presence of mice within this chamber. Additionally, this chamber contains Servo MG995 and SG90, which are utilized to control mechanical movements, including door operation and the movement of mice to the subsequent chamber.
Weight measurements of mice are conducted in the third chamber. A Load Cell (with HX711) is installed in this chamber to accurately measure the weight of mice. A mechanical limit for platform movement is provided by the installation of an end stop sensor in this chamber. The Servo SG90 is installed in this chamber to regulate the opening and closing of the door. A stepper motor with a DM556 driver is installed in this chamber to facilitate the precise movement of the conveyor platform for transferring mice to the collection chambers, based on weight, gender, and the required number of mice.
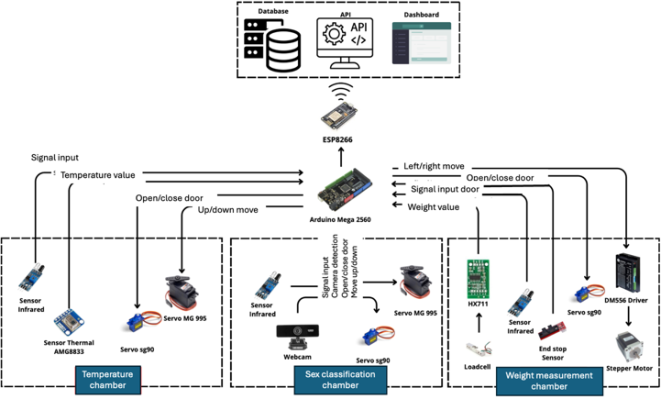
Figure 2. Diagram Block of the Proposed System.
The system employs the Arduino Mega 2560 as the primary controller to acquire data from sensors, manage mechanical movements, and transmit data to the communication module. The system utilizes the ESP8266 WIFI module to transmit data to the dashboard through an API. The database stores data related to the measurement of temperature, gender, and weight of mice for analysis and archiving purposes. The dashboard interface serves as a user interface for real-time system status monitoring, data visualization, and system control.
2.2.1. Object Detection Design Module
This subsection outlines the implementation of object detection utilizing computer vision techniques. This system employs Python, a scripting language centered on object-oriented programming. A significant number of programmers utilize this language due to its simplicity. Python, characterized by its straightforward syntax, is compatible with nearly all operating systems. This programming language is utilized for image recognition and is applicable for additional functions, including color recognition, gender recognition, and health detection in animals .
OpenCV, or Open-Source Computer Vision Library, is a software library designed for real-time image processing and computer vision applications, and it is open-source. Computer Vision is a technology designed to emulate human visual capabilities in electronic devices, enabling them to comprehend and interpret the significance of captured images . OpenCV is compatible with multiple programming languages, including Python, C, and C++.
This system employs Roboflow for multiple dataset management functions. Roboflow is a framework for computer vision development that facilitates data collection, preprocessing, and model training methodologies . Roboflow is capable of annotating objects for detection using bounding boxes. YOLO comprises multiple versions, including YOLOv1 to YOLOv8 . YOLOv8 is employed for gender detection in mice due to its status as the most widely utilized version of the YOLO algorithm. It offers several advantages, including superior performance relative to earlier versions, enhanced speed and accuracy in object detection, capability to identify objects of varying sizes within a single image, and effective detection in large images while maintaining accuracy in the object detection process .
Figure 3 illustrates that this system operates through a series of steps.
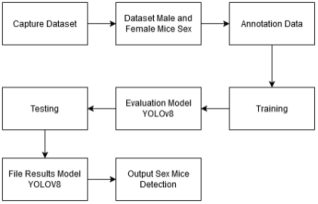
Figure 3. Diagram block of detection object module.
The data set utilized is the mice data set from the STASRG laboratory at Telkom University. A data set was initially collected comprising images of both male and female mice. The dataset was acquired using a camera that captures images of mice under diverse angles and lighting conditions. The objective of collecting this dataset is to create a sample of mice with adequate variation to ensure effective generalization of the gender detection model. The collected data is categorized according to the gender of the mice (male and female). This dataset is structured to maintain a balance in both the quantity and quality of data across the two classes (male and female). The collected data set of STASRG comprised over 6000 images. The total dataset for female mice comprised 3003 entries, while the dataset for male mice included 3719 entries. Structuring a data set effectively enhances the organization of deep learning model training.
The subsequent phase involves annotating the dataset. The dataset is categorized and subsequently annotated with annotation software, including LabelImg or Label Studio. Annotation entails assigning a bounding box to the genital region or other pertinent areas to differentiate between males and females. This provides information to the model regarding the visual features to be recognized during training.
Upon completion of the dataset annotation, the dataset will proceed to the training phase for the YOLOv8 model. The model is designed to identify and categorize the gender of mice using the provided visual data. At this stage, training parameters including learning rate, number of epochs, and batch size are established to attain optimal accuracy. The training process for the YOLOv8 model is conducted utilizing Google Colab. Google Colab is a cloud-based service utilizing Jupyter Notebook for the dissemination of machine learning education and research. The objective of the training is to develop an object detection model capable of accurately detecting and classifying objects in images or videos in real-time. The system demonstrates a high accuracy in recognizing the gender of mice.
The subsequent phase involves evaluating the model to assess the performance of the object detection system post-training. This evaluation aims to verify the model's effectiveness and accuracy in object detection, as well as to identify its strengths and weaknesses concerning a specific dataset. Metrics including precision, recall, F1-score, and mean Average Precision (mAP) are employed to evaluate model performance. Obtain the YOLOv8 model file to evaluate the detection of mice gender.
During the testing phase, the trained and evaluated model is assessed using an independent test dataset that was not encountered during the training process. This process seeks to replicate actual conditions in which the model is employed to identify the gender of mice. This testing phase verifies the model's ability to generalize effectively beyond the training dataset.
2.2.2. Built the Prototype
This stage involves the construction of the prototype. Figure 4 illustrates the design construction in three-dimensional form. The design is modular and resembles a habitat for mice. The tiered design facilitates the integration of multiple functions within a compact space. The acrylic material is designed to enhance the monitoring of mice throughout the process. The automatic transfer system minimizes manual intervention, thereby enhancing the efficiency and accuracy of the sorting process. Adjustments can be made to various parameters, including temperature, gender, and weight, based on laboratory requirements.
The image in Figure 4 depicts the upper chamber designated for classifying mice according to their health status. This chamber contains two compartments that elevate the positioning of the mice to a higher level. The initial chamber is designated as the sick chamber. This chamber is designated for mice identified as unhealthy, which will be isolated for quarantine or euthanasia. Healthy mice will continue to enter the second chamber to determine their gender, whether male or female.
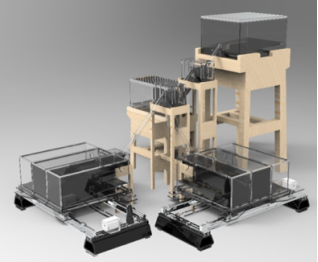
Figure 4. Chamber Design.
Healthy mice will be assessed using computer vision in the second chamber. At the conclusion of the second chamber, healthy mice, both male and female, will proceed to the load cell chamber. Upon detection of a male, the male conveyor will initiate movement, receiving the selected mice based on its weight and gender classification. If the selected mouse is female, the female conveyor will prepare to receive the selected mice based on its weight and gender classification, similar to the male conveyor's process.
The conveyor design is positioned at the end of chamber 3 as seen in Figure 5, serving to measure the weight parameter as the final parameter in the system. Mice that are accurately classified at the conclusion of the sorting process will be allocated to chambers labeled with their respective weights. The total number of classification chambers is six chambers, comprising three chambers designated for selected male mice and three chambers for selected female mice.
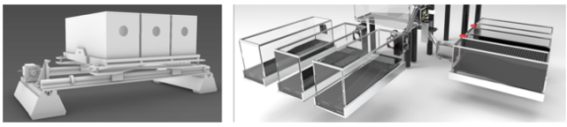
Figure 5. Conveyor design for classified mice.
2.3. Flowchart of the Proposed System
This stage presents the explanation of the flowchart's functionality, as illustrated in Figure 6. The system delineates a procedure for the automated sorting of mice across multiple chambers, incorporating measurements of health parameters, gender, and weight. The system initiates by confirming the readiness of all chambers. The weight parameters for the selected mice are specified by inputting the range in parameters A and B, whereas parameter C represents the unselected weight parameter.
The initial parameters are established (TF_A, TF_B, TF_C), representing the total number of mice for each selected mice at a specified weight. The mice subsequently enter chamber 1, initiating system activation and enabling the thermal sensor to measure their body temperature for health status assessment. Mice with a temperature ranging from 36.5°C to 38°C are classified as healthy and subsequently transferred to the next chamber. The mice will be sent to the quarantine chamber if the temperature deviates from the usual range.
Subsequently, the healthy mice proceed to the second chamber for gender classification. The active gender classification process employs a camera in conjunction with an object detection algorithm. If the mice is male (male = 1), it is relocated to the male chamber. If the mice is female (male = 0), it is relocated to the female chamber. Following the detection of gender classification, the subsequent step involves the weight measurement process utilizing a load cell. If the weight of the mice falls within a specified range of parameter A, the mice will be placed in the chamber designated as "Range A". If the weight of the mice falls within the specified range B, it is classified as "Range B". Additionally, mice with weights outside the specified range will be placed in chamber C.
The conveyor's implementation in the system yields a synthesis of gender and weight classification outcomes utilized to ascertain the trajectory for mice movement. When the parameters for male and weight range A are satisfied, male mice within weight range A are transferred to chamber male A. When the parameters for male and weight range B are satisfied, male mice within weight range B are transferred to chamber male B.
If the male parameter is false and weight range A is true, female mice within weight range B are transferred to chamber female A. If the male parameter is false and the weight range B parameter is true, then female mice within weight range B are transferred to chamber female B. If the weight falls outside range A or range B, the mice are relocated to chamber male C or female C. The variables (TF_A, TF_B, TF_C) are updated based on the mice category, monitoring the quantity of mice within each category. The system subsequently transmits all parameters related to detection results, including health, gender, and weight, are transmitted to the dashboard through the ESP8266 for monitoring purposes. Additionally, the system verifies the fulfillment of all conditions (TF_A and TF_B are satisfied). The system ceases operation upon fulfillment of all conditions.
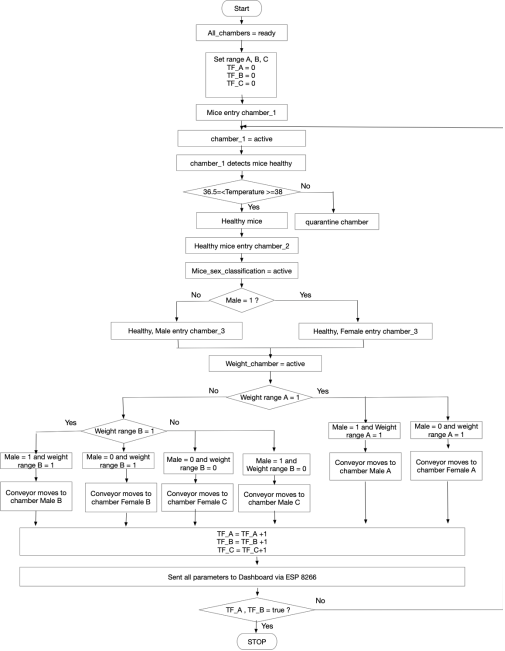
Figure 6. Flowchart of the proposed system.
2.4. Proposed System Performance Testing Scenarios
This stage determines the methodology for testing system performance. The system will undergo testing through multiple test scenarios. The first scenario involves performing a temperature assessment on 25 mice. Sick mice will be placed in the quarantine chamber, whereas healthy mice will proceed with the second test performance.
The second scenario involves testing the performance of gender classification in comparison to that of YOLOv8. Under this condition, a total of 25 mice will be utilized to classify the gender of those entering the second chamber. The system will evaluate the percentage of precision achieved by the gender classification in the YOLOv8 module. The evaluation value is derived from the confusion matrix, incorporating accuracy class calculations and prediction class assessments . The parameters utilized include True Positive (TP), which represents the count of positive instances accurately predicted by the model. True Negative (TN) refers to the count of negative instances accurately predicted by the model. In contrast, False Positive (FP) and False Negative (FN) represent the instances of negative data misclassified as positive, commonly referred to as Female Error. The count of positive data misclassified as negative (Male Error).
The performance analysis is derived from equations (1), (2), (3), and (4). Accuracy represents the proportion of correct predictions relative to the total data set. Precision indicates the ratio of true positive predictions to the total positive predictions made. Recall is an analysis of sensitivity for the true positive rate, indicating the proportion of positive instances accurately identified. The F1-Score is examined as it represents the harmonic mean of precision and recall .
Accuracy= TP+TNTP+TN+FP+FN(1)
Precision= TPTP+FP(2)
Recall= TPTP+FN(3)
F1-Score=2 x Precision x RecallPrecision+Recall(4)
The third scenario involves conducting a weight test on multiple subjects to detect and measure the weight of mice, with 25 mice tested five times each. This procedure assesses the accuracy of the system in measuring the weight of mice.
The fourth scenario involves testing the system on 25 mice, comprising 4 selected male mice and 2 selected female mice, all within a weight range of 3 to 13 grams. Subsequently, three male and four female mice were selected within a weight range of 14 to 20 grams. This study will evaluate the percentage of the system's accuracy in sorting 25 mice according to the specified input categories. The four system scenarios will calculate the detection response time for each chamber, as well as the total response time for the entire sorting process.
3. Results
3.1. Test Performance for Healthy Chamber
The initial assessment involves the temperature measurement chamber test. In this chamber, 25 mice were inserted sequentially, one at a time. The testing scenario can be seen in Figure 7. The mice move from the initial placement area into the chamber designated for temperature measurement.
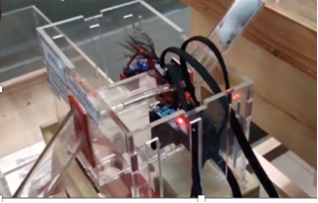
Figure 7. Testing scenario for healthy mice.
In the meantime, the system records the temperature of every mice that enters and transmits this data to the online mice dashboard. Figure 8 displays the temperature measurements taken from 25 mice. The graph illustrates that the horizontal axis (X-axis) represents the sequence of mice tested, ranging from the 1st to the 25th mice. The Left Vertical Axis (Y-Axis, Response Time) quantifies the response time in seconds (s) required for the system to detect and process mice data. The right vertical axis (Y-Axis, Temperature) displays the body temperature of the mice in degrees Celsius (°C). The response time for detecting mice is consistently stable, averaging between 2 to 3 seconds. The body temperature of the mice ranges from 36.5°C to 39°C.
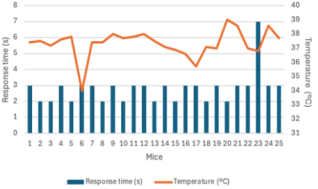
Figure 8. Temperature measurement results.
The majority of mice maintain a body temperature within the normal range of 36.5°C to 38°C, suggesting overall health status. Some mice exhibit body temperatures below 36.5°C, suggesting hypothermia and poor health, while others exceed 39°C, indicating hyperthermia or stress. The system demonstrates a stable response time, averaging 3 seconds. The chamber for the subsequent system may be accessed based on the condition of the mice. The quarantine chamber will open if the temperature exceeds 38°C and falls below 36.5°C. Healthy mice will proceed to the subsequent chamber for additional sorting. Concurrently, the temperature discrepancy measured by the temperature meter that was employed was within the range of 0 to 0.7°C. This demonstrates satisfactory efficacy when determining the mice's body temperature.
3.2. Test Performance for Mice Gender Classification Chamber
Figure 9 below illustrates the execution of the testing scenario in chamber 2. Healthy mice will enter this chamber for sorting according to their gender. At this stage, the chosen mice, regardless of gender, will proceed into the load cell chamber, where their weight will be recorded in the subsequent measurement.
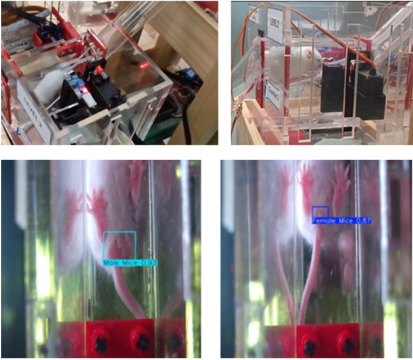
Figure 9. Testing scenario for gender classification chamber.
Upon completion of the YOLOv8 custom model training using the specified dataset and Google Colab, the process will proceed to the model evaluation phase, yielding the convergence matrix graph and training result graph. The YOLOv8 custom model facilitates object detection by utilizing predefined classes, specifically the Male mice class and the Female mice class. The experiment involved 30 mice, comprising 15 females and 15 males, with variations in weight and age. Table 6 presents the test results.
Table 6 indicates that a total of 13 male and female mice are accurately identified as true positives (TP). Two female mice are misclassified as male (false positive), and two male mice are misclassified as female (false negative). The average response time for male mice is 3.38 seconds, suggesting high processing efficiency. The average response time for female mice is 3.20 seconds, which is marginally faster than that of male mice. Meanwhile, the average model confidence level for male mice is 91%, reflecting a high degree of certainty in the prediction. The average model confidence level for female mice is 87%, which is marginally lower than that of male mice, yet remains at a commendable level.
Table 6. Mice gender classification results.

Mice

Predicted Male

Predicted Female

Avg response time (second)

Avg confidence value (%)

Actual Male

13

2

3.38

91%

Actual Female

2

13

3.20

87%

The evaluation metrics for assessing the overall performance of the model are presented in formulas (1), (2), (3), and (4), indicating that the total accuracy achieved is 86.67%. This indicates strong performance, suggesting that a majority of the predictions are accurate. The Precision value for both Male and Female stands at 86.67%, with the recall for each also at 86.67%. Similarly, the F1-Score achieved for both women and men stands at 86.67%. Consequently, the precision and recall values for both genders are equal (86.67%), demonstrating a balanced capability of the model to identify both classes.
3.3. Test Performance for Mice Body Weight Chamber
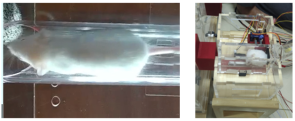
Figure 10. Load cell chamber scenario.
The experimental setup for measuring the weight of mice involves a 50-gram Loadcell and an acrylic tube with a specific cross-section, designed for the mice to traverse through the tube tunnel during the measurement process as seen in Figure 10. The noise present in the Loadcell has been effectively addressed through the implementation of a Kalman Filter in the weight calculation process.
The initial test was conducted to evaluate the response time and assess the appropriateness of the mice weight through multiple trials. Figure 11 presented below displays the performance test results for the load cell chamber. The graph illustrates the consistency of weight measurements of mice across multiple trials. The graph indicates that weight measurements were conducted 30 times on mice, with the recorded weights of 13.28 grams, 19.2 grams, and 24.4 grams corresponding to the small, medium, and large mice categories, respectively. The graph indicates that there were slight variations in the measurement results. The mice’s weight measurement system demonstrated consistent performance, yielding stable results across 30 trials. The discrepancy observed was approximately 0.05 to 0.12 grams for smaller mice, whereas for larger mice, the difference measured was about 0.01 to 0.08 grams.
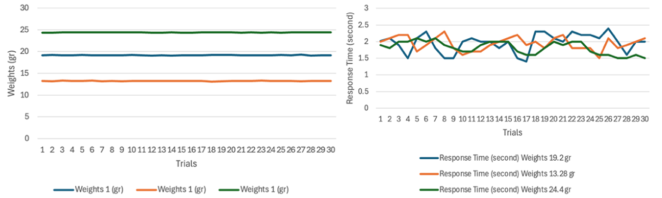
Figure 11. Load cell chamber performance results.
The response time graph of the load cell reading indicates that the system operates with consistency and reliability across a range of mice weights. The range of response times observed is between 1.5 and 2.5 seconds across all mice weights. Mice weighing 13.28 grams exhibit a marginally increased response time on average when compared to their heavier counterparts. Mice weighing 19.2 grams exhibit a more stable response time, demonstrating minimal variation. In contrast, mice exhibiting a greater weight of 24.4 grams demonstrate a response time that is generally lower and more consistent compared to other groups. Consequently, the weight of the mice does not appear to have a meaningful impact on the response time. It appears that mice weighing 13.28 grams exhibit a marginally increased response time, which may be attributed to the sensor's heightened sensitivity to smaller objects.
3.4. Test Performance for Integrated System Intellimice Classifier
The fourth scenario entails an evaluation that encompasses the complete system. A selection process will commence with 25 randomly chosen mice being entered at random. The selection dashboard facilitates the input of selection criteria, specifically the number and gender, to execute the selection process. This involves sorting 4 chosen male mice and 2 chosen female mice, all falling within the weight range of 9 to 13 grams for the initial selection. Subsequently, a selection of three male mice and four female mice is made, all falling within the weight range of 14 to 20 grams. This study aims to assess the accuracy percentage of the system in categorizing 25 mice based on the designated input criteria. The sorting process for each mice will involve a sequence of steps: health detection, gender detection, weight detection, and ultimately, the placement of selected mice into chambers based on the established classification criteria. The four stages of system selection will assess the detection response time for each chamber, in addition to the overall response time for the complete sorting process.
Table 7. Intellimice classifier system performance results.

No of Mice

Chamber 1 (Temperature °C)

Chamber 2 (gender detection male/female)

Chamber 3 (weight)

Conveyor

Total Process (second)

Status

Time (s)

Gender

Time (s)

Weight (gr)

Class Chamber

Time (s)

Time (s)

1

Healthy

2.26

Male

2.32

9.95

Right

3.92

3.13

11.63

2

Healthy

3.01

Male

2.59

19.9

Left

4.17

6.06

15.82

3

Healthy

2.55

Female

2.71

39.75

Centre

4.27

7.58

17.11

4

Healthy

2.43

Male

2.55

9.88

Right

4.30

3.55

12.83

5

Healthy

2.63

Female

2.66

19.85

Left

4.34

4.09

13.72

6

Sick

2.34

N/A

N/A

N/A

N/A

N/A

N/A

2.34

7

Healthy

2.77

Female

2.73

9.68

Right

4.62

2.55

12.67

8

Healthy

2.62

Male

2.45

14.15

Left

4.64

4.64

14.35

9

Healthy

2.69

Female

2.92

29.66

Centre

4.33

7.46

17.40

10

Healthy

2.74

Male

2.75

9.91

Right

4.22

2.43

12.14

11

Healthy

2.85

Female

2.88

16.8

Left

3.38

5.14

14.82

12

Healthy

2.82

Female

3.17

26.74

Centre

4.42

6.92

17.33

13

Healthy

2.56

Male

3.06

29.88

Centre

4.87

7.36

17.85

14

Healthy

2.41

Male

3.13

10.12

Right

4.44

3.22

13.20

15

Healthy

2.60

Male

3.20

20.23

Left

4.82

5.80

16.42

15

Healthy

2.53

Male

3.04

34.31

Centre

4.55

7.54

17.66

17

Sick

2.39

N/A

N/A

N/A

N/A

N/A

N/A

2.39

18

Healthy

2.21

Female

3.28

16.54

Left

3.82

5.03

14.34

19

Healthy

2.25

Male

3.57

25.34

Centre

4.52

5.56

15.90

20

Sick

3.19

N/A

N/A

N/A

N/A

N/A

N/A

3.19

21

Sick

3.40

N/A

N/A

N/A

N/A

N/A

N/A

3.40

22

Healthy

3.27

Female

3.59

9.32

Right

4.65

2.28

13.79

23

Healthy

3.57

Female

4.12

36.76

Centre

4.77

6.68

19.14

24

Sick

3.11

N/A

N/A

N/A

N/A

N/A

N/A

3.11

25

Healthy

3.49

Female

3.33

18.69

Left

4.98

4.47

16.27

Table 7 indicates the serial numbers assigned to the mice tested, ranging from 1 to 25. Chamber 1 (temperature °C) indicates the physiological state of the mice as determined by their body temperature. The healthy status indicates that body temperature falls within the normal range of 36.5°C to 38°C, whereas a sick status is identified when the mice's temperature deviates from this range. In the event that mice exhibit signs of illness, it will be relocated to the designated sick chamber, and all processing activities will be paused. The system subsequently resets and proceeds to the subsequent mice sorting process. The time indicated in the temperature table column represents the response time necessary for detecting the body temperature of the mice. The chamber 2 column presents the outcomes of gender detection, identifying individuals as either male or female, while the N / A status signifies that the affected mice did not proceed to the subsequent process. The time column in gender indicates the duration needed to identify the gender of the mice through the utilization of a camera and an object detection algorithm.
The weight of chamber 3 column is assessed next. The weight column (gr) indicates the mass of the mice as determined by a load cell measurement. In the event that the mice unwell, this column will display non-applicable information (N / A). The class chamber column illustrates the categorization of mice according to their body weight. Information regarding Right, Left, or Center This pertains to the conveyor line utilized for categorizing mice according to their weight classification. The duration indicated in the weight column reflects the time necessary for measuring the weight of the mice. The conveyor column indicates the duration necessary for the conveyor to transport the mice to the designated line or chamber, as determined by the classification outcomes related to temperature, gender, and weight. The total process time indicates the duration needed to sort the mice, measured from the beginning of the process until their successful classification as they are moved through the conveyor
The analysis of chamber 1 indicated that the majority of the mice were classified as healthy, with an average processing time ranging from 2 to 3 seconds. Mice categorized as sick (for instance, mice 6, 17, 20, 21, 24) did not proceed to the subsequent process. The purpose of this procedure is to distinguish sick mice from healthy ones, enabling the immediate quarantine of sick individuals to mitigate the risk of disease transmission to other mice.
In chamber 2, the classification based on gender demonstrated that healthy mice were effectively categorized as Male or Female, achieving an average processing time of 2.5-4 seconds. This result indicates the system's accuracy and consistency in processing time.
In the chamber 3 process of weight measurement, the weights of the mice ranged from approximately 9.91 grams to 39.75 grams, reflecting a significant variation in body weight. The typical duration for weight processing is approximately 4 to 5 seconds. The data indicates that the Conveyor efficiently directs the mice to the correct track within an average time frame of 3 to 7 seconds. The testing process outlined indicates that the total time required for sorting and classifying each healthy mice falls within the range of 12 to 19 seconds. The total processing time for sick mice is currently limited to the initial phase, with an average duration of 2-3 seconds.
Based on the testing conducted on the sorting and classification of 25 mice, the system demonstrates its ability to classify according to the initial input parameters. Specifically, it identifies 4 male mice and 2 female mice within the 9-13-gram class category, while categorizing 3 male mice and 4 female mice in the 14-20-gram category. The unselected mice are positioned in the central chamber.
In the interim, Figure 12 illustrates the reading system present on the monitoring dashboard of the Intellimice Classifier. The dashboard indicates that the system is capable of transmitting data to the monitoring interface.
Figure 12. Dashboard performance of web-based monitoring.
4. Discussion
This system is referred to as an Intellimice Classifier, functioning as a laboratory animal sorter or classifier. It utilizes a combination of sensor fusion to categorize mice according to their health, weight, and gender. This system presents several significant implications within the realms of laboratories and automated system technology. This technology combines multiple sensors, including thermal, visual, and load cells, to conduct a comprehensive analysis of various parameters such as temperature, gender, and weight within a single integrated system. This system enhances the efficiency and automation of laboratory processes, assisting animal caretakers in performing manual sorting tasks. The system efficiently processes mice in an average time range of 12-19 seconds for healthy specimens, thereby considerably minimizing the requirement for human labor.
First, this system incorporates an initial assessment of mice at the start of the sorting process, allowing for the immediate classification of those with health issues. Consequently, the process is halted in Chamber 1, demonstrating effectiveness in the early identification of mice that fail to meet research standards. This system is capable of identifying potential disease occurrences and mitigating the risk of transmission to other mice or to animal handlers. Second, it supports the justification for employing sensor fusion technology. The reliable outcomes of body temperature, gender, and weight classification underscore the effectiveness of sensor fusion technology in tasks related to small animal detection. The precise accuracy achieved in classifying mice gender and grouping by weight indicates significant potential for application in a range of biological and zoological research contexts. Third, enhancing the welfare of laboratory animals is achieved through a non-invasive process that employs cameras and sensors for detection, which significantly reduces stress on mice in comparison to manual methods. The swift identification of sick mice allows for their prompt segregation into quarantine, thereby enhancing the management of animal welfare. Fourth, there exists an opportunity for scalability. This system is capable of adaptation for laboratory environments that require handling a greater quantity of mice or in research contexts that necessitate sorting other animals exhibiting varying physiological characteristics.
The test results indicate that this system is capable of conducting mice classification tests by considering temperature, gender, and weight conditions across a sample of 25 mice. The total duration is approximately 6 minutes. In contrast, sorting 400 mice requires less than 1.5 hours. This system has the potential to enhance the efficiency of animal caretakers in the categorization of laboratory animals while reducing the need for invasive procedures.
However, this system exhibits multiple limitations. The system operates solely within established parameters, specifically temperature, gender, and weight. Mice exhibiting health conditions that remain undetected via body temperature measurements, including infections that do not present with elevated temperature symptoms, are not comprehensively categorized. The dataset's performance is constrained, necessitating ongoing updates to the mice dataset to enhance confidence and achieve a target level of 98%. The weight range that results in a variance of up to 0.1 grams necessitates multiple calibration processes, conducted every 5 minutes on the system. The response time of the conveyor for moving mice exhibits minor yet significant fluctuations in certain instances, potentially impacting throughput in large-scale situations. This necessitates further comprehensive testing to enhance system performance. The reliance on infrastructure presents a constraint for this system, as it necessitates intricate hardware and software, leading to substantial initial expenses and the need for operator training for effective management.
To improve and develop the intelligent classifier system, in the future, the conveyor design can be optimized to improve system performance. In addition, quarantine system integration or additional data processing for mice with Sick status can be added. To improve system performance in sorting the gender of laboratory animals, further research can expand the data set with mice with a larger population and diverse conditions such as rabbits or hamsters by adjusting the data set and deep learning algorithm.
Future enhancements to the intelligent classifier system may involve optimizing the conveyor design to enhance overall system performance. Furthermore, the integration of a quarantine system or the implementation of additional data processing for mice classified as sick can be incorporated. Enhancing system performance in categorizing the gender of laboratory animals necessitates further research. This can be achieved by broadening the data set to include a larger population of mice and incorporating diverse conditions, such as those of rabbits or hamsters, through adjustments to both the data set and the deep learning algorithm.
The integration of parameters related to mice activity can enhance classification capabilities, enabling the development of a respiratory pattern detector. This can be achieved through the use of multi-sensor technology, which combines microphones or piezo electrics, behavior detection via accelerometers, and mice fur condition assessment through deep learning techniques. Advanced research can be conducted to forecast the health status of mice by analyzing variations in body parameters through AI. This includes employing clustering techniques to identify new data by utilizing unsupervised learning to categorize mice according to unforeseen or ambiguous patterns. The results section should provide an accurate and concise description of the experimental findings, and the resulting conclusions that can be inferred from the experiments. Meanwhile, the results should be presented in a transparent and truthful manner, avoiding any fabrication or improper manipulation of data. Where applicable, results of statistical analysis should be included in the text or as tables and figures.
5. Conclusions
This research focused on the development and testing of an automated system that utilizes multiple sensors to categorize laboratory mice based on their body temperature, gender, and weight metrics. The system was effectively engineered to automate the processing of mice through the application of sensor fusion technology. This approach combines a thermal sensor for detecting body temperature, a camera employing the YOLOv8 algorithm for gender classification, and a load cell sensor for weight measurement. The total time required for the healthy mice process averages between 12 and 19 seconds, indicating a significant efficiency advantage over manual methods. The automated process significantly decreases both the time and the labor needed for sorting mice, a task that was formerly performed manually. The system delivers reliable outcomes, minimizing the potential for human error in both measurement and classification procedures. The system employs a non-invasive approach, thereby minimizing stress on mice during the classification process in comparison to manual methods.
The measurement of temperature, gender, and weight parameters is conducted in a manner that avoids direct contact, thereby ensuring the welfare of the mice is not compromised. This system exhibits limitations in its ability to assess mice health, as it relies solely on body temperature, thereby lacking a comprehensive understanding of potential illnesses. The dataset utilized remains constrained to a relatively small sample of mice, indicating that additional testing on a larger population is essential to enhance the generalizability of the system. The system requires a calibration process every 5 minutes to maintain stability in body scale measurements and to mitigate significant deviations. This study, despite its limitations, presents significant opportunities for advancing automated laboratory technology in the future.
Future research could focus on enhancing the system by broadening the dataset, incorporating supplementary parameters, streamlining the process time on the conveyor, and evaluating multispecies scenarios through the application of algorithms or alternative sensor fusion techniques. The conclusion section should precisely articulate the main findings of the article, emphasizing its significance and relevance. In the conclusion, it is highly recommended that authors avoid referencing figures or tables. Instead, these should be appropriately referenced within the body of the paper.
Abbreviations

YOLOv8

You Only Look Once Version 8

Kg

Kilograms

s

Second

AGD

Anogenital Distance

R-CNN

Region-based Convolutional Neural Network

SSD

Single Shot Detector

WiFi.

Wireless Fidelity

OpenCV

Open Source Computer Vision Library

STASRG

Smart Technology and Applied Sciences the Rapid Research Generator

mAP

Mean Average Precision

N/A

Not Applicable

TP

True Positive

TN

True Negative

FP

False Positive

FN

False Negative

Acknowledgments
We express our gratitude to the Directorate of Research and Community Service at Telkom University. We express our gratitude to the Center of Excellence Smart Technology and Applied Science - Rapid Research Generator School of Applied Science, Telkom University (CoE STAS-RG) for their provision of the research dataset and also PT. BIOFARMA for issuing the Institutional Animal Care and Use Committee (IACUC) letter KKPHL/IACUC/2024.
Author Contributions
Giva Andriana Mutiara: Conceptualization, Methodology, Supervision, Validation, Writing - original draft, Writing - review dan editing.
Periyadi: Data curation, Investigation, Visualization
Muhammad Rizqy Alfarisi: Data curation, Resources, Software
Lisda Meisaroh: Formal analysis, Project administration
Funding
The research received funding from the Matching Fund Scheme in Kedaireka 2024, reference No. 011/PKS/D.D4/PPK.01.APTV/I/2024.
Data Availability Statement
1. The data is available from the corresponding author upon reasonable request.
2. The data supporting the outcome of this research work has been reported in this manuscript.
Conflicts of Interest
The authors declare no conflicts of interest.
References
[1] K. Bayne, Revised Guide for the Care and Use of Laboratory Animals available. American Physiological Society., vol. 39, no. 4. 1996.
[2] M. I. P. Gentil, “Mouse Biomethodology,” Lab. Anim., vol. 45, no. 4, pp. 231-239, 2012, [Online]. Available:
[3] G. A. Mutiara, G. I. Hapsari, M. R. Alfarisi, Periyadi, L. Meisaroh, and N. N. Adisty Hadian, “Body Weight-Based Animal Laboratory Classification Utilizing Load Cell and IoT,” in 2024 12th International Conference on Information and Communication Technology, ICoICT 2024, 2024, pp. 425-431,
[4] N. Kokras and C. Dalla, “Sex differences in animal models of psychiatric disorders,” Br. J. Pharmacol., vol. 171, no. 20, pp. 4595-4619, 2014,
[5] J. M. Chalovich and E. Eisenberg, “Psychological Stress and the Human Immune System: A Meta- Analytic Study of 30 Years of Inquiry Suzanne,” Magn Reson Imaging, vol. 31, no. 3, pp. 477-479, 2013,
[6] D. Verdun, Occupational Health For Animal Workers, no. March 1996. 2021, pp. 1-2,
[7] V. Barrile, S. Simonetti, R. Citroni, A. Fotia, and G. Bilotta, “Experimenting Agriculture 4.0 with Sensors: A Data Fusion Approach between Remote Sensing, UAVs and Self-Driving Tractors,” Sensors (Basel)., vol. 22, no. 20, 2022,
[8] G. A. Mutiara, Periyadi, L. Meisaroh, M. R. Alfarisi, W. M. Yasin, N. N Adisty, M. A. R. Zain, “Integrated Sensor-Based Smart Mannequin for Injury Detection in Armored Vehicle,” Int. J. Saf. Secur. Eng., vol. 13, no. 4, pp. 625-633, 2023,
[9] A. Rifqi, G. A Mutiara, Periyadi, M. R. Alfarisi, A. Sitorus, and R. D. Adhira, “Developing Smart Skin: A Force Sensor-Based Touch and Pressure Detector,” in International Conference on Information and Communication Technology (ICoICT), 2024, pp. 1-8,
[10] C. A. Aguilar-Lazcano, I. E. Espinosa-Curiel, J. A. Ríos-Martínez, F. A. Madera-Ramírez, and H. Pérez-Espinosa, “Machine Learning-Based Sensor Data Fusion for Animal Monitoring: Scoping Review,” Sensors, vol. 23, no. 12, pp. 1-28, 2023,
[11] R. Arablouei, Z. Wang, G. J. Bishop-Hurley, and J. Liu, “Multimodal sensor data fusion for in-situ classification of animal behavior using accelerometry and GNSS data,” Smart Agric. Technol., vol. 4, no. December 2022, p. 100163, 2023,
[12] K. Gao, G. Mei, F. Piccialli, S. Cuomo, J. Tu, and Z. Huo, “Julia language in machine learning: Algorithms, applications, and open issues,” Comput. Sci. Rev., vol. 37, p. 100254, 2020,
[13] H. Yoshikawa, Design Methodology for Research and Development Strategy (Realizing a Sustainable Society), vol. 1, no. 5. 2012.
[14] P. R. Intan, “The Use of Laboratory Animals in Supporting The Development of The Medical World,” in Sinasis, 2020, vol. 1, no. 1, pp. 141-144.
[15] Ujwala Ashokrao Jadhao, Chatraguna Eknathrao Lagad, and Rajesh Kundlikrao Ingole, “Laboratory animal handling techniques, basic facilities and care: A review,” World J. Biol. Pharm. Heal. Sci., vol. 12, no. 3, pp. 170-182, 2022,
[16] F. Lydén, Handling methods of laboratory mice and rats Hanteringsmetoder av försöksmöss och råttor Uppsala 2016 Ethology and Animal Welfare-Bachelor’s programme, no. 657. 2016, pp. 1-28.
[17] A. S, P. K. Atul, K. R, N. Kumar, I. A. Mir, and P. Kumar, “Contribution of experimental animals in biomedical research,” Int. J. Vet. Sci. Anim. Husb., vol. 9, no. 1S, pp. 10-15, 2024,
[18] V. Reinhardt; and A. Reinhardt, Variables, refinement and environmental enrichment for rodents and rabbits kept in research institutions: making life easier for animals in laboratories. 2006.
[19] J. Hau and G. Van Hoosier, Handbook of laboratory animal science, second edition: Essential principles and practices, vol. 1. 2002.
[20] P. Mukherjee, S. Roy, D. Ghosh, and S. K. Nandi, “Role of animal models in biomedical research: a review,” Lab. Anim. Res., vol. 38, no. 1, pp. 1-17, 2022,
[21] K. M. Cholerisa, Elena, Galea, Liisa A. M., Sohrabji, Farida, and Frick, “Sex differences in the brain: Implications for behavioral and biomedical research,” Physiol. Behav., vol. 176, no. 3, pp. 139-148, 2017,
[22] T. C. Ngun, N. Ghahramani, F. J. Sánchez, S. Bocklandt, and E. Vilain, “The genetics of sex differences in brain and behavior,” Front. Neuroendocrinol., vol. 32, no. 2, pp. 227-246, 2011,
[23] C. H. Tsao, K. Y. Wu, N. C. Su, A. Edwards, and G. J. Huang, “The influence of sex difference on behavior and adult hippocampal neurogenesis in C57BL/6 mice,” Sci. Rep., vol. 13, no. 1, pp. 1-12, 2023,
[24] S. Lee et al., “Body weight changes of laboratory animals during transportation,” Asian-Australasian J. Anim. Sci., vol. 25, no. 2, pp. 286-290, 2012,
[25] O. V. Perepelkina, V. A. Golibrodo, I. G. Lilp, and I. I. Poletaeva, “Mice selected for large and small brain weight: The preservation of trait differences after the selection was discontinued,” Adv. Biosci. Biotechnol., vol. 04, no. 06, pp. 1-8, 2013,
[26] S. Jacob, A. B. Nair, and M. A. Morsy, “Dose Conversion Between Animals and Humans: A Practical Solution,” Indian J. Pharm. Educ. Res., vol. 56, no. 3, pp. 600-607, 2022,
[27] H. C. Ansel, Pharmaceutical Calculations, vol. 11, no. 1. 2019.
[28] D. Hickman, J. Johnson, T. Vemulapalli, J. Crisler, and R. Shepherd, Commonly Used Animal Models, vol. 8, no. 75. 2020,
[29] T. Kolbe, C. Lassnig, A. Poelzl, R. Palme, K. E. Auer, and T. Rülicke, “Effect of Different Ambient Temperatures on Reproductive Outcome and Stress Level of Lactating Females in Two Mouse Strains,” Animals, vol. 12, no. 16, 2022,
[30] B. Tanya, F. Charmaine, K. Eleanor, L. C. Garry, and M. S. Joanne, Health Evaluation of Experimental Laboratory Mice, vol. 23, no. 1. 2012,
[31] B. Knoop et al., “Cardioprotection by very mild hypothermia in mice,” Cardiovasc. Diagn. Ther., vol. 9, no. 1, pp. 64-67, 2019,
[32] F. C. Hankenson, J. O. Marx, C. J. Gordon, and J. M. David, “Effects of Rodent Thermoregulation on Animal Models in the Research Environment,” Comp. Med., vol. 68, no. 6, pp. 425-438, 2018,
[33] A. Fawcett, “Guidelines for the Housing of Mice in Scientific Institutions,” 2012.
[34] H. Khosravi, E. Khalilzadeh, and G. Vafaei Saiah, “Pain-induced aggression and changes in social behavior in mice,” Aggress. Behav., vol. 47, no. 1, pp. 89-98, 2021,
[35] Y. Chen, M. Niimi, L. Zhang, X. Tang, J. Lu, and J. Fan, “A Simple Telemetry Sensor System for Monitoring Body Temperature in Rabbits—A Brief Report,” Animals, vol. 13, no. 10, pp. 1-9, 2023,
[36] A. A. Hanson and R. C. Venette, “Thermocouple design for measuring temperatures of small insects,” Cryo-Letters, vol. 34, no. 3, pp. 261-266, 2013.
[37] H. X. Kou, Y. Q. Zhao, K. Ren, X. L. Chen, Y. Q. Lu, and D. Wang, “Automated measurement of cattle surface temperature and its correlation with rectal temperature,” PLoS One, vol. 12, no. 4, pp. 1-10, 2017,
[38] R. Arif, K. Santoso, and D. S. Wibawa, “Rats Development of Contactless Thermal Detector for Animal: Comparison of Three Sensor Types,” Proc. 2nd Int. Conf. Vet. Anim. Environ. Sci. (ICVAES 2020), vol. 12, no. Icvaes 2020, pp. 25-28, 2021,
[39] Z. Wang and X. Liu, “Design of Animal Detector Based on Thermal Imaging Sensor,” J. Phys. Conf. Ser., vol. 1550, no. 4, pp. 1-8, 2020,
[40] L. Anishchenko, A. Tataraidze, A. Bugaev, and V. Razevig, “Automated long-term contactless temperature monitoring in animals via a thermographic camera,” Proc. Annu. Int. Conf. IEEE Eng. Med. Biol. Soc. EMBS, pp. 1262-1265, 2017,
[41] G. R. Quintana and J. G. Pfaus, “Do Sex and Gender Have Separate Identities?,” Arch. Sex. Behav., vol. 53, no. 8, pp. 2957-2975, 2024,
[42] G. G. Dimijian, “Evolution of Sexuality: Biology and Behavior,” Baylor Univ. Med. Cent. Proc., vol. 18, no. 3, pp. 244-258, 2005,
[43] T. Subramoniam, “Mode of reproduction: Invertebrate animals,” Encycl. Reprod., no. October, pp. 32-40, 2018,
[44] V. Yadav, S. Sun, and J. Heitman, “On the evolution of variation in sexual reproduction through the prism of eukaryotic microbes,” Proc. Natl. Acad. Sci. U. S. A., vol. 120, no. 10, pp. 1-11, 2023,
[45] J. W. M. Arts, K. Kramer, S. S. Arndt, and F. Ohl, “Sex differences in physiological acclimatization after transfer in Wistar rats,” Animals, vol. 4, no. 4, pp. 693-711, 2014,
[46] X. Liu et al., “Male and female mice display consistent lifelong ability to address potential life-threatening cues using different post-threat coping strategies,” BMC Biol., vol. 20, no. 1, pp. 1-16, 2022,
[47] P. Y. Zeng, Y. H. Tsai, C. L. Lee, Y. K. Ma, and T. H. Kuo, “Minimal influence of estrous cycle on studies of female mouse behaviors,” Front. Mol. Neurosci., vol. 16, no. July, pp. 1-17, 2023,
[48] T. M. Reichard, C. H. Miller, J. Yang, and M. J. Sheehan, “Seasonality of the estrus cycle in laboratory mice under constant conditions,” 2024,
[49] V. Võikar, S. Kõks, E. Vasar, and H. Rauvala, “Strain and gender differences in the behavior of mouse lines commonly used in transgenic studies,” Physiol. Behav., vol. 72, no. 1-2, pp. 271-281, 2001,
[50] A. Dean and R. M. Sharpe, “Anogenital distance or digit length ratio as measures of fetal androgen exposure: Relationship to male reproductive development and its disorders,” J. Clin. Endocrinol. Metab., vol. 98, no. 6, pp. 2230-2238, 2013,
[51] C. L. Schwartz, S. Christiansen, A. M. Vinggaard, M. Axelstad, U. Hass, and T. Svingen, “Anogenital distance as a toxicological or clinical marker for fetal androgen action and risk for reproductive disorders,” Arch. Toxicol., vol. 93, no. 2, pp. 253-272, 2019,
[52] M. A. Suckow, S. A. Hashway, and K. R. Pritchett-Corning, The Laboratory Mouse, Third Edition, no. November. 2023,
[53] J. Frohlich, Rats and Mice, Fourth Edi. Elsevier, 2020,
[54] J. S. Bruce, F. Max, R. J. Esequiel, B. Sarah, and C. Gerald, “Sexual Differentiation in the Male and Female Mouse from Days 0 to 21: A Detailed and Novel Morphometric Description,” Neuron, vol. 61, no. 1, pp. 1-7, 2009,
[55] R. Singh, M. Gholipourmalekabadi, and S. H. Shafikhani, “Animal models for type 1 and type 2 diabetes: advantages and limitations,” Front. Endocrinol. (Lausanne)., vol. 15, no. February, pp. 1-17, 2024,
[56] US FDA, “Guidance for Industry and Other Stakeholders Toxicological Principles for the Safety Assessment of Food Ingredients,” Hum. Stud., vol. 3, no. July 2000, pp. 1-286, 2007.
[57] Y. J. Zhang, Z. Luo, Y. Sun, J. Liu, and Z. Chen, “From beasts to bytes: Revolutionizing zoological research with artificial intelligence,” Zool. Res., vol. 44, no. 6, pp. 1115-1131, 2023,
[58] M. Willi et al., “Identifying animal species in camera trap images using deep learning and citizen science,” Methods Ecol. Evol., vol. 10, no. 1, pp. 80-91, 2019,
[59] G. Kaul, J. McDevitt, J. Johnson, and A. Eban-Rothschild, “DAMM for the detection and tracking of multiple animals within complex social and environmental settings,” Sci. Rep., vol. 14, no. 1, pp. 1-16, 2024,
[60] G. Pang, C. Shen, L. Cao, and A. Van Den Hengel, “Deep Learning for Anomaly Detection: A Review,” ACM Comput. Surv., vol. 54, no. 2, 2021,
[61] O. Olorunshola, P. Jemitola, and A. Ademuwagun, “Comparative Study of Some Deep Learning Object Detection Algorithms: R-CNN, FAST R-CNN, FASTER R-CNN, SSD, and YOLO,” Nile J. Eng. Appl. Sci., no. 0, p. 1, 2023,
[62] P. Kumar, S. Luo, and K. Shaukat, “A Comprehensive Review of Deep Learning Approaches for Animal Detection on Video Data,” Int. J. Adv. Comput. Sci. Appl., vol. 14, no. 11, pp. 1420-1437, 2023,
[63] M. Fraiwan, “Efficient Convolutional Neural Network Model for the Taxonomy and Sex Identification of Three Phlebotomine Sandfly Species (Diptera, Psychodidae, and Phlebotominae),” Animals, vol. 14, no. 3712, pp. 1-17, 2024,
[64] E. M. K. de Silva et al., “Feasibility of using convolutional neural networks for individual-identification of wild Asian elephants,” Mamm. Biol., vol. 102, no. 3, pp. 909-919, 2022,
[65] W. Hao, C. Ren, M. Han, L. Zhang, F. Li, and Z. Liu, “Cattle Body Detection Based on YOLOv5-EMA for Precision Livestock Farming,” Animals, vol. 13, no. 22, pp. 1-28, 2023,
[66] C.-Y. Wang and K. L. James, “A Mouse Model of Diet-Induced Obesity and Insulin Resistance,” Methods Mol. Biol., vol. 821, no. 5, pp. 1-14, 2013,
[67] D. Djajasasmita, M. R. Hidayat, and S. Sambasri, “Design of Automation for Infusion Monitoring Using a Weight Sensor (Load Cell) Based on AT-MEGA 328 Microcontroller,” Int. J. Ind. Res. Appl. Eng., vol. 5, no. 1, pp. 14-18, 2021,
[68] C. Alberto Mandarim-de-Lacerda, M. del Sol, B. Vásquez, and M. Barbosa Aguila, “Mice as an Animal Model for the Study of Adipose Tissue and Obesity Ratones como Modelo Animal para el Estudio del Tejido Adiposo y la Obesidad,” Int. J. Morphol., vol. 39, no. 6, pp. 1521-1528, 2021,
[69] T. Kushartadi, M. A. Laagu, and M. Asvial, “Design and Implementation of The Smart Weighing Precision Livestock Monitoring Technology based on the Internet of Things (IoT),” Int. J. Adv. Sci. Eng. Inf. Technol., vol. 13, no. 4, pp. 1438-1448, 2023,
[70] A. Satrya, S. Styawati, I. Ismail, and S. Alim, “IoT-based implementation of rickshaws for real-time monitoring and measuring the weight of cattle,” J. Soft Comput. Explor., vol. 5, no. 1, pp. 26-31, 2024,
[71] F. M. Tangorra, E. Buoio, A. Calcante, A. Bassi, and A. Costa, “Internet of Things (IoT): Sensors Application in Dairy Cattle Farming,” Animals, vol. 14, no. 3071, pp. 1-24, 2024,
[72] S. Ulyanida, A. Supriyanto, S. W. Suciyati, and J. Junaidi, “Automatization of Weight and Height Measurement Using Ultrasonic Sensors HC-SR04 and Load Cell Based on Arduino UNO at Integrated Services Posts (Posyandu),” J. Energy, Mater. Instrum. Technol., vol. 3, no. 4, pp. 127-137, 2022,
[73] S. Inagaki, “Application of load cells in precision agricultural equipment,” World J. Agric. For. Sci., vol. 2, no. 1, 2024,
[74] K. P. Kartika Riyanti, I. Kakaravada, and A. A. Ahmed, “An Automatic Load Detector Design to Determine the Strength of Pedestrian Bridges Using Load Cell Sensor Based on Arduino,” Indones. J. Electron. Electromed. Eng. Med. Informatics, vol. 4, no. 1, pp. 15-22, 2022,
[75] M. Mihaila, P. Barsanescu, and C. Moraras, “Weigh-in-Motion Sensors and Traffic Monitoring Systems. State of the Art and Perspectives,” Bull. Polytech. Inst. Iași. Mach. Constr. Sect., vol. 68, no. 1, pp. 125-146, 2022,
[76] L. Galbusera, G. Theodoridis, and G. Giannopoulos, “Intelligent Energy Systems: Introducing Power-ICT Interdependency in Modeling and Control Design,” IEEE Trans. Ind. Electron., vol. 62, no. 4, pp. 2468-2477, 2015,
[77] T. Y. Ravi, P. Mehul, and S. Laskmisri, Phyton for beginners. 2021.
[78] J. Sigut, M. Castro, R. Arnay, and M. Sigut, “OpenCV Basics: A Mobile Application to Support the Teaching of Computer Vision Concepts,” IEEE Trans. Educ., vol. 63, no. 4, pp. 328-335, 2020,
[79] N. Aiman, A. Norizan, M. Razali, M. Tomari, W. Nurshazwani, and W. Zakaria, “Object Detection Using YOLO for Quadruped Robot Manipulation,” Evol. Electr. Electron. Eng., vol. 4, no. 1, pp. 329-336, 2023, [Online]. Available:
[80] K. Liu, H. Tang, S. He, Q. Yu, Y. Xiong, and N. Wang, “Performance Validation of Yolo Variants for Object Detection,” Proc. 2021 Int. Conf. Bioinforma. Intell. Comput. BIC 2021, pp. 239-243, 2021,
[81] M. Hussain, “YOLO-v1 to YOLO-v8, the Rise of YOLO and Its Complementary Nature toward Digital Manufacturing and Industrial Defect Detection,” Machines, vol. 11, no. 7, 2023,
[82] F. M. Talaat and H. ZainEldin, “An improved fire detection approach based on YOLO-v8 for smart cities,” Neural Comput. Appl., vol. 35, no. 28, pp. 20939-20954, 2023,
[83] S. Sathyanarayanan and B. R. Tantri, “Confusion Matrix-Based Performance Evaluation Metrics,” African J. Biol. Sci., vol. 27, no. December, pp. 1-10, 2024,
[84] S. Farhadpour, T. A. Warner, and A. E. Maxwell, “Selecting and Interpreting Multiclass Loss and Accuracy Assessment Metrics for Classifications with Class Imbalance: Guidance and Best Practices,” Remote Sens., vol. 16, no. 3, pp. 1-22, 2024,
Cite This Article
  • APA Style

    Mutiara, G. A., Periyadi, Alfarisi, M. R., Meisaroh, L. (2025). Intellimice Classifier: Towards Smart Object Detection and Classification of Laboratory Mice Using Multi-Sensor Integration. Journal of Electrical and Electronic Engineering, 13(1), 59-81. https://doi.org/10.11648/j.jeee.20251301.16

    Copy | Download

    ACS Style

    Mutiara, G. A.; Periyadi; Alfarisi, M. R.; Meisaroh, L. Intellimice Classifier: Towards Smart Object Detection and Classification of Laboratory Mice Using Multi-Sensor Integration. J. Electr. Electron. Eng. 2025, 13(1), 59-81. doi: 10.11648/j.jeee.20251301.16

    Copy | Download

    AMA Style

    Mutiara GA, Periyadi, Alfarisi MR, Meisaroh L. Intellimice Classifier: Towards Smart Object Detection and Classification of Laboratory Mice Using Multi-Sensor Integration. J Electr Electron Eng. 2025;13(1):59-81. doi: 10.11648/j.jeee.20251301.16

    Copy | Download

  • @article{10.11648/j.jeee.20251301.16,
      author = {Giva Andriana Mutiara and Periyadi and Muhammad Rizqy Alfarisi and Lisda Meisaroh},
      title = {Intellimice Classifier: Towards Smart Object Detection and Classification of Laboratory Mice Using Multi-Sensor Integration
    },
      journal = {Journal of Electrical and Electronic Engineering},
      volume = {13},
      number = {1},
      pages = {59-81},
      doi = {10.11648/j.jeee.20251301.16},
      url = {https://doi.org/10.11648/j.jeee.20251301.16},
      eprint = {https://article.sciencepublishinggroup.com/pdf/10.11648.j.jeee.20251301.16},
      abstract = {Laboratory mice (Mus musculus) play a crucial role in scientific research, where accurate classification and sorting are essential for ensuring reliable experimental results. This study presents an intelligent multi-sensor system for the automated classification and sorting of laboratory mice based on three key parameters: health status, gender, and weight. The system integrates thermal imaging cameras AMG8833 for monitoring the health status of mice, object detection algorithms (YOLOv8) for gender classification, and load cell HX711 sensors for weight measurement. The integration of these sensors leverages advanced sensor fusion techniques to improve classification accuracy and efficiency. Thermal imaging detects physiological anomalies to assess the health condition of the mice, while object detection algorithms identify gender characteristics in real-time with high precision. Additionally, load cell sensors provide accurate weight data for further categorization. The combined system eliminates the need for manual intervention, ensuring a non-invasive, efficient, and scalable approach to laboratory animal management. The proposed system performed evaluation through multiple test scenarios aimed at assessing the health of mice and classifying their weight. The detection of mice gender was evaluated using a dataset comprising over 6,722 images stored in the STASRG laboratory. The test results indicated that the accuracy of animal sorting across three parameters achieved a 100% success rate. The accuracy of gender sorting was 86.67%, while the accuracy of weight measurement exhibited a difference of approximately 0.1 gram. The overall response time for sorting was 19 seconds. This multi-sensor integration demonstrates the potential to enhance laboratory workflows, minimize human error, and promote the welfare of laboratory animals via automated, data-driven processes.
    },
     year = {2025}
    }
    

    Copy | Download

  • TY  - JOUR
    T1  - Intellimice Classifier: Towards Smart Object Detection and Classification of Laboratory Mice Using Multi-Sensor Integration
    
    AU  - Giva Andriana Mutiara
    AU  - Periyadi
    AU  - Muhammad Rizqy Alfarisi
    AU  - Lisda Meisaroh
    Y1  - 2025/02/27
    PY  - 2025
    N1  - https://doi.org/10.11648/j.jeee.20251301.16
    DO  - 10.11648/j.jeee.20251301.16
    T2  - Journal of Electrical and Electronic Engineering
    JF  - Journal of Electrical and Electronic Engineering
    JO  - Journal of Electrical and Electronic Engineering
    SP  - 59
    EP  - 81
    PB  - Science Publishing Group
    SN  - 2329-1605
    UR  - https://doi.org/10.11648/j.jeee.20251301.16
    AB  - Laboratory mice (Mus musculus) play a crucial role in scientific research, where accurate classification and sorting are essential for ensuring reliable experimental results. This study presents an intelligent multi-sensor system for the automated classification and sorting of laboratory mice based on three key parameters: health status, gender, and weight. The system integrates thermal imaging cameras AMG8833 for monitoring the health status of mice, object detection algorithms (YOLOv8) for gender classification, and load cell HX711 sensors for weight measurement. The integration of these sensors leverages advanced sensor fusion techniques to improve classification accuracy and efficiency. Thermal imaging detects physiological anomalies to assess the health condition of the mice, while object detection algorithms identify gender characteristics in real-time with high precision. Additionally, load cell sensors provide accurate weight data for further categorization. The combined system eliminates the need for manual intervention, ensuring a non-invasive, efficient, and scalable approach to laboratory animal management. The proposed system performed evaluation through multiple test scenarios aimed at assessing the health of mice and classifying their weight. The detection of mice gender was evaluated using a dataset comprising over 6,722 images stored in the STASRG laboratory. The test results indicated that the accuracy of animal sorting across three parameters achieved a 100% success rate. The accuracy of gender sorting was 86.67%, while the accuracy of weight measurement exhibited a difference of approximately 0.1 gram. The overall response time for sorting was 19 seconds. This multi-sensor integration demonstrates the potential to enhance laboratory workflows, minimize human error, and promote the welfare of laboratory animals via automated, data-driven processes.
    
    VL  - 13
    IS  - 1
    ER  - 

    Copy | Download

Author Information
  • Applied Science School, Telkom University, Bandung, Indonesia

    Biography: Giva Andriana Mutiara is an associate professor at Telkom University, Department of Applied Science. She completed her PhD in Information and Communication Technology (ICT) from Universiti Teknikal Malaysia Melaka (UTeM) in 2022, and her Master of Engineering in Computer Engineering from Bandung Institute of Technology in 2005. She has participated in several collaborative projects with various industries and received both internal and external grant funding in several research schemes of the Ministry of Research and Technology in recent years. Currently, she is head of Center of Excellence Smart Technology and Applied Science RG and focused her research on Smart Technology and IoT. She holds several intellectual property rights and patents. Her work is reflected in various publications indexed in reputable databases.

    Research Fields: Embedded System, Smart System, Internet of Things, Sensor Fusion, Wireless Sensor Network

  • Applied Science School, Telkom University, Bandung, Indonesia

    Biography: Periyadi is a lecturer in the Computer Engineering Department at Telkom University, specializing in networks, computer systems, and Cisco Academy certifications. He holds a master’s degree in information engineering from Langlangbuana University, Indonesia. With a strong focus on networking and system technologies, he has contributed significantly to research and education in these areas. His dedication to innovation is evident through his intellectual property rights and patents, which showcase his expertise in applied sciences. In addition to his academic and research activities, Periyadi is actively involved in Cisco Academy initiatives, equipping students with practical skills and industry-recognized certifications. His efforts in fostering professional development and advancing technology education have positioned him as a key figure in both academic and industry collaboration projects.

    Research Fields: Computer network, computer system, Smart system, internet of Things, network security

  • Applied Science School, Telkom University, Bandung, Indonesia

    Biography: Muhammad Rizqy Alfarisi Muhammad Rizqy Alfarisi is a Lecturer in the Computer Engineering Department at Telkom University. He earned both his Bachelor's and Master's degrees in Computer Engineering from the Bandung Institute of Technology, Indonesia. Currently, he serves as a researcher at the Center of Excellence for Smart Technology and Applied Science. He has actively participated in numerous collaborative research projects with various industries, securing both internal and external grant funding through diverse schemes. He holds several intellectual property rights and patents. His research contributions are evidenced by numerous publications indexed in reputable databases.

    Research Fields: Embedded system, Internet of Things, computer vision, machine learning, smart technology

  • Applied Science School, Telkom University, Bandung, Indonesia

    Biography: Lisda Meisaroh is a lecturer in the Computer Engineering Department at Telkom University, specializing mathematics, graph theory, numeric analytics, data analytics, and applied mathematics. She holds a master’s degree in Mathematics from Bandung Institute of Technology, Indonesia. With a strong focus on Applied Mathematics. She has contributed significantly to research in education and mathematics. She holds several intellectual property rights and patents. Her research contributions are evidenced by numerous publications indexed in reputable databases.

    Research Fields: Graph theory, mathematics, data analytics, applied mathematics, numeric analytics

  • Abstract
  • Keywords
  • Document Sections

    1. 1. Introduction
    2. 2. Material and Methodology
    3. 3. Results
    4. 4. Discussion
    5. 5. Conclusions
    Show Full Outline
  • Abbreviations
  • Acknowledgments
  • Author Contributions
  • Funding
  • Data Availability Statement
  • Conflicts of Interest
  • References
  • Cite This Article
  • Author Information