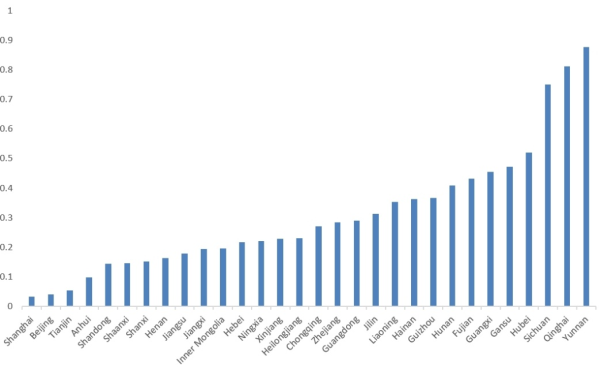
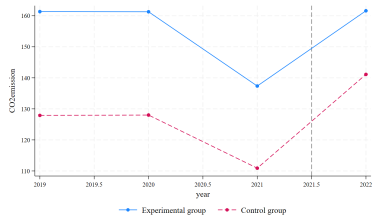
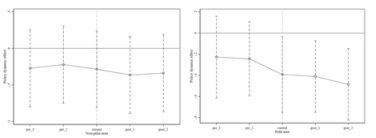
To address climate challenges, China implemented its National Emissions Trading System (ETS) in July 2021, initially targeting the power sector that accounts for 40% of national carbon emissions. While existing research has predominantly examined regional pilot programs, empirical evidence on the national market's initial effectiveness remains limited. This study fills this gap by analyzing provincial panel data (2019-2024) through a difference-in-differences (DID) approach to assess the ETS's nationwide emission reduction impact. Our methodology selects the six provinces with the lowest clean energy shares (Shanghai, Beijing, Tianjin, Anhui, Shandong, Shaanxi) as the treatment group, using others as controls, while employing a two-way fixed effects model to account for provincial and temporal heterogeneity - with rigorous verification of parallel trends via dynamic event studies and joint significance tests. Key findings reveal: (1) significant power sector emission reductions (average 0.252%) attributable to the national ETS, displaying dynamic "surge-then-adjustment" characteristics with an initial sharp decline followed by partial rebound; (2) heterogeneous impacts concentrated in carbon market pilot areas with negligible effects elsewhere, indicating path dependence in policy efficacy; and (3) economic development level and population size as core emission drivers. This research contributes novel insights by providing the first quantitative assessment of the national ETS's decarbonization impact on the power sector and validating the critical importance of prior pilot experience for policy effectiveness. The results highlight the need for differentiated policy reinforcement in non-pilot regions to achieve nationwide decarbonization goals.
| Published in | Social Sciences (Volume 14, Issue 4) |
| DOI | 10.11648/j.ss.20251404.24 |
| Page(s) | 433-439 |
| Creative Commons |
This is an Open Access article, distributed under the terms of the Creative Commons Attribution 4.0 International License (http://creativecommons.org/licenses/by/4.0/), which permits unrestricted use, distribution and reproduction in any medium or format, provided the original work is properly cited. |
| Copyright |
Copyright © The Author(s), 2025. Published by Science Publishing Group |
China Carbon Market, Power Sector Emissions, Emission Trading System, Difference-in-Differences, Pilot Policy Effectiveness
Year | Ha: diff < 0 | Ha: diff != 0 | Ha: diff > 0 |
|---|---|---|---|
2019 | P(T < t) =0.270 | P(|T| > |t|)=0.540 | P(T > t) =0.730 |
2020 | P(T < t) =0.271 | P(|T| > |t|)=0.542 | P(T > t) =0.729 |
2021 | P(T < t) =0.290 | P(|T| > |t|)=0.581 | P(T > t) =0.711 |
Test variables | F-value | Freedom | P-value |
|---|---|---|---|
First three phases of the policy | 0.63 | (3,29) | 0.6026 |
Variable | Obs | Mean | Std.Dev. | Min | Max |
|---|---|---|---|---|---|
CO2 Emission in Power Industry (Mt) | 180 | 139.317 | 118.764 | 1.987 | 536.828 |
GDP per capita (10K) | 180 | 8.141 | 3.645 | 3.299 | 20.782 |
Total Import and Export Value (100M) | 180 | 12664.15 | 18365.53 | 22.95521 | 83773.58 |
Year End Total Population (10K) | 180 | 4683.323 | 2962.119 | 590.44 | 12755.2 |
General Public Budget (100M) | 180 | 7328.667 | 3677.133 | 1427.89 | 18533.08 |
Science and Technology Expenditure (100M) | 180 | 225.883 | 243.1314 | 9.4513 | 1179.142 |
Variables | (1) Y | (2) Y | (3) Y | (4) |
|---|---|---|---|---|
ETS | -0.234** (0.12) | -0.246**(0.102) | -0.252** (0.11) | |
lnPGDP | 0.716** (0.306) | 0.965** (0.449) | 0.969** (0.452) | |
lnOPE | -0.283 (0.29) | -0.215 (0.246) | -0.218 (0.25) | |
lnPOP | 3.525** (1.532) | 4.072** (1.742) | 4.107** (1.769) | |
lnGIN | -0.406 (0.82) | -0.402 (0.825) | ||
lnTCH | -0.118 (0.154) | -0.117 (0.154) | ||
ETS_post1 | -0.220** (0.106) | |||
ETS_post2 | -0.274** (0.114) | |||
ETS_post3 | -0.261** (0.119) | |||
Constant | 4.568*** (0.01) | -23.459** (11.89) | -24.909*(12.39) | -25.217** (12.6) |
Individual effect | Y | Y | Y | Y |
Time effect | Y | Y | Y | Y |
Observations | 180 | 180 | 180 | 180 |
0.937 | 0.938 | 0.939 | 0.939 |
ETS | Emission Trading System |
DID | Differences-In-Differences |
| [1] | Jiao, J., Pan, Z., Li, J. Effect of carbon trading scheme and technological advancement on the decision-making of power battery closed-loop supply chain. Environmental Science and Pollution Research. 2023, 30, 14770-14791. |
| [2] | Luo, S., Zhang, H., Yuan, T. Study on the decarbonization in China's power sector under the background of carbon neutrality by 2060. Renewable and Sustainable Energy Reviews. 2022, 166, 112618. |
| [3] | Ellerman, A. D., Buchner, B. K. Over-allocation or abatement? A preliminary analysis of the EU ETS based on the 2005-06 emissions data. Environmental and Resource Economics. 2008, 41(2), 267-287. |
| [4] | Li, G., Niu, M. How does the carbon trading scheme promote the decarbonization of China's power sector? Journal of Environmental Planning and Management. 2024, 68(8), 1969-1996. |
| [5] | Yu, Z., Li, S., Wang, Q. Combining mandatory coal power phaseout and emissions trading in China's power sector. Energy Economics. 2023, 122, 106345. |
| [6] | Zhang, H., Liang, H., Zhang, D. Options to enhance China's national emission trading system design for carbon neutrality. Climate Policy. 2024, 25(2), 240-256. |
| [7] | Li, G., Wang, X., Chen, Y. The rebound effect of decarbonization in China's power sector under the carbon trading scheme. Energy Policy. 2023, 177, 113543. |
| [8] | Liu, J., Zhang, Y. Has carbon emissions trading system promoted non-fossil energy development in China? Applied Energy. 2021, 302, 117613. |
| [9] | Bertrand, M., Duflo, E., Mullainathan, S. How much should we trust differences-in-differences estimates? The Quarterly Journal of Economics. 2004, 119(1), 249-275. |
| [10] | Yu, M., He, M., Liu, F. Impact of Emissions Trading System on Renewable Energy Output. Procedia Computer Science. 2017, 122, 221-228. |
| [11] | Wang, Y., An, Q., Wang, R. The impact of carbon emissions trading policy on low-carbon economic development in China: an empirical analysis based on the environmental triple effect. Environment, Development and Sustainability. 2025. |
| [12] | Liu, Z., Ciais, P., Deng, Z. Near-real-time monitoring of global CO2 emissions reveals the effects of the COVID-19 pandemic. Nature Communications. 2020, 11, 5172. |
| [13] | Zhai, X., Chen, Z., Tan, C. Heterogeneity Analysis of Industrial Structure Upgrading on Eco-Environmental Quality from a Spatial Perspective: Evidence from 11 Coastal Provinces in China. Sustainability. 2023, 15(21), 15236. |
| [14] | Shan, Y., Liu, J., Liu, Z. China CO2 emission accounts 2016-2017. Scientific Data. 2020, 7, 54. |
| [15] | Callaway, B., Sant'Anna, P. H. C. Difference-in-Differences with multiple time periods. Journal of Econometrics. 2021, 225(2), 200-230. |
| [16] | Fowlie, M., Hollenberg, A., Spiller, E. What do emissions markets deliver and to whom? American Economic Review. 2012, 102(2), 965-993. |
| [17] | Tang, K., Zhou, Y., Liang, X. The effectiveness and heterogeneity of carbon emissions trading scheme in China. Environmental Science and Pollution Research. 2021, 28, 17306-17318. |
| [18] | Hao, H., Yang, X. China's Carbon Market in the Context of Carbon Neutrality: Legal and Policy Perspectives. Sustainability. 2022, 14(18), 11399. |
| [19] | Zhang, Z., Xiao, Y., Zhang, K. The impact of China pilot carbon market policy on electricity carbon emissions. Scientific Reports. 2025, 15, 16415. |
| [20] | Zhang, B., Niu, N., Li, H. Assessing the efforts of coal phaseout for carbon neutrality in China. Applied Energy. 2023, 352, 121924. |
APA Style
Lyu, C. (2025). China's Carbon Market Lowers Power Emissions Significantly in Pilot Areas But Not Elsewhere. Social Sciences, 14(4), 433-439. https://doi.org/10.11648/j.ss.20251404.24
ACS Style
Lyu, C. China's Carbon Market Lowers Power Emissions Significantly in Pilot Areas But Not Elsewhere. Soc. Sci. 2025, 14(4), 433-439. doi: 10.11648/j.ss.20251404.24
@article{10.11648/j.ss.20251404.24,
  author = {Chensheng Lyu},
  title = {China's Carbon Market Lowers Power Emissions Significantly in Pilot Areas But Not Elsewhere
},
  journal = {Social Sciences},
  volume = {14},
  number = {4},
  pages = {433-439},
  doi = {10.11648/j.ss.20251404.24},
  url = {https://doi.org/10.11648/j.ss.20251404.24},
  eprint = {https://article.sciencepublishinggroup.com/pdf/10.11648.j.ss.20251404.24},
  abstract = {To address climate challenges, China implemented its National Emissions Trading System (ETS) in July 2021, initially targeting the power sector that accounts for 40% of national carbon emissions. While existing research has predominantly examined regional pilot programs, empirical evidence on the national market's initial effectiveness remains limited. This study fills this gap by analyzing provincial panel data (2019-2024) through a difference-in-differences (DID) approach to assess the ETS's nationwide emission reduction impact. Our methodology selects the six provinces with the lowest clean energy shares (Shanghai, Beijing, Tianjin, Anhui, Shandong, Shaanxi) as the treatment group, using others as controls, while employing a two-way fixed effects model to account for provincial and temporal heterogeneity - with rigorous verification of parallel trends via dynamic event studies and joint significance tests. Key findings reveal: (1) significant power sector emission reductions (average 0.252%) attributable to the national ETS, displaying dynamic "surge-then-adjustment" characteristics with an initial sharp decline followed by partial rebound; (2) heterogeneous impacts concentrated in carbon market pilot areas with negligible effects elsewhere, indicating path dependence in policy efficacy; and (3) economic development level and population size as core emission drivers. This research contributes novel insights by providing the first quantitative assessment of the national ETS's decarbonization impact on the power sector and validating the critical importance of prior pilot experience for policy effectiveness. The results highlight the need for differentiated policy reinforcement in non-pilot regions to achieve nationwide decarbonization goals.},
 year = {2025}
}
TY  - JOUR
T1  - China's Carbon Market Lowers Power Emissions Significantly in Pilot Areas But Not Elsewhere

AU  - Chensheng Lyu
Y1  - 2025/08/08
PY  - 2025
N1  - https://doi.org/10.11648/j.ss.20251404.24
DO  - 10.11648/j.ss.20251404.24
T2  - Social Sciences
JF  - Social Sciences
JO  - Social Sciences
SP  - 433
EP  - 439
PB  - Science Publishing Group
SN  - 2326-988X
UR  - https://doi.org/10.11648/j.ss.20251404.24
AB  - To address climate challenges, China implemented its National Emissions Trading System (ETS) in July 2021, initially targeting the power sector that accounts for 40% of national carbon emissions. While existing research has predominantly examined regional pilot programs, empirical evidence on the national market's initial effectiveness remains limited. This study fills this gap by analyzing provincial panel data (2019-2024) through a difference-in-differences (DID) approach to assess the ETS's nationwide emission reduction impact. Our methodology selects the six provinces with the lowest clean energy shares (Shanghai, Beijing, Tianjin, Anhui, Shandong, Shaanxi) as the treatment group, using others as controls, while employing a two-way fixed effects model to account for provincial and temporal heterogeneity - with rigorous verification of parallel trends via dynamic event studies and joint significance tests. Key findings reveal: (1) significant power sector emission reductions (average 0.252%) attributable to the national ETS, displaying dynamic "surge-then-adjustment" characteristics with an initial sharp decline followed by partial rebound; (2) heterogeneous impacts concentrated in carbon market pilot areas with negligible effects elsewhere, indicating path dependence in policy efficacy; and (3) economic development level and population size as core emission drivers. This research contributes novel insights by providing the first quantitative assessment of the national ETS's decarbonization impact on the power sector and validating the critical importance of prior pilot experience for policy effectiveness. The results highlight the need for differentiated policy reinforcement in non-pilot regions to achieve nationwide decarbonization goals.
VL  - 14
IS  - 4
ER  -
School of Statistics, University of International Business and Economics, Beijing, China
Information