Research Article | | Peer-Reviewed

Comparative Analysis of Climate Change Trend and Change-point for Daily Rainfall Annual Maximum Time Series Data in Four Gauging Stations in South-East Nigeria

Published in Hydrology (Volume 13, Issue 1)
Received: 1 February 2025     Accepted: 17 February 2025     Published: 7 March 2025
Views:       Downloads:
Abstract

The aim of the study was to conduct a comparative analysis of climate change trends and change-point detection in long-term daily rainfall annual maximum series (AMS) data across four gauging stations in South-Eastern Nigeria: Abakaliki, Enugu, Owerri and Umuahia. Utilizing 31-year rainfall records (1992–2022) from the Nigerian Meteorological Agency (NIMET), the research employed the Indian Meteorological Department (IMD) method to downscale daily rainfall to sub-daily durations. Trend analysis utilizing Mann-Kendall test and Sen’s slope estimator revealed statistically significant increasing rainfall trends in Abakaliki (Z = 2.75, p < 0.01) and Umuahia (Z = 2.75, p < 0.01), with Sen’s slope magnitudes ranging from 0.35–2.28 mm/year and 0.14–0.90 mm/year, respectively. Conversely, Enugu and Owerri exhibited non-significant decreasing trends. Change-point analysis using distribution-free CUSUM and sequential Mann-Kendall (SQMK) tests identified a significant shift in rainfall patterns in Umuahia (2002–2003), while other stations showed no statistically meaningful change points. The spatial variability in trends underscores the influence of geographical proximity to the Atlantic Ocean and localized urbanization. These findings emphasize the necessity of region-specific climate adaptation strategies, particularly for infrastructure design in regions with intensifying rainfall. The study advocates integrating non-stationary approaches in hydrological modeling especially at Abakaliki and Umuahia to address evolving climate risks in those regions.

Published in Hydrology (Volume 13, Issue 1)
DOI 10.11648/j.hyd.20251301.18
Page(s) 73-82
Creative Commons

This is an Open Access article, distributed under the terms of the Creative Commons Attribution 4.0 International License (http://creativecommons.org/licenses/by/4.0/), which permits unrestricted use, distribution and reproduction in any medium or format, provided the original work is properly cited.

Copyright

Copyright © The Author(s), 2025. Published by Science Publishing Group

Keywords

Climate Change, Trend & Change-point, Annual Maximum Daily Rainfall, Sen’s Slope, Distribution-free CUSUM, Sequential Mann-Kendall, South-Eastern Nigeria

1. Introduction
One of the major environmental challenges faced in Nigeria is climate change, which exerts significant influences on water resources management and infrastructure development. Oguntunde et al. stated that the increasing intensity and frequency of extreme rainfall pose significant concern for flood control and urban planning. The South-Eastern region of Nigeria is susceptible to shifting precipitation patterns due to both its tropical climate and rapid urbanization. Identification of rainfall trend and quantifying the changes in rainfall requires rigorous statistical analyses of long-term precipitation data. Trend analysis and change-point detection are statistical tests used to help identify trends and points when significant change occur in the rainfall data (Ogunrinde et al., ; Sam et al., .
Previous studies have documented varying rainfall trends across different regions of Nigeria. Oguntunde et al. analyzed century-long rainfall records (1901-2000) and found significant decreasing trends in annual rainfall across most of the country. Oloruntade et al. worked on the Niger-South Basin from 1948-2008, and revealed both increasing & decreasing trends in different sub-regions. Sam et al. , Nwaogazie & Ologhadien , Sam et al. analyzed the trend and change point in the rainfall in four Niger Delta states. The result from their study revealed that there was statistically increasing trend in some of the Niger Delta state. However, relatively few studies have conducted detailed trend analyses specifically for South-Eastern Nigeria using recent data. One of the challenges of limited studies in the South-Eastern part of Nigeria might be attributed to limited data on long duration rainfall for that region. Another challenge of limited research in this region might be due to insufficient rainfall records at fine temporal resolutions that is rainfall record at shorter durations. While daily rainfall records may be available, sub-daily data needed for urban drainage design is often lacking. To overcome this challenge, The Indian Meteorological Department (IMD) method was utilized in this study for downscaling daily rainfall to shorter durations, enabling more comprehensive trend analyses across multiple temporal scales Sam et al., . This study aims to analyse trends and detect change points in long-term daily rainfall maximum series data from four gauging stations namely: Abakaliki, Enugu, Owerri and Umuahia in South-Eastern Nigeria. Interestingly, similar studies on evidence of climate change with respect to temperature in South East Romania, short term precipitation forecasting, a case of general regional modeling, climate change as empirical analysis: trend in rainfall and temperature in Nigeria and a book of reading on science of climate change are documented in literature, . The specific objectives are to: (1) evaluate the presence and significance of rainfall trends using the Mann-Kendall test and Sen's slope estimator, (2) identify potential change points using distribution-free CUSUM and sequential Mann-Kendall tests, and (3) compare results across the four stations to understand regional patterns.
2. Materials and Methods
2.1. Study Area
The study area comprises four major cities in South-Eastern Nigeria: Abakaliki, Enugu, Owerri and Umuahia (Figure 1). These cities lie within longitudes 5.5096°N - 6.5364°N and latitudes 7.0391°E - 8.1120°E. The region is bounded by the River Niger in the west and the riverine Niger Delta in the south. Abakaliki (6.3231°N, 8.1120°E) is the capital of Ebonyi State, Enugu (6.5364°N, 7.4356°E) is the capital of Enugu State, Owerri (5.5096°N, 7.0391°E) is the capital of Imo State and Umuahia (5.5250°N, 7.4922°E) is the capital of Abia State.
The region experiences a semi-hot equatorial climate characterized by heavy seasonal rainfall patterns Oguntunde et al., . The rainy season typically extends from March to October, while the dry season occurs from November to February with occasional rainfall. Rainfall intensity varies across the region, generally decreasing from south to north. Two primary air masses influence the climate: the moisture-laden South-Westerly wind from the Atlantic Ocean and the Harmattan-induced North-East Trade wind. The interaction of these air masses follows patterns similar to the Indian Monsoon wind system Ogunrinde et al., . This results in consistently high humidity and temperature levels throughout the year. The total area under study covers approximately 24,681 km² with a combined population of over 16 million based on the 2006 national census Oloruntade et al., . The region has experienced significant urbanization in recent decades, which may influence local rainfall patterns through changes in land use and increased surface runoff.
Figure 1. Map of Study Area.
2.2. Data Collection
Establishing trends in rainfall requires long historical data. A 31-year rainfall record starting from 1992 to 2022 was obtained from the Nigerian Meteorological Agency (NIMET) for Owerri. The data obtained was the 24-hour monthly rainfall record for the four South-Eastern state namely: Abakaliki, Enugu, Owerri and Umuahia. Smaller rainfall duration records were obtained by downscaling the 24-hour rainfall record utilizing Indian Meteorological Department (IMD) model which is given by Equation (1). The shorter duration record obtained included 5, 10, 20, 30, 60, 120, 360 and 720 minutes.
Rt=R24t2413(1)
Where Rt = Downscaled rainfall precipitation, R24 = daily rainfall precipitation (mm), t = time.
2.3. Statistical Test Methods
To identify trend in the rainfall record Mann Kendall was utlilized while Sen slope was used to quantify the magnitude of the trends. Two change points statistical test were utilized for change point detection in the rainfall data. Distribution-free cumulative sum (CUSUM) test and the Sequential Mann-Kendall (SQMK) test were the two statistical tests used for change point analysis.
2.3.1. Mann Kendall Test
Most trend analysis studies utilized either Linear regression or Mann Kendall for trend detection; because most rainfall data exhibit some sort of skewness, Mann Kendall which is a non-parametric test is normally utilized to detect trend in rainfall data. The Mann-Kendall (MK) test checks for monotonous trends in the time series data. The test is suitable for rainfall data that are not normally distributed. The Mann Kendall test establish the null hypothesis HO as there is no trend in the population from which the data are drawn while the alternative hypothesis H1 is that there is an increasing or decreasing monotonous trend. Prior to applying these Mann Kendall test, the rainfall data were checked for serial correlation using autocorrelation function (ACF) analysis. Existence of serial correlation especially at lag 1 requires that correction of the time series data be made before applying Mann Kendall test to the data. Failure to apply correction to the time series result in committing a Type I error which result in establishing a trend in the absence of no trend Cox & Stuart, . Yue et al. developed a correction for time series with serial correlation known as “Trend Free Pre-whitening (TFPW)”. Applying this correction is required before analysing the rainfall data for trend. Yue et al. gave details on how to manually apply TFPW to time series data but where the ACF is not significant MK test can be applied directly to the original data set. Mann Kendall test is performed using the formula (Equations (2-5)):
S=i=1n-1j=i+1nsigxj- xi(2)
sigxj- xi=+1 if xj- xi>0 0 if xj- xi=0-1 if xj- xi<0(3)
VS=118 n-12n+5- p=1qtqtq-12tq+5(4)
=S-1VS, If S>0S+1VS, If S<0(5)
Where: tq = number of ties for pth values; q = number of tied value; and Z = Standardized Mann Kendall statistic. A trend is detected in the time series data if the absolute standardized Mann Kendall statistic Z is greater than the critical z-score Z1-α/2 or if the p-value is less than the 5% level of significance. "Python statsmodel library-pymannkendall" was used for performing Mann Kendall and autocorrelation analyses.
2.3.2. Theil Sen’s Slope
The Sen's Slope Estimator (SSE) test was used to determine the magnitude and variation of the trend. The Sen’ slope is estimated using the formula in Equation (6) Sen, ; Theil, .
β=Medianxi- xjti- tj(6)
Where xi and xj are rainfall data values at time ti and tj (i > j) respectively.
2.3.3. Change Point Analysis
Trend changes and their onset are crucial in meteorological and time-series studies. For trend change-point analysis, two non-parametric tests were used: the cumulative sum (CUSUM) test McGilchrist & Woodyor and the sequential Mann-Kendall (SQMK) test, Sneyers . The CUSUM test employs a cumulative sum chart, while the SQMK test treats each sample sequentially in both forward and backward directions. The absolute maximum CUSUM value is the point where change point occurs. For SQMK, the point of intersection of the prograde series and the retrograde series indicates the trend change point, whereby, in the absence of a trend, the series intersects at several locations. CUSUM and SQMK were conducted using the open-source "trendchange" package, available via the CRAN repository Team ; Patakamuri.
3. Results
3.1. Mann-Kendall (MK) Trend Analysis
According to Mann and Kendall , Mann Kendall statistic test was used to establish the existence of trends in the rainfall data in the four South-Eastern state and the result is presented in Table 1. However, existence of autocorrelation at lag 1 tends to result in Type I error which leads to rejection of the null hypothesis. Rejection of the null hypothesis establish that there is a trend in the rainfall when actually no trend exists. Autocorrelation function was used to check for serial correlation at lag 1 and the results of the ACF for the four cities are presented in Figure 2. For Abakaliki, Enugu, Owerri and Umuahia the autocorrelation at lag 1 were within the confidence interval limit, indicating that no autocorrelation existence at Lag 1. The existence of no autocorrelation at lag 1 provide sufficient evidence that Mann Kendall can be used directly to check for trend in the rainfall data without the need for corrections.
The results of the Mann-Kendall test and Sen's Slope estimates for Abakaliki as shown in Table 1 indicate a significant increasing trend across all time intervals. The Z-values were consistently 2.7534, with p-values of 0.0059, all below the 0.05 significance level. The Sen's Slope (Qi) estimates indicated a positive trend, ranging from 0.3457 mm/year at 5 minutes to 2.2817 mm/year at 1440 minutes. Thus, there was a significant increasing trend in the rainfall precipitation in Abakaliki. For Enugu, the Z-values for all intervals were -1.2749 with p-values of 0.2023, indicating no significant trend at the 5% significance level (Critical Z-value = ±1.96). The Sen's Slope (Qi) estimates ranged from -0.0525 mm/year at 5 minutes to -0.3500 mm/year at 1440 minutes, suggesting a slight downward trend, although this was not statistically significant. Thus, there was no significant trend in the rainfall precipitation across all time intervals in Enugu.
For Owerri, the Z-values across all time intervals were -0.6799 with p-values of 0.4966, indicating no significant trend at the 5% significance level. The Sen's Slope (Qi) ranged from -0.0679 mm/year at 5 minutes to -0.4474 mm/year at 1440 minutes, showing a non-significant downward trend. Therefore, there was no significant trend in the rainfall precipitation for Owerri. The results for Umuahia using the Mann-Kendall test showed Z-values for all intervals were 2.7534 with p-values of 0.006, indicating significant trend at the 5% significance level. The Sen's Slope (Qi) estimates ranged from 0.1373 mm/year at 5 minutes to 0.9045 mm/year at 1440 minutes, showing an upward trend that was statistically significant.
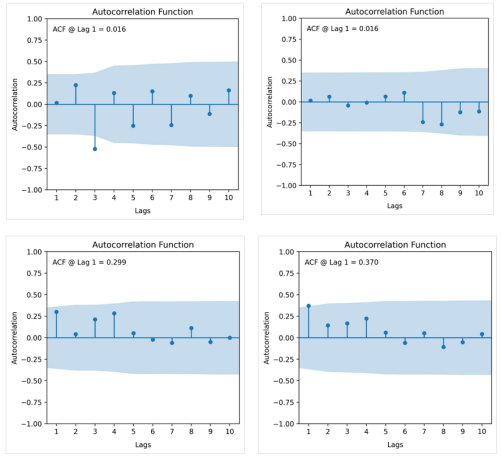
Figure 2. Rainfall precipitation correlogram of ACF for South-Eastern States.
Table 1. Mann-Kendall test and Sen’s Slope estimates result for the South-Eastern States.

Station

Duration

Z-Value

p-value

Qi (mm/yr)

Intercept

Trend

Status

Abakaliki

5mins

2.7534

0.0059

0.3457

5.0052

Increasing

Significant

20mins

2.7368

0.0062

0.5483

7.9561

Increasing

Significant

30mins

2.7534

0.0059

0.6278

9.1026

Increasing

Significant

60mins

2.7534

0.0059

0.7909

11.477

Increasing

Significant

360mins

2.7534

0.0059

1.4374

20.8491

Increasing

Significant

720mins

2.7534

0.0059

1.8109

26.267

Increasing

Significant

1440mins

2.7534

0.0059

2.2817

33.0939

Increasing

Significant

Enugu

5mins

-1.2749

0.2023

-0.0525

13.9175

Decreasing

Not Sig.

20mins

-1.2749

0.2023

-0.0825

22.0775

Decreasing

Not Sig.

30mins

-1.2749

0.2023

-0.095

25.285

Decreasing

Not Sig.

60mins

-1.2749

0.2023

-0.12

31.86

Decreasing

Not Sig.

360mins

-1.2749

0.2023

-0.22

57.92

Decreasing

Not Sig.

720mins

-1.2749

0.2023

-0.2775

72.9725

Decreasing

Not Sig.

1440mins

-1.2749

0.2023

-0.35

91.95

Decreasing

Not Sig.

Owerri

5mins

-0.6799

0.4966

-0.0679

18.4484

Decreasing

Not Sig.

20mins

-0.6799

0.4966

-0.1075

29.2825

Decreasing

Not Sig.

30mins

-0.6799

0.4966

-0.1232

33.5174

Decreasing

Not Sig.

60mins

-0.6799

0.4966

-0.1547

42.2211

Decreasing

Not Sig.

360mins

-0.6799

0.4966

-0.2816

76.7337

Decreasing

Not Sig.

720mins

-0.6799

0.4966

-0.3553

96.6789

Decreasing

Not Sig.

1440mins

-0.6799

0.4966

-0.4474

121.8105

Decreasing

Not Sig.

Umuahia

5mins

2.7534

0.006

0.1373

12.2209

Increasing

Significant

20mins

2.7534

0.006

0.2173

19.4109

Increasing

Significant

30mins

2.7534

0.006

0.2486

22.2205

Increasing

Significant

60mins

2.7534

0.006

0.3136

27.9855

Increasing

Significant

360mins

2.7534

0.006

0.5695

50.8668

Increasing

Significant

720mins

2.7534

0.006

0.7177

64.0841

Increasing

Significant

1440mins

2.7534

0.006

0.9045

80.7318

Increasing

Significant

3.2. Trend Change-Point Analysis
The results of the trend change analyses for the four cities using distribution free CUSUM are presented in Figure 3, and those of the Sequential Mann Kendall (SQMK) test are presented in Figure 4. The CUSUM and SQMK statistic results of the year of change point are presented in Table 2. Enugu has a maximum CUSUM value of 3 which was less than the critical value at 90, 95 and 99% confidence intervals as shown in Figure 3. The CUSUM change point year for Enugu was identified as 1998, but the change point was not statistically significant. The SQMK change point year for Enugu showed various years as indicated in Figure 4 with multiple interception of the prograde and retrograde at various locations. However, the first interception occurred in 1994, but due to the various interception of the prograde and retrograde, that year cannot be considered as the year when there was significant change in the trend in the rainfall. Owerri shows a maximum CUSUM value of 5 which was less than the critical values at the various confidence interval. The CUSUM change point year for Owerri was identified as 2013, also the change point was not significant. The SQMK change point year for Owerri was 2017, also it was observed that there were multiple interceptions of the prograde and retrograde signifying that the year 2017 cannot be considered as the year when there was a significant change in the rainfall in Owerri. Abakaliki has a maximum CUSUM value of 5, with change points detected in the years 2010 and 2012 but the change point was not significant. The SQMK change point year for Abakaliki was identified as 2010. The result showed that there was not so much disparity in the change point year obtained using CUSUM or SQMK. The small disparity in the change point year using the two methods might indicate that there might be a change in the rainfall around 2010, but the change was not strong enough to be statistically significant. Umuahia stands out with a maximum CUSUM value of 9, surpassing the critical values at all confidence levels, marking the year 2002 as a significant change point. The change point detected at Umuahia was significant. The result from the SQMK change point year for Umuahia showed that 2003 was the year that a statistically significant change point was observed. This point can be observed as the only interception of the prograde and retrograde in the SQMK plot as shown in Figure 4.
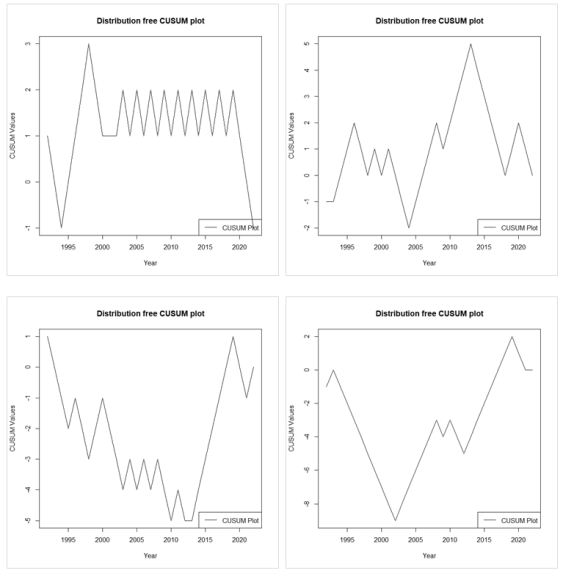
Figure 3. Distribution-free CUSUM plot for 24-hourly AMS rainfall intensity for the South-Eastern State.
Table 2. CUSUM and Sequential Mann Kendall Change Point.

Station

Change Point Test

Maximum CUSUM Value

CI @ 90%

CI @ 95%

CI @ 99%

Change Point Year

Remark

Abakaliki

CUSUM

5

6.7927

7.5722

9.0755

2010 & 2012

No significant change point

Sequential MK

-

-

-

-

2010

Enugu

CUSUM

3

6.7927

7.5722

9.0755

1998

No significant change point

Sequential MK

-

-

-

-

1994

Owerri

CUSUM

5

6.7927

7.5722

9.0755

2013

No significant change point

Sequential MK

-

-

-

-

2017

Umuahia

CUSUM

9

6.7927

7.5722

9.0755

2002

Significant change point

Sequential MK

-

-

-

-

2003

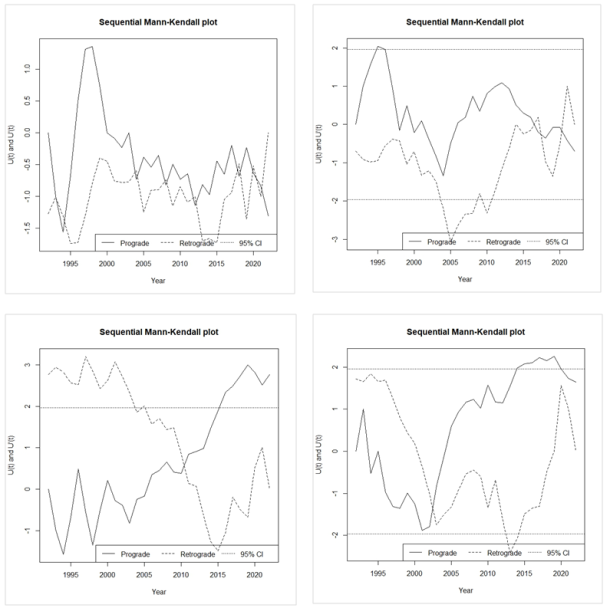
Figure 4. Sequential Mann-Kendall plot for 24-hourly AMS rainfall intensity for the South-Eastern State.
4. Discussion
The Mann-Kendall trend and Change point analysis revealed distinct rainfall patterns across the four South-Eastern Nigerian cities. Abakaliki and Umuahia demonstrated statistically significant increasing trends, while Enugu and Owerri showed mild decreasing trends, though not statistically significant. This spatial variation in rainfall trends aligns with findings from other regional studies, who have reported increasing trends in the rainfall precipitation across West Africa most especially in the last two decades .
For Abakaliki, the significant positive trend (Z = 2.7534, p = 0.0059) with Sen's slope ranging from 0.3457 mm/year at 5 minutes to 2.2817 mm/year at 1440 minutes indicates substantial intensification of rainfall patterns. Similarly, Umuahia exhibited a significant increasing trend (Z = 2.7534, p = 0.006) with Sen's slope from 0.1373 mm/year (5 minutes) to 0.9045 mm/year (1440 minutes). Abiodun et al. found evidence of changing rainfall patterns in Nigeria, with some regions experiencing intensification of extreme events. The non-significant decreasing trends observed in Enugu (Z = -1.2749, p = 0.2023) and Owerri (Z = -0.6799, p = 0.4966) suggest more stable rainfall patterns in these locations. This geographical variation in trends could be attributed to local factors such as urbanization, topography, and regional atmospheric circulation patterns, as noted by Ngene et al. in their study of South-Eastern Nigeria. For the present study, it was observed that states further away from the Atlantic Ocean which were Enugu and Owerri did not show significant trend in the rainfall while Abakaliki and Umuahia that were closer to the ocean showed significant trend in the rainfall. These findings suggest that geographical location and closeness to Atlantic Ocean might be a factor in the increasing trend in the rainfall in a particular location.
The varying trends across relatively close geographical locations highlight the complexity of rainfall patterns and the importance of local-scale analysis. Sam et al. stated the need for location-specific analysis in understanding rainfall patterns and their implications for water resource management. They also underscore the importance of incorporating non-stationary approaches in regions showing significant trends, as traditional stationary methods may underestimate the risk of extreme events. The observed trends have significant implications for urban planning and water resource management in these cities. The increasing trends in Abakaliki and Umuahia suggest a need for updated infrastructure design criteria to account for potentially more intense rainfall events, while the relatively stable patterns in Enugu and Owerri may require different management approaches. Among the recent investigations on incidence of flooding due to high rainfall intensity due to climate change, available in literature is one carried by Nwaogazie et al. . The study investigated the incidence of occasional flooding of an estate, a tank farm in Bonny Island, Niger Delta. Field investigation involved identification of 31 road side drains of rectangular cross-section; measurement of drains inverts (spot heights) at selected locations yielded estimates of very mild longitudinal slopes (0.000416-0.0074) m/m). The invert profiles of 15 road side drains indicated a case of inconsistent slopes, a mix of positive and negative slopes over short intervals. The observation accounts for siltation and ponding in the drains. These observations are predominant in old urban centres with inadequate drainage infrastructures experiencing increased rainfall intensities due to climate change. Conversely, a negative trend may signify a decrease in trend of rainfall and will call for effective water resource management, drought mitigation, socio-economic development, and sustainable agricultural planning attention .
5. Conclusion
This study analyzed long-term rainfall trends and change points in four South-Eastern Nigerian cities, revealing distinct spatial patterns. Abakaliki and Umuahia demonstrated significant increasing rainfall trends, likely influenced by their proximity to the Atlantic Ocean, which amplifies moisture influx. In contrast, Enugu and Owerri, situated farther inland, exhibited non-significant declines, suggesting stability in their rainfall regimes. The detection of a significant change point in Umuahia (2002–2003) aligns with regional observations of intensified extreme weather events in West Africa, while the absence of such shifts in other stations highlights localized climatic heterogeneity. The findings have critical implications for urban planning and water resource management. Cities with rising trends, such as Abakaliki and Umuahia require updated drainage infrastructure and flood mitigation strategies to accommodate heightened rainfall intensities. Conversely, stable regions like Enugu and Owerri may prioritize maintaining existing systems while monitoring long-term shifts.
Abbreviations

AMS

Annual Maximum Series

IMD

Indian Meteorological Department

NIMET

Nigerian Meteorological Agency

SQMK

Sequential Mann-Kendall

CUSUM

Cumulative Sum

ACF

Autocorrelation Function

TFPW

Trend Free Pre-whitening

Qi

Sen’s Slope

SSE

Sen’s Slope Estimator

Author Contributions
Chimeme Martin Ekwueme: Conceptualization, Investigation, Methodology, Validation, Writing-original draft
Ify Lawrence Nwaogazie: Conceptualization, Supervision, Validation, Writing-review & editing
Chiedozie Francis Ikebude: Conceptualization, Supervision, Validation, Writing-review & editing
Godwin Otunyo Amuchi: Funding acquisition, Writing-review & editing
Jonathan Onyekachi Irokwe: Funding acquisition, Writing-review & editing
Diaa Wissam El Hourani: Funding acquisition, Writing-review & editing
Conflicts of Interest
The authors declare no conflicts of interest.
References
[1] Oguntunde, P. G., Abiodun, B. J. and Lischeid, G. (2011). Rainfall trends in Nigeria, 1901–2000. Journal of Hydrology, 411(3-4), 207-218.
[2] Ogunrinde, A. T., Oguntunde, P. G., Akinwumiju, A. S. and Fasinmirin, J. T. (2019). Analysis of recent changes in rainfall and drought indices in Nigeria, 1981–2015. Hydrological Sciences Journal, 64(14), 1755-1768. Available at:
[3] Sam, M. G., Nwaogazie, I. L., & Ikebude, C. (2023a). Establishing Climatic Change on Rainfall Trend, Variation and Change Point Pattern in Benin City, Nigeria. International Journal of Environment and Climate Change, 13(5), 202-212.
[4] Oloruntade, A. J., Mohammad, T. A. and Aimrun, W. (2017). Rainfall trends in the Niger-South Basin, Nigeria, 1948–2008. Pertanika Journal of Science & Technology, 26(2), 479-496. Available at:
[5] Nwaogazie, I. L. and Ologhadien, I. (2014). Trend in Climate Change and Vulnerability Assessment of Nigerian Gulf of Guinea. Standard Scientific Research and Essays, 2, 516-523. Standard Scientific Research and Essays Vol 2(10): 516-523, Available at:
[6] Sam, M. G., Nwaogazie, I. L., Ikebude, C., Irokwe, J. O., El Hourani, D. W., Inyang, U. J., & Worlu, B. (2023). Comparative Analysis of Climatic Change Trend and Change-Point Analysis for Long-Term Daily Rainfall Annual Maximum Time Series Data in Four Gauging Stations in Niger Delta. Open Journal of Modern Hydrology, 13(4), 229-245.
[7] Sam, M. G., Nwaogazie, I. L. and Ikebude, C. (2021). Improving Indian Meteorological Department Method for 24-Hourly Rainfall Downscaling to Shorter Durations for IDF Modeling. International Journal of Hydrology, 5, 72-82.
[8] Bărbulescu, A. (2023). On the Regional Temperature Series Evolution in the South-Eastern Part of Romania. Applied Science, 13, Article 3904.
[9] Huang, M., Lin, Q., Pan, N., Fan, N., Jiang, T., He, Q. and Huang, L. (2019). Short-Term Precipitation Forecasting Rolling Update Correction Technology Based on Optimal Fusion Correction. Journal of Geoscience and Environment Protection, 7, 145-159.
[10] Amadi, S. O. and Udo, S. O. (2015). Climate change in contemporary Nigeria: An empirical analysis of trends, impacts, challenges and coping strategies. IOSR Journal of Applied Physics (IOSR-JAP) e-ISSN: 2278-4861. Volume 7, Issue 2 Ver. III, PP 01-09,
[11] IPCC (1996). In: Houghton, J. T., Meira Filho, L. G., Callander, B. A., Harris, N., Kattenberg, A., Maskell, K. (Eds.), Climate Change 1995: The Science of Climate Change. Cambridge University Press, Cambridge.
[12] Cox, D. R., & Stuart, A. (1955). Some quick sign tests for trend in location and dispersion. Biometrika, 42(1/2), 80-95.
[13] Yue, S., Pilon, P., Phinney, B. and Cavadias, G. (2002). The Influence of Autocorrelation on the Ability to Detect Trend in Hydrological Series. Hydrological Processes, 16, 1807-1829.
[14] Sen, P. K. (1968). Estimates of the Regression Coefficient Based on Kendall's Tau. Journal of the American Statistical Association, 63, 1379-1389.
[15] Theil, H. (1950). A rank-invariant method of linear and polynomial regression analysis. Indagationes mathematicae, 12(85), 173. Available at:
[16] McGilchrist, C. A. and Woodyer, K. D. (1975). Note on a Distribution-Free CUSUM Technique. Technometrics, 17, 321-325.
[17] Sneyers, R. (1990). On the Statistical Analysis of Series of Observations. World Meteorological Organization, Geneva.
[18] Team, R. C. (2020). RA language and environment for statistical computing, R Foundation for Statistical. Computing. Available at:
[19] Patakamuri, S. K., & Das, B. (2019). Trendchange: innovative trend analysis and time-series change point analysis. The R project for Statistical Computing: Vienna, Austria. Available at:
[20] Mann, H. B. (1945). Nonparametric Tests against Trend. Econometrica, 13, 245-259.
[21] Kendall, M. G. (1975). Rank Correlation Methods. Griffin, London.
[22] Sam, M. G., Nwaogazie, I. L. and Ikebude, C. (2022a). Non-Stationary Trend Change Point Pattern Using 24-Hourly Annual Maximum Series (AMS) Precipitation Data. Journal of Water Resources and Protection, 14, 592-609.
[23] Sam, M. G., Nwaogazie, I. L. and Ikebude, C. (2022b). Climate Change and Trend Analysis of 24-Hourly Annual Maximum Series Using Mann-Kendall and Sen Slope Methods for Rainfall IDF Modelling. International Journal of Environment and Climate Change, 12, 44-60.
[24] Sam, Masi G., Nwaogazie, Ify L., Ikebude, Chiedozie, Inyang, Ubong J. & Irokwe, Jonathan O. (2023b): Modeling Rainfall Intensity-Duration-Frequency (IDF) and Establishing Climate Change Existence in Uyo-Nigeria Using Non-Stationary Approach, Journal of Water Resource and Protection, 15, pp. 194-214, available at:
[25] Matemilola, S. (2019). Mainstreaming climate change into the EIA process in Nigeria: Perspectives from projects in the Niger Delta Region. Climate, 7(2), 29.
[26] Ebele, N. E. and Emodi, N. V. (2016). Climate Change and Its Impact in Nigerian Economy. Journal of Scientific Research and Reports, 10, 1-13.
[27] Abiodun, B. J., Lawal, K. A., Salami, A. T., & Abatan, A. A. (2013). Potential influences of global warming on future climate and extreme events in Nigeria. Regional Environmental Change, 13, 3, 477-491. Available at:
[28] Ngene, B. U., Tenebe, I. T., Emenike, P. C. and Airiofolo, R. I. 2015. Statistical Evaluation of Hydro-Meteorological Data: A case Study of Ishiagu in South-East Zone Nigeria. ARPN Journal of Engineering and Applied Sciences, Vol. 10, No. 18.
[29] Nwaogazie, Ify L., Uba, Levi O. and Dike, Charles C. (2015). Flooding Incidence and Drainage Network Analysis in Bonny Island, Nigeria. Emerging Issues in Science and Technology, Book Publisher International. Vol. 2. Available at:
[30] Animashaun, I. M., Oguntunde, P. G., Akinwumiju, A. S., & Olubanjo, O. O. (2020). Rainfall analysis over the Niger central hydrological area, Nigeria: Variability, trend, and change point detection. Scientific African, 8, e00419. Available at:
[31] Margaritidis, A. (2021). Site and Regional Trend Analysis of Precipitation in Central Macedonia, Greece. Computational Water, Energy, and Environmental Engineering, 10, 49-70.
Cite This Article
  • APA Style

    Ekwueme, C. M., Nwaogazie, I. L., Ikebude, C. F., Amuchi, G. O., Irokwe, J. O., et al. (2025). Comparative Analysis of Climate Change Trend and Change-point for Daily Rainfall Annual Maximum Time Series Data in Four Gauging Stations in South-East Nigeria. Hydrology, 13(1), 73-82. https://doi.org/10.11648/j.hyd.20251301.18

    Copy | Download

    ACS Style

    Ekwueme, C. M.; Nwaogazie, I. L.; Ikebude, C. F.; Amuchi, G. O.; Irokwe, J. O., et al. Comparative Analysis of Climate Change Trend and Change-point for Daily Rainfall Annual Maximum Time Series Data in Four Gauging Stations in South-East Nigeria. Hydrology. 2025, 13(1), 73-82. doi: 10.11648/j.hyd.20251301.18

    Copy | Download

    AMA Style

    Ekwueme CM, Nwaogazie IL, Ikebude CF, Amuchi GO, Irokwe JO, et al. Comparative Analysis of Climate Change Trend and Change-point for Daily Rainfall Annual Maximum Time Series Data in Four Gauging Stations in South-East Nigeria. Hydrology. 2025;13(1):73-82. doi: 10.11648/j.hyd.20251301.18

    Copy | Download

  • @article{10.11648/j.hyd.20251301.18,
      author = {Chimeme Martin Ekwueme and Ify Lawrence Nwaogazie and Chiedozie Francis Ikebude and Godwin Otunyo Amuchi and Jonathan Onyekachi Irokwe and Diaa Wissam El Hourani},
      title = {Comparative Analysis of Climate Change Trend and Change-point for Daily Rainfall Annual Maximum Time Series Data in Four Gauging Stations in South-East Nigeria
    },
      journal = {Hydrology},
      volume = {13},
      number = {1},
      pages = {73-82},
      doi = {10.11648/j.hyd.20251301.18},
      url = {https://doi.org/10.11648/j.hyd.20251301.18},
      eprint = {https://article.sciencepublishinggroup.com/pdf/10.11648.j.hyd.20251301.18},
      abstract = {The aim of the study was to conduct a comparative analysis of climate change trends and change-point detection in long-term daily rainfall annual maximum series (AMS) data across four gauging stations in South-Eastern Nigeria: Abakaliki, Enugu, Owerri and Umuahia. Utilizing 31-year rainfall records (1992–2022) from the Nigerian Meteorological Agency (NIMET), the research employed the Indian Meteorological Department (IMD) method to downscale daily rainfall to sub-daily durations. Trend analysis utilizing Mann-Kendall test and Sen’s slope estimator revealed statistically significant increasing rainfall trends in Abakaliki (Z = 2.75, p < 0.01) and Umuahia (Z = 2.75, p < 0.01), with Sen’s slope magnitudes ranging from 0.35–2.28 mm/year and 0.14–0.90 mm/year, respectively. Conversely, Enugu and Owerri exhibited non-significant decreasing trends. Change-point analysis using distribution-free CUSUM and sequential Mann-Kendall (SQMK) tests identified a significant shift in rainfall patterns in Umuahia (2002–2003), while other stations showed no statistically meaningful change points. The spatial variability in trends underscores the influence of geographical proximity to the Atlantic Ocean and localized urbanization. These findings emphasize the necessity of region-specific climate adaptation strategies, particularly for infrastructure design in regions with intensifying rainfall. The study advocates integrating non-stationary approaches in hydrological modeling especially at Abakaliki and Umuahia to address evolving climate risks in those regions.
    },
     year = {2025}
    }
    

    Copy | Download

  • TY  - JOUR
    T1  - Comparative Analysis of Climate Change Trend and Change-point for Daily Rainfall Annual Maximum Time Series Data in Four Gauging Stations in South-East Nigeria
    
    AU  - Chimeme Martin Ekwueme
    AU  - Ify Lawrence Nwaogazie
    AU  - Chiedozie Francis Ikebude
    AU  - Godwin Otunyo Amuchi
    AU  - Jonathan Onyekachi Irokwe
    AU  - Diaa Wissam El Hourani
    Y1  - 2025/03/07
    PY  - 2025
    N1  - https://doi.org/10.11648/j.hyd.20251301.18
    DO  - 10.11648/j.hyd.20251301.18
    T2  - Hydrology
    JF  - Hydrology
    JO  - Hydrology
    SP  - 73
    EP  - 82
    PB  - Science Publishing Group
    SN  - 2330-7617
    UR  - https://doi.org/10.11648/j.hyd.20251301.18
    AB  - The aim of the study was to conduct a comparative analysis of climate change trends and change-point detection in long-term daily rainfall annual maximum series (AMS) data across four gauging stations in South-Eastern Nigeria: Abakaliki, Enugu, Owerri and Umuahia. Utilizing 31-year rainfall records (1992–2022) from the Nigerian Meteorological Agency (NIMET), the research employed the Indian Meteorological Department (IMD) method to downscale daily rainfall to sub-daily durations. Trend analysis utilizing Mann-Kendall test and Sen’s slope estimator revealed statistically significant increasing rainfall trends in Abakaliki (Z = 2.75, p < 0.01) and Umuahia (Z = 2.75, p < 0.01), with Sen’s slope magnitudes ranging from 0.35–2.28 mm/year and 0.14–0.90 mm/year, respectively. Conversely, Enugu and Owerri exhibited non-significant decreasing trends. Change-point analysis using distribution-free CUSUM and sequential Mann-Kendall (SQMK) tests identified a significant shift in rainfall patterns in Umuahia (2002–2003), while other stations showed no statistically meaningful change points. The spatial variability in trends underscores the influence of geographical proximity to the Atlantic Ocean and localized urbanization. These findings emphasize the necessity of region-specific climate adaptation strategies, particularly for infrastructure design in regions with intensifying rainfall. The study advocates integrating non-stationary approaches in hydrological modeling especially at Abakaliki and Umuahia to address evolving climate risks in those regions.
    
    VL  - 13
    IS  - 1
    ER  - 

    Copy | Download

Author Information
  • Department of Civil and Environmental Engineering, University of Calabar, Calabar, Nigeria

    Research Fields: Hydrology, Hydraulics, Water Quality, Rainfall modelling, Water Resources

  • Department of Civil and Environmental Engineering, University of Port Harcourt, Port Harcourt, Nigeria

    Research Fields: Hydrology, Hydraulics, Water Quality, Water Resources, Wastewater Design, Finite Element Modeling, Data Analysis & Modeling

  • Department of Civil and Environmental Engineering, University of Port Harcourt, Port Harcourt, Nigeria

    Research Fields: Hydrology, Hydraulics, Water Quality, Rainfall modelling, Water Resources

  • Department of Civil and Environmental Engineering, University of Port Harcourt, Port Harcourt, Nigeria

    Research Fields: Hydrology, Hydraulics, Culvert & Drainage network Design, Rain-fall Runoff modelling, Highway Design

  • Department of Civil and Environmental Engineering, University of Port Harcourt, Port Harcourt, Nigeria

    Research Fields: Hydrology, Hydraulics, Culvert & Drainage network Design, Rain-fall Runoff modelling, Highway Design, Engineering Management

  • Centre for Geotechnical & Coastal Engineering Research, University of Port Harcourt, Port Harcourt, Nigeria

    Research Fields: Hydraulics, Coastal Protection, Geotechnical, Numerical Analysis & Modeling, Software Development & Engineering Application