1. Introduction
Nepal is south Asian landlocked nation featured by difficult topography, different climatic conditions, complex geological structures and regular seismic activities. Hilly and mountainous region cover about 87% of the total land area of Nepal and elevation varies from 59 m. in Terai in south to 8848 m in about 200 KM horizontal stretch
. This variation within a short distance makes country vulnerable to various water-induced natural disasters like landslides, slope failures, soil erosion, and debris flows
.
Nepal has been experiencing different types of natural hazard in recent years. Nepal ranks at 20
th position in multi hazard prone countries in the world
| [3] | B. N. Khanal, “Nepal: A brief country profile on Disaster Risk Reduction and Management,” 2020. |
[3]
. According to
| [4] | A. Baruwal, “Monographic issue Disaster profile of Nepal,” 2014. [Online]. Available: www.uniovi.net/uied |
[4]
, the nation also ranked at 4th, 11th, and 30th in terms of climate change, earthquakes, and flood risk respectively. Landslides, fires, droughts, epidemics, storms, hailstorms, avalanches, and Glacier Lake outburst floods are the recurrent natural incident frequently occurring in country. The number of natural calamities and number of deaths, injury, and economic loss is substantially escalating over the years
.
To address the ongoing water shortage in the Kathmandu Valley, the government launched the Melamchi Water Supply Project (MWSP) in 2000. The project aimed to transport 170 million liters of fresh water daily from the Melamchi River to the valley through a 26-kilometer-long tunnel. However, the project faced numerous challenges, including delays, corruption, poor management, lack of teamwork, and insufficient technical expertise
. After two decades of struggles and uncertainties, the project was finally inaugurated in April 2021. Unfortunately, just two and a half months later, in June 2021, severe flooding and debris flow damaged critical parts of the project, including the headworks, the nearly completed Ambathan tunnel, roads, and bridges. As a result, water supply to the Kathmandu Valley was disrupted for 503 days, from June 15, 2021, to December 8, 2022. Initial estimates by the project team revealed that the flooding caused damages amounting to approximately Rs 1.88 billion
-
9].
The first disaster on June 15 caused widespread destruction, claiming lives, destroying homes, and damaging critical infrastructure like the Melamchi Water Supply Project (MWSP), which provides drinking water to Kathmandu
| [9] | EU, GFDRR, and WBG, “Melamchi Flood Disaster in Nepal,” 2021. |
| [10] | B. P. Parajuli, P. Baskota, P. M. Singh, P. Sharma, Y. Shrestha, and R. P. Chettri, “Locally-led Assessment of Loss and,” 2023. |
| [11] | R. P. Chhetri, “Think globally in Glasgow, and act locally | Nepali Times.” Accessed: Mar. 22, 2025. [Online]. Available: https://nepalitimes.com/news/think-globally-in-glasgow-and-act-locally |
[9-11]
.
This research tries to fill the void by computing missing discharge and revenue loss by using machine learning.
2. Material and Methodology
The methodology section outlines the systematic approach adopted to analyze water discharge trends, forecast missing data, and estimate revenue losses for the Melamchi Water Supply Project (MWSP). The study integrates advanced machine learning techniques with robust statistical methods to ensure accurate and reliable results. Below, we detail the key steps of the methodology, including data preprocessing, outlier removal, model selection, hyperparameter configuration, and performance evaluation.
2.1. Sampling Design and Justification
The sampling design for this study was strategically developed to address the primary objective of evaluating the performance and operational challenges of the Melamchi Water Supply Project (MWSP), with a particular focus on quantifying revenue losses during non-functional phases caused by natural disasters such as floods. The dataset used in this study comprises daily water discharge records collected at the Sundarijal Treatment Plant, which serves as the outlet for the tunnel transporting water from the Melamchi River to Kathmandu Valley. This location was chosen because it provides a centralized and reliable source of data that directly reflects the volume of water delivered to the end users. The temporal coverage spans from March 2021 to June 2023, encompassing both functional and non-functional phases of MWSP, including the catastrophic floods of June 2021 that severely disrupted operations. By analyzing discharge data from this critical endpoint, we ensure that the findings accurately represent the actual water supply trends and enable precise estimation of revenue losses based on KUKL's minimum tariff rate. Furthermore, the granularity of the dataset allows for robust preprocessing and modeling using advanced machine learning techniques, such as Long Short-Term Memory (LSTM) models, to forecast missing discharge values and assess system performance. This sampling approach not only aligns with the research objectives but also ensures the reliability and relevance of the analysis, providing actionable insights for improving MWSP's resilience and sustainability.
2.2. Data Collection and Preprocessing
The dataset used in this study was obtained from the Sundarijal Treatment Plant, managed by Kathmandu Upatyaka Khanepani Limited (KUKL). It consists of daily water discharge records (in cubic meters) spanning from March 2021 to June 2023. These records were collected during both operational and non-functional phases of the Melamchi Water Supply Project (MWSP), including periods of disruption caused by natural disasters such as floods and infrastructure failures.
Raw datasets often contain anomalies or outliers that can distort analysis and forecasting accuracy. To ensure data reliability, a robust preprocessing step was implemented. Outliers were identified and removed using the Modified Z-Score method, a statistical technique that evaluates how far each data point deviates from the median in terms of the Median Absolute Deviation (MAD). A threshold of 3.5 was applied to flag and exclude outliers, ensuring the dataset remained representative while minimizing noise
| [12] | Bobbitt Zach, “What is a Modified Z-Score? (Definition & Example).” Accessed: Jul. 10, 2025. [Online]. Available: https://www.statology.org/modified-z-score/ |
| [13] | J. O. Ramsay, “D. Hoaglin, F. Mosteller, and J. W. Tukey (Eds.), Understanding Robust and Exploratory Data Analysis. New York: Wiley Interscience, 1983, pp. XVI + 447, $37.95.,” Psychometrika, vol. 49, no. 2, pp. 284-284, Jun. 1984, https://doi.org/10.1007/BF02294181 |
| [14] | J. Deng et al., “Operational low-flow forecasting using LSTMs,” Frontiers in Water, vol. 5, p. 1332678, Jan. 2023, https://doi.org/10.3389/FRWA.2023.1332678/BIBTEX |
[12-14]
. This approach is particularly effective for hydrological data, which often exhibits skewness and extreme values due to seasonal variations and unforeseen events like floods.
The preprocessing step not only improved the consistency of the dataset but also enhanced the model's ability to capture underlying trends. Care was taken to ensure that critical extreme events, such as flood-related disruptions, were not inadvertently excluded during outlier removal. The filtered dataset provided a more reliable foundation for further analysis, enabling accurate forecasting of missing water discharge values and supporting informed decision-making for sustainable water resource management.
Figure 2 illustrates the impact of outlier removal on the dataset, highlighting the transition from highly variable raw data to a more consistent and interpretable filtered dataset. This refined dataset serves as the basis for training and testing the LSTM model, ensuring robust performance and meaningful insights into MWSP's operational challenges.
2.3. Model Selection: Justification for LSTM
The choice of the Long Short-Term Memory (LSTM) model for forecasting water discharge was driven by its proven ability to handle complex, nonlinear, and sequential data patterns characteristic of hydrological systems. Unlike traditional statistical models such as ARIMA, which are limited to linear relationships and stationary data, LSTMs excel at capturing long-term dependencies and temporal dynamics in time-series data
. This capability is essential for modeling water discharge influenced by seasonal variations, operational disruptions, and extreme events like floods.
Several studies have demonstrated the effectiveness of LSTMs in hydrological forecasting. For instance,
successfully applied LSTM for operational low-flow forecasting, highlighting its ability to model intricate hydrological patterns with high accuracy. Similarly,
| [16] | K. M. R. Hunt, G. R. Matthews, F. Pappenberger, and C. Prudhomme, “Using a long short-term memory (LSTM) neural network to boost river streamflow forecasts over the western United States,” Hydrol Earth Syst Sci, vol. 26, no. 21, pp. 5449-5472, Nov. 2022, https://doi.org/10.5194/HESS-26-5449-2022 |
[16]
utilized LSTM to enhance river streamflow forecasts across the western United States, achieving superior performance compared to conventional methods.
| [17] | X. H. Le, H. V. Ho, G. Lee, and S. Jung, “Application of Long Short-Term Memory (LSTM) Neural Network for Flood Forecasting,” Water 2019, Vol. 11, Page 1387, vol. 11, no. 7, p. 1387, Jul. 2019, https://doi.org/10.3390/W11071387 |
[17]
also applied LSTM for flood forecasting, underscoring its robustness in handling abrupt changes caused by natural disasters.
Compared to alternative recurrent neural networks (RNNs) like Gated Recurrent Units (GRUs), LSTMs offer a more sophisticated architecture with memory cells and gating mechanisms that enable better retention of critical information over extended periods
. This capability is essential for accurately predicting water discharge trends in MWSP, where historical observations and external meteorological variables significantly influence future outcomes.
A comparative analysis of LSTM, ARIMA, and GRU highlights distinct advantages of LSTM for this application. While ARIMA is computationally efficient and suitable for short-term linear predictions, it struggles with nonlinearities and long-term dependencies inherent in hydrological data. GRUs, though similar to LSTMs in their ability to model sequential data, often underperform in scenarios requiring prolonged memory retention due to their simplified architecture. In contrast, LSTM’s ability to balance complexity and accuracy makes it the most appropriate model for capturing both short-term fluctuations and long-term trends in MWSP’s water discharge data
| [19] | P. T. Yamak, L. Yujian, and P. K. Gadosey, “A comparison between ARIMA, LSTM, and GRU for time series forecasting,” in ACM International Conference Proceeding Series, Association for Computing Machinery, Dec. 2019, pp. 49-55. https://doi.org/10.1145/3377713.3377722 |
| [20] | N. Saleem, M. Ali, and A. Mohammed, “The use of ARIMA, LSTM and GRU models in time series hybridization with practical application,” Int. J. Nonlinear Anal. Appl, vol. 14, pp. 2008-6822, 2023, https://doi.org/10.22075/ijnaa.2022.7110 |
[19, 20]
.
2.4. LSTM Model Configuration
To ensure the reliability and accuracy of the LSTM model, careful consideration was given to the selection of hyperparameters. The following configurations were implemented:
a) Number of Layers:
A single-layer LSTM was chosen based on computational constraints and the complexity of the dataset. While multi-layer LSTMs can capture more intricate patterns, they often require significantly more computational resources and are prone to overfitting when applied to smaller datasets. Literature such as
| [16] | K. M. R. Hunt, G. R. Matthews, F. Pappenberger, and C. Prudhomme, “Using a long short-term memory (LSTM) neural network to boost river streamflow forecasts over the western United States,” Hydrol Earth Syst Sci, vol. 26, no. 21, pp. 5449-5472, Nov. 2022, https://doi.org/10.5194/HESS-26-5449-2022 |
[16]
suggests that single-layer LSTMs are sufficient for many hydrological applications, provided the dataset is adequately preprocessed.
b) Number of Epochs and Early Stopping:
The model was trained for a maximum of 100 epochs, with early stopping implemented to prevent overfitting. Early stopping monitors the validation loss and halts training when no improvement is observed for 10 consecutive epochs. This approach ensures that the model generalizes well to unseen data while minimizing computational costs
.
c) Batch Size:
A batch size of 1 was selected based on trial-and-error experiments and recommendations from similar studies. Smaller batch sizes improve model convergence but increase training time, while larger batch sizes reduce training time but may lead to suboptimal solutions. A batch size of 1 strikes a balance between computational efficiency and model performance
| [17] | X. H. Le, H. V. Ho, G. Lee, and S. Jung, “Application of Long Short-Term Memory (LSTM) Neural Network for Flood Forecasting,” Water 2019, Vol. 11, Page 1387, vol. 11, no. 7, p. 1387, Jul. 2019, https://doi.org/10.3390/W11071387 |
[17]
.
d) Learning Rate and Optimization Algorithm:
The Adam optimizer was used with a default learning rate of 0.001, a widely adopted choice in deep learning due to its adaptive learning rate capabilities and robust performance across various tasks. The learning rate was fine-tuned using a grid search to ensure optimal convergence
| [21] | D. P. Kingma and J. L. Ba, “Adam: A Method for Stochastic Optimization,” 3rd International Conference on Learning Representations, ICLR 2015 - Conference Track Proceedings, Dec. 2014, Accessed: Jul. 10, 2025. [Online]. Available: https://arxiv.org/pdf/1412.6980 |
[21]
.
e) Activation Functions:
The activation function for the LSTM layers was set to tanh, which is the default choice for LSTMs due to its ability to handle vanishing gradient problems effectively. The output layer used a linear activation function to predict continuous water discharge values
| [22] | S. Adegoke, P. Olabisi, O. Adedokun, and A. Adegoke, “Use of LSTM & CNN AI Techniques for the Prediction of the Capacity of Heterogeneous Wireless Networks,” 2024. [Online]. Available: www.ijiset.com |
[22]
.
f) Hyperparameter Tuning:
Hyperparameter tuning was performed using a grid search to evaluate combinations of learning rates, batch sizes, and numbers of epochs. The combination that yielded the lowest validation error was selected for the final model
.
2.5. Performance Evaluation
The performance of the LSTM model was evaluated using two key metrics, Mean Absolute Percentage Error (MAPE) and the Coefficient of Determination (R²). These metrics provide insights into the accuracy and explanatory power of the model. The MAPE measures the average percentage deviation of predicted values from actual values, while R² quantifies the proportion of variance explained by the model
. These metrics provided insights into how well the model captured the underlying patterns in the data and the magnitude of errors in its predictions.
2.6. Revenue Loss Analysis
Once the missing water supply data was forecasted using the LSTM model, the reconstructed dataset was used to estimate the potential revenue loss caused by the disruption. For this calculation, we considered the minimum tariff rate set by KUKL for household connection through half inch pipe of NRs. 100 per 10000 Liters of water. Detailed tariff is as explained in following
Table 1 | [24] | KUKL, “Tariff Rate Final 2070,” 2013. |
[24]
.
Table 1. KUKL Tariff Rate 2013.
Connection Pipe Size | Minimum Water Consumed (Liter) | Minimum Tariff Rate NRs. | Rate for Additional Water above Minimum Water Consumed (per 1000 Liters) NRs. |
½ inch | 10000 | 100 | 32 |
¾ inch | 27000 | 1910 | 71 |
1 inch | 56000 | 3960 | 71 |
1.5 inch | 155000 | 10950 | 71 |
2 inches | 320000 | 22600 | 71 |
3 inches | 881000 | 62240 | 71 |
4 inches | 1810000 | 127865 | 71 |
3. Findings
3.1. Study of Water Supply Trend
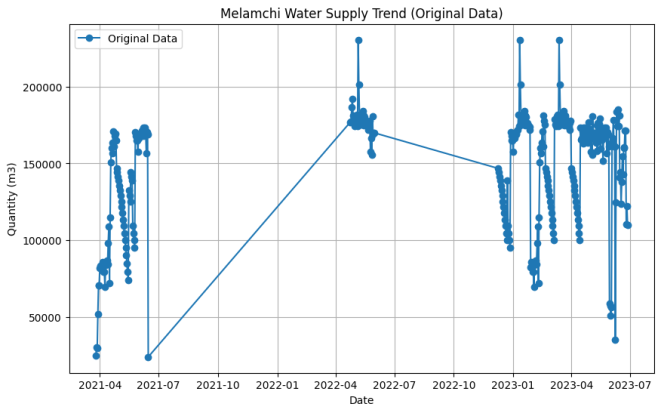
Figure 1. Original Water Supply Trend in Melamchi Water Supply as recorded in Sundarijal treatment Plant.
The
Figure 1 reveals the trend of water supply from the Melamchi Water Supply Project to the Sundarijal Treatment Plant, showing both periods of functionality and significant disruptions. The blue dots on the graph represent when water was successfully delivered, with the height of each dot indicating the volume of water supplied. These dots show that water flow initially surged in mid-2021. However, this was followed by a highly inconsistent trend, with frequent gaps where no water flowed at all—represented by the straight lines between the dots. These interruptions were largely caused by the devastating floods of June 2021, which severely damaged the Melamchi River infrastructure, including critical components like the headworks and tunnels. Over time, the trend shows a worrying decline in water supply. After the initial surge, the flow became erratic, with sharp drops and prolonged periods of no discharge. By late 2022 and into 2023, the water supply had dwindled significantly. This downward trend highlights the project's vulnerability to natural disasters like floods, as well as ongoing operational and maintenance challenges. The findings emphasize that while the project showed promise initially, its inability to maintain a consistent water supply has left Kathmandu facing continued water shortages.
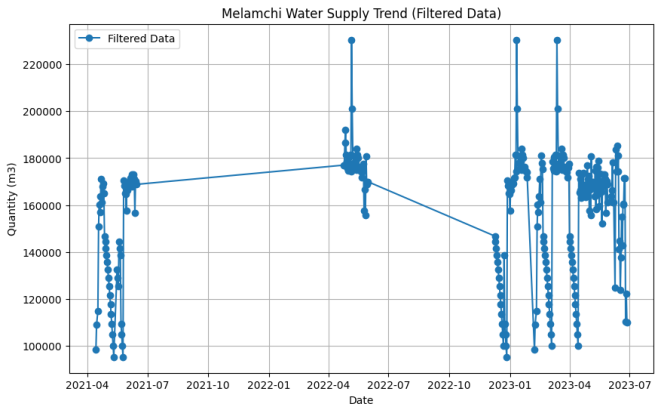
Figure 2. Filtered Data After Removing Outliers from the Original Data.
The analysis of water discharge data from the Melamchi Water Supply Project utilized the Modified Z-Score method to filter outliers and reveal underlying trends as shown in
Figure 2. The original dataset exhibited significant variability, with extreme values likely caused by operational disruptions, natural events like floods, or measurement errors. To address this, the Modified Z-Score, a robust statistical approach based on the median and Median Absolute Deviation (MAD) was applied to each data point. A threshold of 3.5 was used to identify and remove outliers, resulting in a filtered dataset that eliminated anomalies while retaining representative values. The filtered data demonstrated a more consistent trend, with a narrower range, reduced variability, and a median stabilized around 140,000 m
3. This process highlights the critical role of outlier removal in hydrological data analysis, enabling a clearer understanding of typical water supply patterns and supporting informed decision-making for sustainable water resource management.
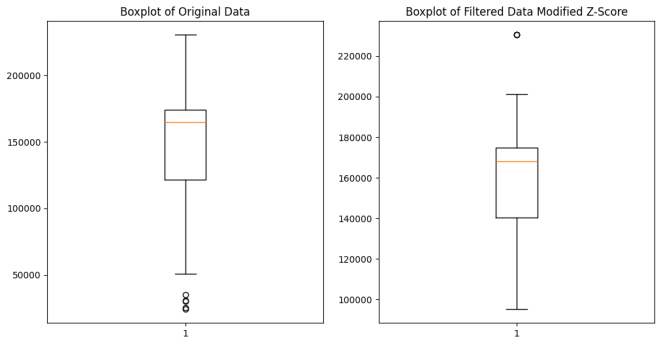
Figure 3. Boxplot of water discharge data before and after outlier removal using the Modified Z-Score method.
The
Figure 3 illustrates the water discharge trend from April 2021 to July 2023 after filtering outliers using the Modified Z-Score method, providing a more reliable dataset for analysis. The filtered data reveals an initial surge in discharge to over 200,000 m
3 by June 2021, likely due to seasonal rains or the system reaching full operational capacity, followed by significant fluctuations and a gradual decline to around 100,000-120,000 m
3 by mid-2023. By removing extreme values caused by anomalies such as floods or operational disruptions, the filtering process highlights underlying trends, including the project's struggles with consistency, potentially due to infrastructure damage from the 2021 floods. This refined dataset is critical for further analysis, as it serves as the foundation for predicting missing discharge values using LSTM method.
3.2. Summary of Water Supply in MWSP
Table 2. Status of Melamchi Water Supply.
S.N. | Start Date | End Date | Remarks |
1 | 26th March 2021 | 14th June 2021 | MWSP Functional Phase |
2 | 15th June 2021 | 23rd April 2022 | MSWP non-functional First Phase |
3 | 24th April 2022 | 31st May 2022 | MWSP functional Phase |
4 | 1st June 2022 | 8th December 2022 | MSWP non-functional Second Phase |
5 | 9th December 2022 | 27th June 2023 | MWSP functional Phase |
The
Table 2 outlines the functional and non-functional periods of the Melamchi Water Supply Project (MWSP) from March 2021 to June 2023, revealing a pattern of intermittent functionality. MWSP was operational for short periods, such as from March to June 2021, April to May 2022, and December 2022 to June 2023, with the longest continuous operation being the final stretch of six and a half months. However, these operational phases were interrupted by extended non-functional periods, including a 10-month shutdown from June 2021 to April 2022 following severe flooding that damaged critical infrastructure. The frequent alternations between operation and downtime highlight the project's vulnerability to natural disasters and technical challenges, emphasizing the need for improved disaster resilience and maintenance strategies to ensure consistent water supply to Kathmandu Valley.
3.3. Forecasting of Missing Data
The two
Figures 4 and 5 provide critical insights into the performance and limitations of the LSTM model in forecasting water discharge for the Melamchi Water Supply Project, while also highlighting the broader implications of using filtered data for such analyses.
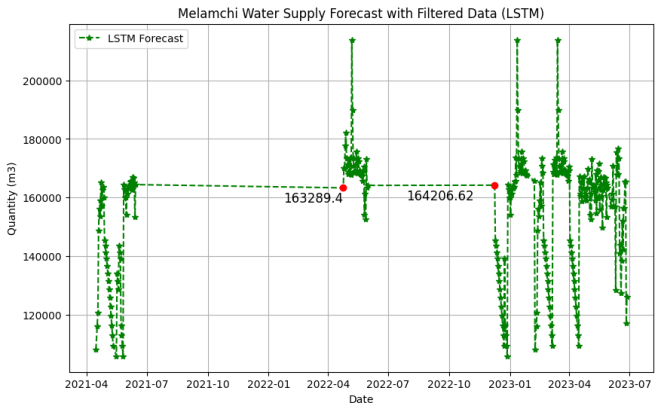
Figure 4. Forecasted water discharge values generated by the LSTM model based on filtered data.
Figure 4, presents the forecasted water discharge values generated by the model over the period from April 2021 to July 2023. The X-axis represents the timeline, while the Y-axis measures water discharge in cubic meters (m
3), ranging from approximately 100,000 m
3 to 200,000 m
3. The green dots represent the forecasted values, connected by dashed lines to illustrate trends, with a solid green line providing a smoothed representation of the overall forecast. Specific historical data points, marked with red circles, showed that the forecasted missing discharge, for the first phase of non-functionality of MWSP 163,289.4 m
3 was forecasted and 164,206.62 m
3 was forecasted in second phase of non-functionality of MWSP. The forecast captures fluctuations in water discharge, reflecting operational challenge caused by Melamchi flood of 2021. Despite these challenges, the model predicts both short-term fluctuations and long-term stabilization, indicating gradual improvements in the system’s resilience.
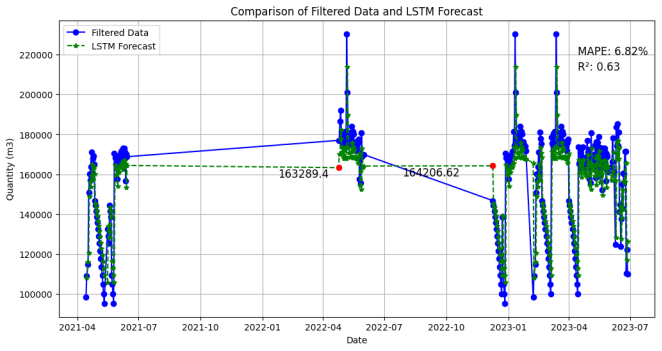
Figure 5. Comparison of filtered water discharge data (blue) and LSTM forecast (green). Performance metrics: MAPE = 6.82%, R² = 0.63.
Figure 5 provides a direct comparison between the filtered data and the LSTM forecast, offering a quantitative assessment of the model’s accuracy. The blue dots and line represent the filtered data, which smooths out extreme fluctuations by removing outliers, while the green dots and line depict the forecasted values. Two key performance metrics Mean Absolute Percentage Error (MAPE) is 6.82%, indicating that the forecast deviates from the actual values by an average of 6.82%, demonstrating high accuracy. The Coefficient of Determination (R²) is 0.63, suggesting that the model explains approximately 63% of the variance in the filtered data. While this indicates a strong correlation, it also highlights opportunities for further refinement to capture additional variability. Together, these figures underscore the LSTM model’s ability to handle complex, intermittent patterns in water discharge, making it a valuable tool for predicting future trends.
3.4. Revenue Loss in MWSP
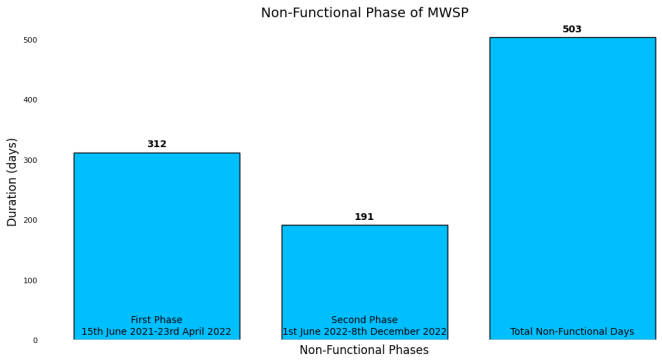
Figure 6. Non-Functional Phase of MWSP.
Figure 6 analyzing the non-functional phases of the MWSP reveals significant operational disruptions, with a cumulative total of 503 non-functional days over two years, from June 2021 to December 2022. The first phase, lasting 312 days from June 2021 to April 2022, was primarily attributed to the catastrophic floods of June 2021, which caused extensive damage to critical infrastructure such as headworks, tunnels, and approach roads
. The second phase, spanning 191 days from June 2022 to December 2022, highlights ongoing challenges, likely stemming from residual damage, inadequate maintenance, or emerging operational inefficiencies. These prolonged periods of non-functionality underscore the project's vulnerability to natural disasters and systemic issues, significantly impacting water supply reliability in Kathmandu Valley. The findings emphasize the urgent need for enhanced disaster resilience, proactive maintenance strategies, and robust contingency planning to mitigate the impact of future disruptions and ensure sustainable water resource management. Such measures are critical to reducing the frequency and duration of non-functional phases and improving the overall performance of the MWSP.
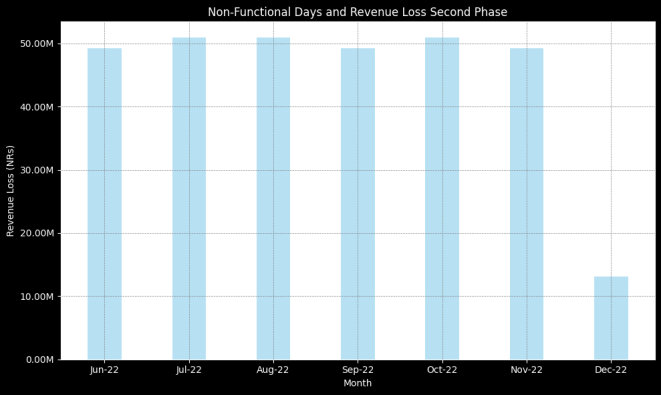
Figure 7. Revenue loss during the second non-functional phase (June 2022-December 2022).
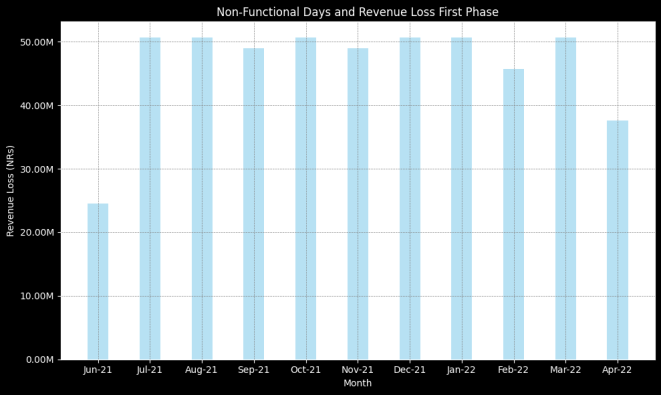
Figure 8. Revenue loss during the first non-functional phase (June 2021-April 2022).
The analysis of revenue loss for the Melamchi Water Supply Project (MWSP) during its non-functional phases reveals significant financial implications for Kathmandu Upatyaka Khanepani Limited (KUKL), calculated using the minimum tariff rate of NRs. 100 per 10,000 liters of water
| [26] | R. K. Phuyal, M. Bhattarai, N. Devkota, R. K. Phuyal, M. Bhattarai, and N. Devkota, “Dynamics of Financing, Governance and Socioeconomic Benefits of Melamchi Water Supply Project in Nepal: Lessons Learnt,” Modern Economy, vol. 11, no. 7, pp. 1359-1375, Jul. 2020, https://doi.org/10.4236/ME.2020.117097 |
[26]
. On a monthly basis as shown in
Figure 8, the losses ranged from NRs. 24,493,410 in June 2021 (15 non-functional days) to NRs. 50,619,714 in months with 31 non-functional days, such as July, August, and October 2021. The cumulative revenue loss over the first phase (June 2021 to April 2022) amounts to NRs. 509.46 million, representing the minimum estimated financial impact since the calculation is based on the lowest tariff rate. Critically, this figure likely underestimates the true economic burden, as it does not account for potential additional costs such as emergency water sourcing, groundwater extraction, or reputational damage due to service interruptions. Furthermore, the reliance on MWSP as a primary water source highlights KUKL’s vulnerability to systemic disruptions, which are exacerbated by natural disasters like the June 2021 floods. These prolonged non-functional phases not only strain KUKL’s financial stability but also hinder its ability to invest in infrastructure improvements or customer service enhancements, creating a ripple effect of inefficiency. The findings underscore the urgent need for KUKL to adopt a more resilient operational framework, including diversified water supply strategies, proactive maintenance, and contingency planning, to mitigate future revenue losses.
The second phase of non-functional of MWSP, spanning from June 2022 to December 2022, critically underscores the systemic vulnerabilities and financial strain imposed on Kathmandu Upatyaka Khanepani Limited (KUKL) due to prolonged operational disruptions. This phase is a direct aftermath of the catastrophic floods of June 2021, which severely damaged critical infrastructure, including headworks, tunnels, and approach roads. The data reveals that MWSP was non-functional for 30 or 31 days in most months from June to November 2022, leading to staggering monthly revenue losses ranging between NRs. 49.3 million and NRs. 50.9 million as shown in
Figure 7, calculated using the minimum tariff rate of NRs. 100 per 10,000 liters of water. These figures likely underestimate the true economic impact, as they exclude additional costs such as emergency water sourcing, groundwater extraction, or infrastructure repairs. The cumulative revenue loss for this period amounts to NRs. 313.6 million, highlighting the severe financial burden on KUKL and its inability to meet Kathmandu Valley’s water demands consistently. Critically, the persistence of high losses over six months reflects not only the lingering effects of the 2021 floods but also systemic inefficiencies, inadequate maintenance, and insufficient contingency planning. While December 2022 shows a sharp decline in non-functional days to just 8 days, resulting in a reduced revenue loss of NRs. 13.1 million, this improvement comes nearly 1.5 years after the initial disaster, raising concerns about the slow pace of recovery and the lack of proactive measures to mitigate such disruptions. This delay underscores the urgent need for enhanced disaster resilience, diversified water supply strategies, and robust infrastructure management to ensure sustainable water resource delivery. Furthermore, the reliance on MWSP as a primary water source exposes KUKL’s operational fragility, emphasizing the importance of investing in alternative water sources and redundancy systems to cushion against future shocks. Addressing these critical gaps is essential to safeguarding KUKL’s financial stability and ensuring reliable water supply for Kathmandu Valley, particularly in the face of increasing climate-induced risks and growing urban water demands.
4. Conclusion
In conclusion, this research critically analyzes the performance and operational challenges of the Melamchi Water Supply Project (MWSP), focusing on its non-functional phases, financial implications, and predictive modeling for water discharge. The findings reveal that MWSP experienced significant disruptions totaling 503 non-functional days across two phases, primarily due to the catastrophic floods of June 2021, which severely damaged critical infrastructure such as headworks, tunnels, and approach roads. These disruptions resulted in substantial revenue losses amounting to approximately NRs. 823.10 million, calculated using the minimum tariff rate of NRs. 100 per 10,000 liters of water, though the true economic impact is likely higher when accounting for additional costs like emergency water sourcing and reputational damage. The persistence of high monthly losses, ranging from NRs. 49.3 million to NRs. 50.9 million, underscores the severe financial strain on Kathmandu Upatyaka Khanepani Limited (KUKL) and highlights systemic inefficiencies, inadequate disaster preparedness, and insufficient contingency planning. The LSTM model demonstrated reasonable accuracy in forecasting water discharge trends, with a MAPE of 6.82% and an R² value of 0.63, but struggled to account for abrupt changes caused by natural disasters or operational failures, leaving nearly 37% of the variance unexplained. This limitation emphasizes the need for hybrid modeling approaches that integrate machine learning with domain-specific knowledge, external variables, and real-time monitoring. Critically, the study exposes MWSP’s vulnerability to climate-induced risks and operational disruptions, exacerbated by its reliance on a single water source and the slow recovery process spanning over 1.5 years. To address these challenges, stakeholders must adopt a multi-pronged approach, including strengthening disaster-resilient infrastructure, implementing proactive maintenance strategies, diversifying water supply sources, and advocating for policy reforms and increased funding. By addressing these gaps, stakeholders can enhance the resilience and reliability of MWSP, ensuring sustainable water supply for Kathmandu Valley amidst growing urbanization and escalating climate risks. This research not only sheds light on MWSP’s operational vulnerabilities but also provides actionable insights for building a more resilient and sustainable water management framework to meet the region’s growing demands.
Author Contributions
Kamal Katwal: Conceptualization, Methodology, Software, Validation, Visualization, Writing – original draft, Writing – review & editing
Bidur Kandel: Conceptualization, Data curation, Methodology, Writing – original draft, Writing – review & editing
Dinesh Sukamani: Methodology, Supervision, Writing – original draft, Writing – review & editing
Sudeep Thapa: Conceptualization, Methodology, Writing – original draft, Writing – review & editing