Research Article | | Peer-Reviewed

Spatial Distribution of Air Quality in Moulvibazar District Town, Bangladesh: A Wintertime Observation

Received: 30 September 2024     Accepted: 30 December 2024     Published: 27 February 2025
Views:       Downloads:
Abstract

Since air pollution in Bangladesh's urban areas is becoming more prevalent, most study has concentrated on major metropolitan cities, leaving smaller urban centers understudied. In order to address that gap, this study investigated the air quality in Moulvibazar, a district of Sylhet Division. This study aims to assess the concentrations of Particulate Matter (PM1, PM2.5 and PM10) and Carbon Monoxide (CO) across different land-use types in district town of Moulvibazar. Air quality monitoring was conducted at 60 locations using a portable Air Quality Monitor, Indoor Outdoor Formaldehyde (HCHO) Detector (Model: DM106) and a portable CO Meter (Model: AS8700A) to determine the parameters. Descriptive statistics and whisker box plots were also employed to analyze and visualize the variations in pollutant concentrations across different locations. Additionally, ArcGIS software (10.4.1. version) was used for spatial analysis, and a dendrogram plot was created to classify and interpret data clusters, providing a deeper understanding of the spatial distribution of pollutants. The Department of Environment (DoE) established Bangladesh National Ambient Air Quality Standard (NAAQS) for PM2.5, PM10, and carbon monoxide (CO) at 65 µg/m3, 150 µg/m3, and 9 ppm, respectively. Results indicated that the average concentrations of PM1, PM2.5 and PM10 across these locations were 93.47 µg/m3, 154.82 µg/m3, and 198.95 µg/m3, respectively. The most polluted location was Modal Thana (a commercial area) where PM1, PM2.5 and PM10 concentration were 154, 241.5 and 319.25 µg/m3, respectively. CO concentrations in the most polluted area were found to be 2.27 times higher than the NAAQS standards. Despite these findings, the variations in pollutant concentrations across different land-use types were statistically insignificant. Road intersections recorded the highest average PM2.5 concentration (168.30 µg/m3), whereas the lowest average data of PM2.5 found in industrial areas (149.25 µg/m3). The study finds worthwhile air quality issues in Moulvibazar, with pollutant levels exceeding the NAAQS. Urgent actions, such as pollution control and sustainable urban development, are required to address these concerns.

Published in Journal of Energy, Environmental & Chemical Engineering (Volume 10, Issue 1)
DOI 10.11648/j.jeece.20251001.12
Page(s) 12-25
Creative Commons

This is an Open Access article, distributed under the terms of the Creative Commons Attribution 4.0 International License (http://creativecommons.org/licenses/by/4.0/), which permits unrestricted use, distribution and reproduction in any medium or format, provided the original work is properly cited.

Copyright

Copyright © The Author(s), 2025. Published by Science Publishing Group

Keywords

Particulate Matter, Carbon Monoxide, Land Use, Moulvibazar District Town, Bangladesh

1. Introduction
Air pollution is marked as the largest environmental threat to public health worldwide which is linked to climate change because most major pollutants have common origins with greenhouse gases and have a negative effect on the climate . Nine out of ten people breathe air that is more polluted than the recommendations set by the World Health Organization, and air pollution claims the lives of about seven million people year worldwide where the bulk of these deaths occur mainly in low- and middle-income countries WHO refers air pollution as when any chemical, physical, or biological substance that modifies the basic characteristics of the atmosphere and contaminates its interior or exterior surroundings. Air pollutants can be categorized into criteria pollutants, air toxics and biological pollutants, where particulate matters (PM), carbon monoxide (CO), ozone, lead, nitrogen dioxide and sulfur dioxide are included in criteria pollutants . Air pollution from sources like household combustion, vehicles, industries, and forest fires includes harmful pollutants such as particulate matter, carbon monoxide, ozone, nitrogen dioxide, and sulfur dioxide, all of which can cause serious respiratory issues and other diseases, contributing significantly to illness and death rates
According to the U. S. Environmental Protection Agency (EPA) , PM are microscopic particles that are airborne and may be divided into two sizes: PM10, or particles less than 10 micrometers, and PM2.5, or particles smaller than 2.5 micrometers. Both PM2.5 and PM10 can be inhaled; however, PM2.5 has a higher probability of entering the lung and landing on its surface in the deeper areas, whereas PM10 has a higher probability of landing on the surfaces of the larger airways in the upper lung . Only a microscope can discern PM2.5 particles because they are so minuscule, smaller than dust, pollen, or even a single hair strand . According to the Air Quality Life Index (AQLI), particulate matter (PM2.5) is the foremost environmental threat to human health worldwide, and it is expected that pollution would cause a 2.3-year decline in the average life expectancy. PM2.5 poses a significant risk to human health due to its association with oxidative stress and inflammatory responses in the respiratory system and has also been connected to around 4 million deaths worldwide from cardiopulmonary disorders . However, CO is defined as a short-lived climate forcing agent that indirectly drives climate change by taking part in atmospheric chemical processes that result in the production of ozone, a climate change gas .
According to IQAir report 2023, Bangladesh ranked the number one polluted country where annual average of PM2.5 is 79.9 which is more than 15 times higher than the WHO PM2.5 annual guideline and Dhaka marked as the most polluted city. However, in Global Liveability Index for 2024, Bangladesh ranked 168 out of 173 countries . According to a research, in 2023 the average concentration of PM2.5 in Dhaka was 103.67 µg/m3, 2.96 times higher than the threshold of the national ambient air quality requirements . About 20% of all premature deaths in Bangladesh are attributed to air pollution . DoE marked brick kilns and vehicles as noteworthy sources of air pollution. Besides, unfit vehicles, industrial and construction activities are also prominent sources of air pollution in Dhaka . According to the research conducted from 2010-2019, in Dhaka, brick kilns are responsible for 58% of fine particles, cars for 10.4%, and dust for 15.3% . Another study conducted by Majumder et al. 2024 , identified unplanned urbanization, industrialization, heavy traffic, and biomass burning as key sources of air pollution which combined with meteorological factors like reduced rainfall, have led to a significant rise in PM2.5 levels, particularly during winter season.
In Bangladesh, air pollution is becoming a greater concern, especially in metropolitan areas. Smaller urban areas haven't received as much attention from researchers as larger metropolises. Moulvibazar and other smaller towns are becoming more urbanized, yet there isn't much information available about the quality of the air in these places. In order to comprehend the wider effects of urbanization on air quality and public health, it is imperative to monitor air pollution in such places. Therefore, the study aims to evaluate the concentration of carbon monoxide (CO) and particulate matters (PM1, PM2.5 and PM10) in various land-use types in Moulvibazar district town by means of monitoring at sixty places. By determining the concentration of pollutants in Moulvibazar, this study seeks to resolve this research gap and provide baseline data for further studies and policy-making.
2. Materials and Methods
2.1. Study Area
Moulvibazar District is located at a latitude of 24.4778°N and a longitude of 91.7667°E in the Sylhet Division of Bangladesh. From the study area, sixty locations were selected based on land use and subsequently categorized into seven categories according to their land use, which are sensitive (10 locations), mixed (11 locations), residential (10 locations), commercial (10 locations), road intersectional (5 locations), industrial (4 locations) and village areas (10 locations) showed on figure 1. The sensitive area consists of hospitals and clinics, schools, colleges, mosques, madrasas, temples, churches, administrative buildings and the mixed area includes markets, buildings, main roads etc.
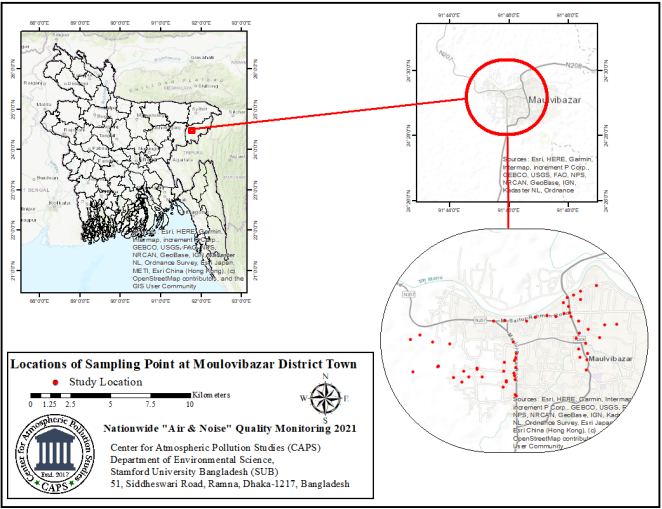
Figure 1. Study Area (Moulvibazar District Town and Data Collection Locations Point).
2.2. Research Method
The research was conducted following the flow diagram depicted in figure 2.
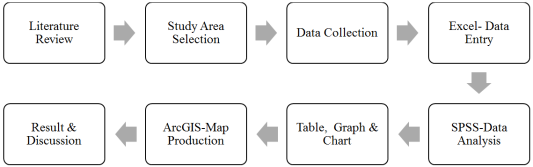
Figure 2. Flow diagram of research method.
2.3. Data Collection
Using a variety of automated portable tools, including a handheld carbon monoxide meter and an air quality monitor, the survey's air quality was monitored at several locations in the Moulvibazar region. An Android app called Garmin ETrex 10 also gathered GPS data. From each location, four distinct sets of data on PM1, PM2.5, PM10, and CO were gathered. Data was gathered from 60 distinct places throughout the day, from early in the morning until late at night. Details on the instrument are presented in Table 1.
Table 1. Instrument Description for Air Quality Monitoring (PM and CO).

SL.

Parameters

Instrument

Model

1.

PM1, PM2.5, PM10, HCHO, TVOC, AQI, Temperature, Humidity

Air Quality Monitor

Model: DM106; B07SCM4YN3 (Saiko)

2.

Carbon Monoxide (CO)

Handheld Carbon Monoxide Meter

AS8700A (Smart Sensor / OEM)

2.4. Data Analysis
Microsoft Excel 2020 and IBM SPSS V20 were used to analyze the data that was obtained. A conversion formula was utilized to convert the PM2.5 concentration to the Air Quality Index (AQI). The conversion formula is explained in detail below.
I=Ihigh-IlowChigh-ClowC-Clow+Ilow
Where, I = the (Air Quality) index; C = the pollutant concentration; C low = the concentration breakpoint that is ≤ C; C high = the concentration breakpoint that is ≥ C; I low = the index breakpoint corresponding to C low and I high = the index breakpoint corresponding to C high.
Besides, multiple graphs, tables, diagrams, and Box-Whisker plots were generated to understand the nature of the data. Descriptive statistics were performed to examine the dispersion of each parameter related to land use. Additionally, an Analysis of Variance (ANOVA) test was conducted to assess the statistical significance of the results. The findings are presented through various graphs and charts, providing a comprehensive overview of the data.
3. Results and Discussion
3.1. Concentration of PM1, PM2.5 and PM10 in Different Land Use
In case of sensitive areas, PM concentration exceeded at all places in reference to NAAQS. Among them, highest concentration of PM1, PM2.5 and PM10 found at Mosjiduna Nur Jama Mosque (115.25, 191 and 246 µg/m3) followed by Bodrunessa Private Hospital (114.75, 185 and 241.25 µg/m3) and DC Office (73.75, 125.50 and 160.25 µg/m3), and Circuit House (76.25, 124.25 and 161.5 µg/m3). The quantity of PM1, PM2.5 and PM10 at Study Care Academy (80.25, 130.25 and 169 µg/m3), Mustafapur Jame Mosjid (78.5, 134.25 and 170.75 µg/m3), Mustafapur Govt Primary School (86, 144.75 and 185 µg/m3), Zila Porishad (112.25, 182.25 and 237 µg/m3), Kashinath School and Collage (105.75, 178.50 and 228.25 µg/m3) and Pourashava Adrasha High School (81.25, 133.5 and 172.5 µg/m3) respectively are significant to show the overhead concentration level. Additionally, it has been observed that the highest concentration of PM2.5 and PM10 at Mosjiduna Nur Jama Mosque is about 2.93 and 1.6 times higher respectively than that the standard value. However, lowest concentration at DC office for PM2.5 and PM10 is also about 1.93 times higher. Among all the study locations, the extent of PM2.5 contaminations are almost visibly higher than PM10 contaminations. Consequently, the Moulvibazar district's sensitive zones have significantly elevated levels of PM pollution, which is considered "unhealthy" for individuals of all ages. Nevertheless, the study estimated that in all sensitive areas, 77.60% of PM2.5 is present in PM10 and 60.37% of the PM1 is present in PM2.5.
In case of mixed land use, it has been found that out of 11 different type areas MulviBazar has the extreme 144.25, 234.25 and 305 µg/m3 concentration for PM1, PM2.5 and PM10 respectively, while PM2.5 and PM10 concentrations are 3.60 and 2.03 times higher than that the NAAQS. After that, the Court Road and Old School Road areas are in the second (116.5, 185 and 243.25 µg/m3) and third (105.25, 171 and 222.5 µg/m3) position with reasonably higher PM1, PM2.5 and PM10 concentration. Conversely, The Pulse Diagnostic has the lowermost (56.65, 98.25 and 124.5 µg/m3) PM1, PM2.5 and PM10 concentration in the atmosphere. Notably among all the selected areas, three areas named Fahim Plaza (62.25, 104.25 and 133.5 µg/m3) followed by BTCL Jame Mosjid (65.25, 105.75 and 138 µg/m3) and Purbo Mustafapur (75.75, 135.67 and 140 µg/m3) are respectively less polluted. Particularly at Purbo Mustafapur, concentration PM2.5 and PM10 are identically nearby. However, it is noticeable that the concentrations of PM10 (124.5, 133.5, 138 and 140 µg/m3) are underneath only at the aforementioned four places with bottommost PM concentration and other 6 places named Diamond Plaza, Court Road, Sonali Bank, Central Road, Old School Road, and Poschim Bazar have upper concentration as 199.25 µg/m3, 243.25 µg/m3, 197.25 µg/m3, 192.25 µg/m3, 222.5 µg/m3 and 193.75 µg/m3 NAAQS. Furthermore, the study estimated that the concentration ratio of PM2.5 /PM10 is 80.37% and 59.98% of PM1 mass is in PM2.5.
In case of residential area, data have been collected from total 10 locations including Mustofapur Abashik, Babur Colony, Grizapara, East Girzapara, Forest Road, Kashinath Road, Soirpur Road, Soirpor Road Block B, Santibag and M. Saifur Rahman Road. It has been found that all of the locations showed exaggerated PM2.5 and PM10 concentration remarkably above the level of NAAQS. However, concentration of PM1, PM2.5 and PM10 concentration of Santibag have been found as lowermost with 76, 122 and 159.5 µg/m3. On the other side, Mustofapur Abashik has the highest PM1, PM2.5 and PM10 concentration with 96.75, 209 and 267 µg/m3 respectively. PM2.5 and PM10 concentration are 3.2 and about 2 times higher than NAAQS. Besides, East Girzapara, M. Saifur Rahman Road, Grizapara, Babur Colony, Forest Road, Soirpor Road Block B, Kashinath Road and Soirpur Road have also severe PM1, PM2.5 and PM10 concentration with (110, 185.50 and 237 µg/m3), (109.75, 180.25 and 233.5 µg/m3), (107.5, 173.75 and 226.5 µg/m3), (97.5, 154.50 and 208.67 µg/m3), (82.75, 136.25 and 176 µg/m3), (80.25, 136.50 and 174 µg/m3), (80.5, 133 and 171.25 µg/m3) and (80.75, 131.50 and 170.75 µg/m3) correspondingly while PM2.5 is pointedly 2.8, 2.7, 2.6, 2.3, 2, 2.1, 2, and 2 times higher as well than BNAAQS. Moreover, existing study estimates 77.15% of PM2.5 was present in PM10 and 59.52% of PM1 was present in PM2.5 at residential area.
It has been found that, Kusumbag Point is the mostly polluted place among the road intersection area, with 119.5, 196.25 and 254 µg/m3 PM1, PM2.5 and PM10 concentration correspondingly. On the other side, Candi Gat Road is the lowest (86 µg/m3) PM1, (140.50 µg/m3) PM2.5 and (182.25 µg/m3) PM10 concentration whereas all the PM values are above than the standard air quality for Bangladesh. It is visible from the figure, concentration of PM1, PM2.5 and PM10 at Kudrat Ullah Road (114.25, 187.25 and 242.5 µg/m3) followed by Chomohoni Road (98, 166.25 and 212.25 µg/m3) are close to the maximum PM value, besides Court Road (88, 151.25 and 189.5 µg/m3) have near to lowest PM value. Concentration of PM2.5 are 2.5, 2.3, 2.8 and 3 times higher without only Candi Gat Road (140.50 µg/m3), and PM10 at all connection points are extravagant than NAAQS. However, 77.94% of PM2.5 was present in PM10 and 60.04% of the PM1 was present in PM2.5.
It has been found that PM10 concentration was higher than the NAAQS at all locations of commercial area without Bengal Convention Hall with 138 µg/m3. However, Modal Thana area showed highest PM1, PM2.5 and PM10 concentration with 154, 241.5 and 319.25 µg/m3respectively where PM2.5 and PM10 are 3.7 and 2.1 times higher than NAAQS. Besides, high concentration of PM1, PM2.5 and PM10 at Moustafa Pur Road (126.25, 203 and 265.25 µg/m3) were followed by Dhaka Bus Stand (96.5, 157.25 and 204 µg/m3) and Nodir Par (95.25, 154.5 and 200 µg/m3). However, as commercial area, Bengal Convention Hall had the lowermost concentration of PM1 (67.33 µg/m3), PM2.5 (106.25 µg/m3) and PM10 (138 µg/m3) followed by Shrimonggol Road with the second lowermost concentration of PM1 (78.25 µg/m3), PM2.5 (123.50 µg/m3) and PM10 (162.75 µg/m3). It is also noted that, at Mosque Market, Kacha Bazar, Krishi Market, M Saifur Rahaman Road, Nodir Par, Moustafa Pur Road, Shrimonggol Road and Dhaka Bus Stand areas PM2.5 concentrations were 2.1, 2.1, 2.2, 1.9, 2.3, 3.1, 1.9 and 2.4 times higher respectively. Therefore, PM data demonstrated that commercial area’s air quality was significantly in ‘Unhealthy’ condition where 77.06% of PM2.5 existed in PM10 and 61.54% of PM1 presented in PM2.5.
Among the industrial areas, Ali Furniture (128.75, 210 and 272.5 µg/m3) are highly PM1, PM2.5 and PM10 concentrated area. Whereas, Bengal Food industrial area has the least PM1, PM2.5 and PM10 (33.75, 54.25 and 70.75 µg/m3) concentration in air. Moreover, PM10 concentrations at Nasir Saw Mill and Bengal Food Industry with 148.25 µg/m3 and 140 µg/m3 which are in nearly satisfactory level at all and underneath the standard level. Despite the fact, it can be noted that concentrations of PM10 at Ali Furniture and Samsu Food are above (1.81 and 1.4 times added) than NAAQS. Therefore, in case of all industrial areas, 77.66% of PM2.5 was present in PM10 and 60.24% of the PM1 was present in PM2.5.
However, it has been found that out of 10 village areas, six are moderate to highly concentrated with PM. The locations with PM (PM1, PM2.5 and PM10 respectively) concentration were, Islambag (118.75, 198.25 and 256.25 µg/m3), Islampur (103.25, 169.5 and 219.5 µg/m3), Dorkapur (109, 174.25 and 216.67 µg/m3), Khidur (93.25, 155.25 and 199.5 µg/m3), Khidur (87.5, 140.75 and 179 µg/m3), Poschim Khidur (85.75, 143 and 183.75 µg/m3), Poschim Mustofapur (82.5, 134.25 and 173 µg/m3), Khidur (82.75, 131.75 and 175 µg/m3), Khidu (81.25, 132.5 and 171.75 µg/m3), Mustafapur (82.75, 142.25 and 180.25 µg/m3. Among them, Islambag and Khidu as village showed the hieghest and lowest PM concentration. Besides, concentrations of PM2.5 at all sites are above the NAAQS and about 3, 2.6, 2.6, 2.3, 2.1, 2.2, 2, 2, 2 and 2.1 times further according to the aforementioned sequence. While PM10 concentrations are also higher than the standards, but PM10 contamination is comparatively less than PM2.5. Contemporary study analysis and data estimated that, 77.82% PM2.5 was present in PM10 and 60.93% PM1 was present in PM2.5 at all locations of village area. Therefore, the concentration of PM1, PM2.5 and PM10 in 7 different land use are shown in Figure 3 (a), (b), (c), (d), (e), (f) and (g).
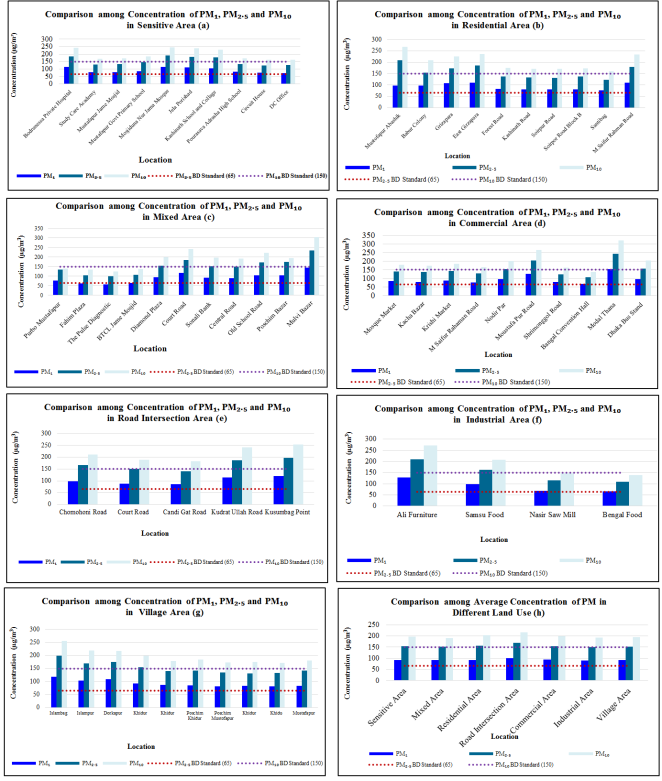
Figure 3. Concentration of PM1, PM2.5 and PM10 in differ ent land use.
In Moulvibazar District, areas are categories into sensitive, mixed, residential, road intersection, commercial, industrial and village to make a comparative analysis of the average PM1, PM2.5 and PM10 concentration (µg/m3) in the atmosphere. It is usually an expectation that air pollutants will be higher in urban and industrial areas than in village areas. But the figure shows that all categories have high average PM concentrations and village has 24 hours average higher concentration (92.68, 152.18 and 195.47 µg/m3) than industrial (90.13, 149.25 and 192.38 µg/m3) and mixed (91.27, 151.58 and 189.93 µg/m3) areas and where mixed area has the lowest concentration of PM1, PM2.5 and PM10 among seven land use. Apart from this, sensitive area (90.13, 149.25 and 192.38 µg/m3) shows relatively alike PM concentration with commercial area (90.13, 149.25 and 192.38 µg/m3) and residential place (92.18, 156.23 and 202.42 µg/m3) as well. On the other hand, average PM1, PM2.5 and PM10 concentration at road intersections is maximum (101.15, 168.30 and 216.10 µg/m3) among the all locations. Nevertheless, from the average comparative analysis it can be said that in every area PM10 concentration is higher in position of the air pollutants than NAAQS. Therefore, comparison among the average concentration of PM1, PM2.5 and PM10 in different land use is outlined in Figure 7 (h).
3.2. Concentration of CO of Different Land Use
The highest concentration of CO was found in road intersectional area (20.40 ppm), which is 2.26 times higher than NAAQS level and the lowest concentration observed in village area (1.90 ppm) which did not exceed NAAQS. Besides, among rest of the land use, sensitive, residential, commercial and industrial areas, the CO concentration value were 6.4 ppm, 7 ppm, 5 ppm and 6.25 ppm, did not exceed NAAQS as well. However, mixed area slightly crossed the NAAQS, which was 9.09 ppm. Therefore, the average concentration of CO in different land use is depicted in figure 4.
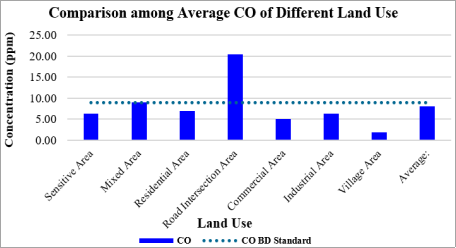
Figure 4. Average Concentration of CO in Different Land Use.
3.3. Dispersion of PM1, PM2.5, PM10 and CO
The following table 2 demonstrates the descriptive statistics for PM1, PM2.5 & PM10 and CO of the studied land uses. The maximum concentration values of PM (PM1, PM2.5 and PM10) were found in commercial area, which were 154 µg/m3, 241.50 µg/m3 and 319.25 µg/m3, respectively and mean values were observed in road intersection area which were 101.15 µg/m3, 168.30 µg/m3 and 216.10 µg/m3, respectively. However, in case of CO, both the maximum value and mean value were found in road intersection area which were 73 ppm and 20.40 ppm, respectively. Among all types of land uses, their minimum concentration (0 ppm) is seen in all land use except industrial area, lower range is found in industrial area (2 ppm) followed by village areas (7 ppm) and commercial area (10 ppm). However, Whisker Box Plot of Concentration of PM1, PM2.5, PM10, and CO in Different Land Use are presented in figure 5. With reference to mean (149.25 µg/m3), highest standard deviation (47.03 µg/m3) and coefficient of variation (31.51 %) for the PM2.5 concentration is seen at industrial area. At this juncture of the study, places for example schools, colleges, mosque etc. considered as sensitive areas, are hub of peoples gathering and where different economic activities are taking place regularly. In contrast, least standard coefficient of variation (13.96%) for PM2.5 are found at road intersection areas, the values are far distant from the mean value (168.30 µg/m3). Consequently, it is identified that the dispersion is clustered and less stretched from while the range is relatively less than other land uses. The above findings can also be presented by the following whisker box graph (Figure 5). Where industrial areas and mixed areas have dispersed extended concentration and values are highly distributed with reference to standard deviation and coefficient of variation while values in the commercial areas are highly concentrated, and data distribution is positively skewed. Sensitive are and residential areas also have dispersed concentration, in both cases values are positively skewed. The presence of two outliers in commercial area in Modal Thana and Moustafapur road due to different types of vehicle movement. Village areas and road intersection area have more concentrated values where data are positively skewed in village areas. Commercial and road intersection areas have more dispersed concentration while industrial areas have more compressed conditions for CO. Sensitive, mixed, residential and road intersection areas have very distant to distant outlier each. These made the variation greater than 100.
Table 2. Descriptive Statistics for PM1, PM2.5, PM10, and CO.

PM1

PM2.5

SI. No.

Land Use

Number of locations

Range (µg/m3)

Mean (µg/m3)

Std. Deviation (µg/m3)

Coefficient of Variation (%)

Range (µg/m3)

Mean (µg/m3

Std. Deviation (µg/m3)

Coefficient of Variation (%)

1.

Sensitive Area

10

41.50

92.40

17.35

18.78

66.75

152.93

27.64

18.07

2.

Mixed Area

11

87.58

91.27

26.03

28.52

136.00

151.58

40.44

26.68

3.

Residential Area

10

34.00

92.18

13.62

14.78

87.00

156.23

29.14

18.65

4.

Road Intersection Area

5

33.50

101.15

15.17

15.00

55.75

168.30

23.49

13.96

5.

Commercial Area

10

86.67

94.53

26.34

27.86

135.25

153.28

40.20

26.23

6.

Industrial Area

4

63.00

90.13

29.48

32.72

101.75

149.25

47.03

31.51

7.

Village Area

10

37.50

92.68

13.18

31.51

66.50

152.18

22.01

14.46

Table 2. Continued.

PM10

CO

SI. No.

Land Use

Range (µg/m3)

Mean (µg/m3)

Std. Deviation (µg/m3)

Coefficient of Variation (%)

Range (ppm)

Mean (ppm)

Std. Deviation (ppm)

Coefficient of Variation (%)

1.

Sensitive Area

85.75

197.15

36.15

18.34

39

6.40

11.88

185.64

2.

Mixed Area

180.50

189.93

54.74

28.82

45

9.09

12.53

137.78

3.

Residential Area

107.50

202.42

36.93

18.24

21

7.00

8.10

115.67

4.

Road Intersection Area

71.75

216.10

31.63

14.64

73

20.40

29.80

146.10

5.

Commercial Area

181.25

199.20

54.02

27.12

10

5.00

4.45

88.94

6.

Industrial Area

132.50

192.38

61.59

32.01

2

6.25

0.96

15.32

7.

Village Area

84.50

195.47

27.62

14.13

7

1.90

3.07

161.65

3.4. ANOVA for Significance Test
ANOVA test finds out if results are significant or not, as well as to figure out the acceptance or rejection of hypothesis. Here, table 3 illustrates one-way ANOVA test results for justifying main effect and an interaction effect of air pollutant data. This is performed to find whether the changes in the concentration of all the parameters between and within land uses are significant. The following table shows that the change of PM1, PM2.5, PM10, and CO of value are different and somewhat significant as the P value (Probability value) is different than the significance level (a pre-specified threshold). Therefore, concentration for PM2.5, PM10 and CO are not significant as the ‘Significance values’ on ANOVA test are 0.984, 0.978, 0.962 and 0.189 respectively much greater than 0.05.
Table 3. Significance Test.

ANOVA

Sum of Squares

df

Mean Square

F

Sig.

PM1

Between Groups

432.189

6

72.031

0.170

0.984

Within Groups

22490.009

53

424.340

Total

22922.197

59

PM2.5

Between Groups

1274.201

6

212.367

0.192

0.978

Within Groups

58621.606

53

1106.068

Total

59895.807

59

PM10

Between Groups

2761.494

6

460.249

0.238

0.962

Within Groups

102508.124

53

1934.116

Total

105269.618

59

CO

Between Groups

1250.174

6

208.362

1.524

0.189

Within Groups

7248.159

53

136.758

Total

8498.333

59

Figure 5. Whisker Box Plot of Concentration of PM1, PM2.5, PM10, and CO in Different Land Use. Whisker Box Plot of Concentration of PM1, PM2.5, PM10, and CO in Different Land Use.
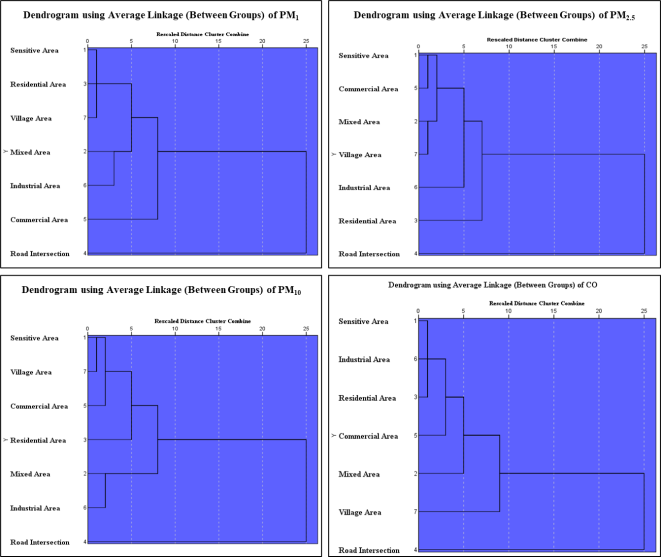
Figure 6. Rescaled Distance Cluster Combine for PM1, PM2.5, PM10, and CO.
3.5. Land Use Based Cluster Analysis
Cluster analysis in air pollution study is another exploratory data analysis method that can group a set of pollutants in such a way so as to objects in the same cluster more similar to each other than to those in other clusters. Each object belongs to a separate cluster. At each step, the two clusters that are most similar are joined into a single new cluster. Once attached, objects are never separated. In this section, the following dendrogram cluster analysis illustrates individual summary of each pollutant through the group average clustering algorithm. In discussion, horizontal axis of the dendrogram represents the distance or dissimilarity between clusters and the vertical axis signifies the objects and clusters to interpret similarity and clustering. Rescaled distance cluster combine for PM1, PM2.5, PM10, and CO are depicted in figure 6. For this analysis, between group average linkage and Euclidean distance have been considered. Firstly, found there are four clusters in terms of PM1, where sensitive, residential, and village areas are in the first cluster. Then mixed and industrial areas create a second cluster. Again, commercial and road intersection areas create third and fourth cluster separately. After that, the first and second cluster joins each other at 5 linkage distance. Once more, the third cluster joins with this cluster at approximately 8 linkage distance. To begin with first cluster consists of sensitive, commercial, mixed and village areas for PM2.5. Furthermore, the second cluster includes industrial area whereas third cluster includes residential area alone and followed by fourth cluster road intersection area. Afterward it is visible that, first and second clusters join each other at approximate distance of 5 and furthermore this broader cluster joins with third cluster at the approximate distance of 7. For PM10 again 4 cluster have been found where first cluster consists of sensitive, village, commercial and residential areas. Subsequently the second cluster includes residential area alone, third cluster involves mixed and industrial areas and only road intersection remains in the fourth cluster. Then it is evident that, first and second clusters join respectively at approximate distance of 5 which joins with third cluster at the approximate distance of 8. Primarily four clusters have been found for CO graph where the first cluster consists of sensitive, industrial, residential and commercial areas. The second and third cluster consists of only mixed area and village area alone respectively. Following that, the fourth cluster includes only road intersection area. Then it is apparent, first and second clusters join at the approximate distance of 5 which joins with third cluster at the approximate distance of 9. Finally, the aforementioned cluster joins with the fourth cluster where connection distance is approximately 25 for all four pollutants.
3.6. PM1, PM2.5, PM10 and CO Concentration in Moulvibazar District Town in 2021
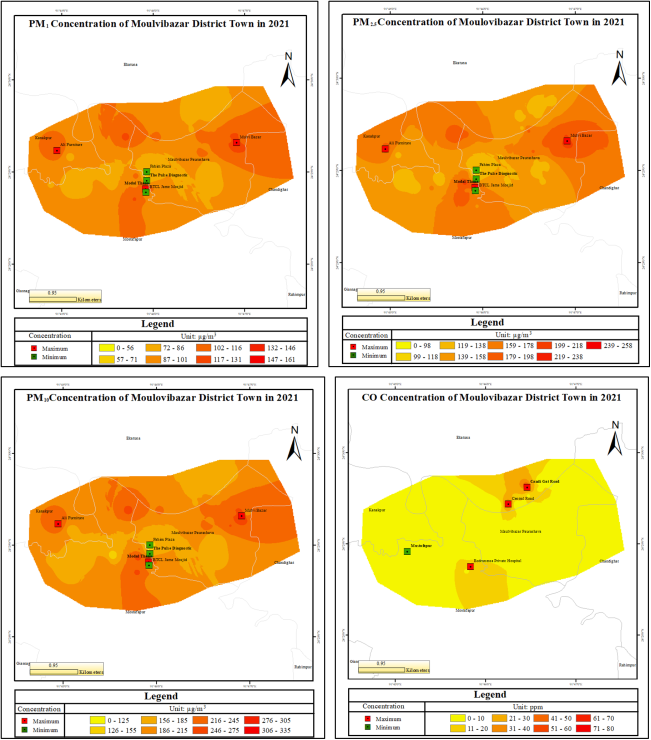
Figure 7. PM1, PM2.5, PM10 and CO Concentration in Moulvibazar District Town in 2021.
Figure 7 shows the concentration of Particulate Matter PM1, PM2.5, PM10 and CO at various location of Moulvibazar district town in the year of 2021. Concentrations of Particulate Matter are expressed in µg/m3. The concentration of µg/m3 mean one millionth of gram of PM per cubic meter air. The concentration of 1 ppm means that for every million molecules of gas in the measured volume, one of them is a carbon monoxide molecule. Yellow areas have less, while progressively higher concentrations are shown in orange and red. Concentration of 1 ppm means that for every million molecules of gas in the measured volume, one of them is a carbon monoxide molecule. Concentration of PM was found to higher in Bodrunessa Private Hospital, Study Care Academy, Mustafapur Jame Mosjid, Mustafapur Govt Primary School, Mosjiduna Nur Jama Mosque, Jela Porishad, Kashinath School and Collage, Mustofapur Abashik, Babur Colony, Grizapara, East Girzapara, Forest Road, Kashinath Road, Soirpur Road, Soirpor Road Block B, Santibag, M. Saifur Rahman Road, Purbo Mustafapur, Fahim Plaza, The Pulse Diagnostic, BTCL Jame Mosjid, Diamond Plaza, Court Road, Sonali Bank, Central Road, Old School Road, Poschim Bazar, Mulvi Bazar, Moustafa Pur Road, Shrimonggol Road, Bangal Convention Hall, Modal Thana, Dhaka Bus Stand, Chomohoni Road, Court Road, Candi Gat Road, Kudrat Ullah Road, Kusumbag Point, Ali Furniture, Samsu Food, Nasir Saw Mill, Bengal Food, Islambag and Islampur. It also illustrates that PM concentration was lower in Purbo Mustafapur, Fahim Plaza, The Pulse Diagnostic, BTCL Jame Mosjid, Diamond Plaza, Court Road, Sonali Bank, Central Road, Old School Road, Poschim Bazar, Mulvi Bazar, Mosque Market, Kacha Bazar, Krishi Market, M Saifur Rahaman Road, Nodir Par, Moustafa Pur Road, Shrimonggol Road, Bangal Convention Hall, Modal Thana, Dhaka Bus Stand, Chomohoni Road, Court Road, Candi Gat Road, Kudrat Ullah Road, Kusumbag Point, Ali Furniture, Samsu Food, Nasir Saw Mill and Bengal Food. The maximum concentration is shown with red flag and minimum concentration with green flag. Additionally, higher concentrations (39-80ppm) are demonstrated in orange and red. Comparatively heavy pollution was observed in center of Bodrunessa Private Hospital, Central Road and Candi Gat Road. It also shows the maximum concentration with red flag and minimum concentration with green flag.
According to the concentration (µg/m3) of PM1, PM2.5 and PM10 among 60 locations 3 most polluted places were Modal Thana (commercial area), Mulvi Bazar (mixed area) and Ali Furniture (industrial area) and 3 least polluted places were in-front of the Pulse Diagnostic, Fahim Plaza and BTCL Jame Mosjid. It has mentioned that among 3 lease polluted locations, were from mixed area. It was also noted that the concentrations of PM2.5 and PM10 found in the most polluted area were 3.71 and 2.13 times higher than NAAQS.
3.7. AQI on PM2.5 Concentration of Moulvibazar District Town in 2021
The AQI map of Moulvibazar district town, based on PM2.5 levels in Figure 8 shows various colors representing different AQI categories according to the Bangladesh National Ambient Air Pollution Standard. The highest AQI was observed in the Modal Thana area, with the majority of Moulvibazar particularly Modal Thana, Moulvibazar, and Ali Furniture falling into the 201-300 range, which is classified as very unhealthy and marked in red. The map also indicates the areas with the highest concentration using a red flag and those with the lowest concentration using a green flag. Some parts of Moulvibazar district town had an AQI in the 151-200 range, categorized as unhealthy and shown in orange. The lowest AQI levels were found at The Pulse Diagnostic, Fahim Plaza, and BTCL Jame Mosjid.
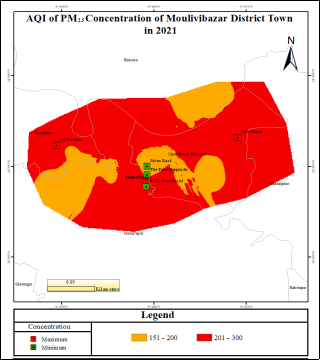
Figure 8. AQI map of Moulvibazar District town in 2021 based on PM2.5.
4. Discussion
This study provides a comprehensive analysis of particulate matter (PM) concentrations across different land uses in the Moulvibazar Sadar area, revealing significant insights into air quality and its variation based on land use type. The average concentrations of PM1, PM2.5 and PM10 across all locations were found to be 93.47 µg/m3, 154.82 µg/m3, and 198.95 µg/m3, respectively. These findings underscore a pronounced disparity in air quality across various land uses, with implications for public health and environmental policy. The data indicate that the road intersection areas experienced the highest average concentration of PM2.5 at 168.30 µg/m3, followed closely by residential areas (156.23 µg/m3) and commercial areas (153.28 µg/m3). This ranking highlights the critical role of traffic-related emissions in contributing to elevated PM2.5 levels, as road intersections are often high-traffic zones where vehicle emissions are concentrated . The higher PM2.5 concentrations in these areas compared to sensitive areas (152.93 µg/m3), village areas (152.18 µg/m3), and mixed areas (151.58 µg/m3) suggest that vehicle emissions and possibly industrial activities play a more significant role in increasing particulate matter levels in urban settings. A study conducted in Chittagong found that the average concentration of PM2.5 was highest in the industrial area, with a level of 175.36 µg/m3 . Similarly, research in Rajshahi reported the highest pollution levels in industrial zones . Additionally, another study by Majumder et al. in Lakshmipur identified commercial zones as having the highest concentrations of PM1, PM2.5 and PM10. Moreover, the concentration of PM2.5 was found to be 2.38 times higher than the NAAQS, indicating a severe air quality issue in the studied areas. This deviation from the standard poses serious health risks, given that PM2.5 can penetrate deep into the respiratory system and is associated with various health problems, including respiratory and cardiovascular diseases .
The study's findings also highlight the distribution of particulate matter, with PM2.5 constituting 77.95% of PM10 and PM1 comprising 60.38% of PM2.5. These ratios suggest that a substantial portion of the particulate matter is fine, which is particularly concerning because fine particles are more hazardous to human health due to their ability to penetrate deeper into the lungs and enter the bloodstream . In terms of dispersion, the maximum range of PM1, PM2.5 and PM10 concentrations was observed in mixed and industrial areas, with residential and road intersection areas showing the minimum range. The higher coefficient of variation in industrial areas compared to road intersections suggests greater variability in pollutant concentrations in industrial zones, potentially due to fluctuating emissions from different industrial sources. Besides, the whisker box plots reveal that the concentration values are more dispersed in industrial, mixed, and village areas, while residential and road intersection areas exhibit more concentrated values. This dispersion indicates more uniform exposure to particulate matter in residential and road intersection areas compared to the broader variability in industrial and mixed-use areas. Furthermore, statistical analysis further indicates that there were no significant changes in the concentrations of PM1, PM2.5 and PM10 across different land uses, as evidenced by p-values greater than 0.05. This result suggests that, while there are variations in pollutant levels between land uses, these differences are not statistically significant enough to indicate a strong impact of land use type on air quality.
5. Conclusion
The findings of the study reveals that the average levels of PM1, PM2.5, and PM10 were higher than NAAQS in Moulovibazar district, with PM2.5 concentrations exceeding the NAAQS by 2.38 times. The average PM2.5/PM10 ratio was calculated as 77.95% and the PM1/PM2.5 ratio as 60.38%. The study uniquely detailed the variations in PM2.5 across different land uses, ordered by average PM2.5 concentration from highest to lowest as, road intersection area (168.30 µg/m3) > residential area (156.23) > commercial area (153.28 µg/m3) > sensitive area (152.93 µg/m3) > village area (152.18 µg/m3) > mixed area (151.58 µg/m3) > Industrial area (149.25). The research also revealed that CO levels averaged 8.01 ppm in the district, which also exceed NAAQS. A key novel contribution is the detailed analysis of dispersion patterns and variability, with the highest variability observed in industrial areas and the lowest in residential and road intersection areas. The study’s use of dendrogram analysis to identify clustering patterns of PM types, which merged into a single cluster at a distance of approximately 25, offers new insights into the spatial distribution of PM. Therefore, these findings provide a comprehensive understanding of PM distribution in Moulvibazar Sadar and highlight areas needing targeted air quality management.
Abbreviations

AQI

Air Quality Index

AQLI

Air Quality Life Index

CARB

California Air Resources Board

DCCEEW

Department of Climate Change, Energy, the Environment and Water

DoE

Department of Environment of Bangladesh

EIU

Economist Intelligence Unit

NAAQS

National Ambient Air Quality Standards

NRDC

Natural Resources Defense Council

PM

Particulate Matter

UNEP

United Nations Environment Programme

U.S. EPA

U.S. Environmental Protection Agency

Author Contributions
Ahmad Kamruzzaman Majumder: Conceptualization, Investigation, Funding acquisition, Resources, Project administration, Supervision
Md. Monjur Hossain: Formal Analysis, Data curation, Software, Funding acquisition, Methodology, Validation, Visualization, Writing - original draft, Writing - review & editing
Conflicts of Interest
The authors declare no conflicts of interest.
References
[1] UNEP - United Nations Environment Programme (2023). Air Pollution Note: Data You Need to Know. UNEP. Retrieved August 27, 2024, from
[2] NRDC - Natural Resources Defense Council (2024). Clean air. Natural Resources Defense Council. Retrieved August 27, 2024, from
[3] WHO- World Health Organization (2024). Air pollution. Retrieved August 25, 2024, from
[4] DCCEEW - Department of Climate Change, Energy, the Environment and Water (2024). Air pollutants. Australian Government. Retrieved from
[5] U.S. EPA - U.S. Environmental Protection Agency (2024a). Particulate matter (PM) basics. Retrieved August 25, 2024, from
[6] CARB - California Air Resources Board (2024a). Inhalable particulate matter and health. Retrieved August 27, 2024, from
[7] World Bank (2022a). Fighting air pollution: A deadly killer and core development challenge. World Bank. Retrieved August 27, 2024, from
[8] AQLI-Air Quality Life Index Report (2023). The first pollution index to show what the threat of air pollution means to a person’s life anywhere in the world.
[9] Thangavel, P., Park, D. and Lee, Y. (2022). Recent Insights into Particulate Matter (PM2.5)-Mediated Toxicity in Humans: An Overview. Int J Environ Res Public Health, 19(12), 7511.
[10] CARB - California Air Resources Board (2024b). Carbon monoxide & health. Retrieved from
[11] EIU - Economist Intelligence Unit (2024). The global livability index 2024: Summary report. Economist Intelligence Unit. Retrieved August 27, 2024, from
[12] Majumder, A. K., Rahman, M., Patoary, M. N. A., Kamruzzaman, A. M. and Majumder, R. (2024a). Time Series Analysis PM2.5 Concentration for Capital City Dhaka from 2016 to 2023. Science Frontiers, 5(1): 35-42.
[13] World Bank (2023). Bangladesh needs urgent actions to curb air pollution. Retrieved from
[14] DoE - Department of Environment (2019). Sources of Air Pollution in Bangladesh (Brick Kiln & Vehicle Emission Scenario). Clean Air and Sustainable Environment Project. Retrieved from
[15] Majumder, A. K., Akbar, A. T. M. M., Rahman, M., Patoary, M. N. A., Islam, M. R., and Majumder, R. (2024b). Monsoon Season Spatial Distribution of Particulates Concentration in the Road Intersection Area of Different Land Use in Major City in South Asian Countries. Journal of Health and Environmental Research, 10(1): 15-28.
[16] Wang, P., Zhang, R., Sun, S., Gao, M., Zheng, B., Zhang, D., Zhang, Y., Carmichael, G. R., and Zhang, H. (2023). Aggravated air pollution and health burden due to traffic congestion in urban China. Atmos. Chem. Phys., 23, 2983-2996.
[17] Majumder, A. K., Kamruzzaman, Tareq, M. S., Rahman, M., Islam, M. and Patoary, M. N. A. (2024ᶜ). Status of Ambient Air Quality in Chattogram Metropolitan, Bangladesh. International Journal of Research in Environmental Science (IJRES), 10(1): 1-13.
[18] Majumder, A. K., Kamruzzaman, A. M., Rahman, M. and Patoary, M. N. A. (2023a). Status of air quality in Rajshahi metropolitan area, Bangladesh. GSC Advanced Research and Reviews 18(1): 201-212.
[19] Majumder, A. K., Ullah, M. S., Rahman, M. and Patoary, M. N. A. (2023b). Spatial Distribution of Air Quality in Lakshmipur District Town, Bangladesh: A Winter Time Observation. Multidisciplinary International Journal of Research and Development (MIJRD), 3(6): 52-65.
[20] U.S. EPA - Environmental Protection Agency. (2024b). Health and environmental effects of particulate matter (PM). U.S. Environmental Protection Agency. Retrieved September 5, 2024, from
[21] Rules, E. C. (2023). Department of Environment. Ministry of Environment, Forest and Climate Change. People’s Republic of Bangladesh.
Cite This Article
  • APA Style

    Majumder, A. K., Hossain, M. M., Rahman, M., Sobnam, M., Patoary, M. N. A. (2025). Spatial Distribution of Air Quality in Moulvibazar District Town, Bangladesh: A Wintertime Observation. Journal of Energy, Environmental & Chemical Engineering, 10(1), 12-25. https://doi.org/10.11648/j.jeece.20251001.12

    Copy | Download

    ACS Style

    Majumder, A. K.; Hossain, M. M.; Rahman, M.; Sobnam, M.; Patoary, M. N. A. Spatial Distribution of Air Quality in Moulvibazar District Town, Bangladesh: A Wintertime Observation. J. Energy Environ. Chem. Eng. 2025, 10(1), 12-25. doi: 10.11648/j.jeece.20251001.12

    Copy | Download

    AMA Style

    Majumder AK, Hossain MM, Rahman M, Sobnam M, Patoary MNA. Spatial Distribution of Air Quality in Moulvibazar District Town, Bangladesh: A Wintertime Observation. J Energy Environ Chem Eng. 2025;10(1):12-25. doi: 10.11648/j.jeece.20251001.12

    Copy | Download

  • @article{10.11648/j.jeece.20251001.12,
      author = {Ahmad Kamruzzaman Majumder and Md. Monjur Hossain and Marziat Rahman and Mohoua Sobnam and Md. Nasir Ahmmed Patoary},
      title = {Spatial Distribution of Air Quality in Moulvibazar District Town, Bangladesh: A Wintertime Observation
    },
      journal = {Journal of Energy, Environmental & Chemical Engineering},
      volume = {10},
      number = {1},
      pages = {12-25},
      doi = {10.11648/j.jeece.20251001.12},
      url = {https://doi.org/10.11648/j.jeece.20251001.12},
      eprint = {https://article.sciencepublishinggroup.com/pdf/10.11648.j.jeece.20251001.12},
      abstract = {Since air pollution in Bangladesh's urban areas is becoming more prevalent, most study has concentrated on major metropolitan cities, leaving smaller urban centers understudied. In order to address that gap, this study investigated the air quality in Moulvibazar, a district of Sylhet Division. This study aims to assess the concentrations of Particulate Matter (PM1, PM2.5 and PM10) and Carbon Monoxide (CO) across different land-use types in district town of Moulvibazar. Air quality monitoring was conducted at 60 locations using a portable Air Quality Monitor, Indoor Outdoor Formaldehyde (HCHO) Detector (Model: DM106) and a portable CO Meter (Model: AS8700A) to determine the parameters. Descriptive statistics and whisker box plots were also employed to analyze and visualize the variations in pollutant concentrations across different locations. Additionally, ArcGIS software (10.4.1. version) was used for spatial analysis, and a dendrogram plot was created to classify and interpret data clusters, providing a deeper understanding of the spatial distribution of pollutants. The Department of Environment (DoE) established Bangladesh National Ambient Air Quality Standard (NAAQS) for PM2.5, PM10, and carbon monoxide (CO) at 65 µg/m3, 150 µg/m3, and 9 ppm, respectively. Results indicated that the average concentrations of PM1, PM2.5 and PM10 across these locations were 93.47 µg/m3, 154.82 µg/m3, and 198.95 µg/m3, respectively. The most polluted location was Modal Thana (a commercial area) where PM1, PM2.5 and PM10 concentration were 154, 241.5 and 319.25 µg/m3, respectively. CO concentrations in the most polluted area were found to be 2.27 times higher than the NAAQS standards. Despite these findings, the variations in pollutant concentrations across different land-use types were statistically insignificant. Road intersections recorded the highest average PM2.5 concentration (168.30 µg/m3), whereas the lowest average data of PM2.5 found in industrial areas (149.25 µg/m3). The study finds worthwhile air quality issues in Moulvibazar, with pollutant levels exceeding the NAAQS. Urgent actions, such as pollution control and sustainable urban development, are required to address these concerns.
    },
     year = {2025}
    }
    

    Copy | Download

  • TY  - JOUR
    T1  - Spatial Distribution of Air Quality in Moulvibazar District Town, Bangladesh: A Wintertime Observation
    
    AU  - Ahmad Kamruzzaman Majumder
    AU  - Md. Monjur Hossain
    AU  - Marziat Rahman
    AU  - Mohoua Sobnam
    AU  - Md. Nasir Ahmmed Patoary
    Y1  - 2025/02/27
    PY  - 2025
    N1  - https://doi.org/10.11648/j.jeece.20251001.12
    DO  - 10.11648/j.jeece.20251001.12
    T2  - Journal of Energy, Environmental & Chemical Engineering
    JF  - Journal of Energy, Environmental & Chemical Engineering
    JO  - Journal of Energy, Environmental & Chemical Engineering
    SP  - 12
    EP  - 25
    PB  - Science Publishing Group
    SN  - 2637-434X
    UR  - https://doi.org/10.11648/j.jeece.20251001.12
    AB  - Since air pollution in Bangladesh's urban areas is becoming more prevalent, most study has concentrated on major metropolitan cities, leaving smaller urban centers understudied. In order to address that gap, this study investigated the air quality in Moulvibazar, a district of Sylhet Division. This study aims to assess the concentrations of Particulate Matter (PM1, PM2.5 and PM10) and Carbon Monoxide (CO) across different land-use types in district town of Moulvibazar. Air quality monitoring was conducted at 60 locations using a portable Air Quality Monitor, Indoor Outdoor Formaldehyde (HCHO) Detector (Model: DM106) and a portable CO Meter (Model: AS8700A) to determine the parameters. Descriptive statistics and whisker box plots were also employed to analyze and visualize the variations in pollutant concentrations across different locations. Additionally, ArcGIS software (10.4.1. version) was used for spatial analysis, and a dendrogram plot was created to classify and interpret data clusters, providing a deeper understanding of the spatial distribution of pollutants. The Department of Environment (DoE) established Bangladesh National Ambient Air Quality Standard (NAAQS) for PM2.5, PM10, and carbon monoxide (CO) at 65 µg/m3, 150 µg/m3, and 9 ppm, respectively. Results indicated that the average concentrations of PM1, PM2.5 and PM10 across these locations were 93.47 µg/m3, 154.82 µg/m3, and 198.95 µg/m3, respectively. The most polluted location was Modal Thana (a commercial area) where PM1, PM2.5 and PM10 concentration were 154, 241.5 and 319.25 µg/m3, respectively. CO concentrations in the most polluted area were found to be 2.27 times higher than the NAAQS standards. Despite these findings, the variations in pollutant concentrations across different land-use types were statistically insignificant. Road intersections recorded the highest average PM2.5 concentration (168.30 µg/m3), whereas the lowest average data of PM2.5 found in industrial areas (149.25 µg/m3). The study finds worthwhile air quality issues in Moulvibazar, with pollutant levels exceeding the NAAQS. Urgent actions, such as pollution control and sustainable urban development, are required to address these concerns.
    
    VL  - 10
    IS  - 1
    ER  - 

    Copy | Download

Author Information
  • Abstract
  • Keywords
  • Document Sections

    1. 1. Introduction
    2. 2. Materials and Methods
    3. 3. Results and Discussion
    4. 4. Discussion
    5. 5. Conclusion
    Show Full Outline
  • Abbreviations
  • Author Contributions
  • Conflicts of Interest
  • References
  • Cite This Article
  • Author Information